|
|
市場調査レポート
商品コード
1738911
FTIR分光計の世界市場:2025年Global FTIR Spectrometer Market Research Report 2025 |
||||||
|
|||||||
カスタマイズ可能
適宜更新あり
|
|||||||

| FTIR分光計の世界市場:2025年 |
|
出版日: 2025年06月03日
発行: QYResearch
ページ情報: 英文 124 Pages
納期: 2~3営業日
|

全表示
- 概要
- 図表
- 目次
世界のFTIR分光計の市場規模は、2024年に3億2,274万米ドルとなりました。
同市場は、2031年には4億3,020万米ドルに達すると予測され、予測期間の2025年~2031年のCAGRは4.21%になるとみられています。
FTIRスペクトロメータの世界の主要メーカーには、Thermo Fisher Scientific、PerkinElmer、Bruker、Agilent Technologies、Shimadzuなどが含まれ、2024年には世界の上位3ベンダーが売上高の約53%を占めています。
当レポートは、FTIRスペクトロメータの世界市場を定量的・定性的分析の両面から包括的に紹介し、読者がビジネス/成長戦略を策定し、市場競合状況を評価し、現在の市場における自社のポジションを分析し、FTIRスペクトロメータに関する十分な情報に基づいたビジネス上の意思決定を行えるようにすることを目的としています。
FTIR分光計の市場規模・推計・予測は、2024年を基準年として、生産量/出荷台数(台)と収益(100万米ドル)で提供し、2020年から2031年までの期間の履歴データと予測データを掲載しています。本レポートでは、世界のFTIR分光計市場を包括的にセグメント化しています。製品タイプ別、エンドユーザー別、参入企業別の地域別市場規模も掲載しています。
市場をより深く理解するために、競合情勢、主要競合企業、それぞれの市場順位などのプロファイルを掲載しています。また、技術動向や新製品開発についても論じています。
企業別、タイプ別、エンドユーザー別、地域別など、さまざまなセグメントにわたる市場全体とサブセグメントの収益、生産量、平均価格に関する情報を提供することで、この市場におけるFTIR分光計メーカー、新規参入企業、産業チェーン関連企業の助けとなります。
目次
第1章 FTIR分光計市場概要
- 製品定義
- FTIR分光計、タイプ別
- FTIR分光計、エンドユーザー別
- 世界市場の成長見通し
- 前提と制限
第2章 メーカーによる市場競争
第3章 FTIR分光計の販売台数、地域別
- 世界のFTIR分光計の販売台数予測、地域別
- 世界のFTIR分光計の販売台数と販売額(2020年~2031年)、地域別
- 北米
- 欧州
- アジア太平洋
- 南米
- 中東・アフリカ
第4章 タイプ別セグメント
- 世界のFTIR分光計の販売台数、タイプ別(2020年~2031年)
- 世界のFTIR分光計の販売額、タイプ別(2020年~2031年)
- 世界のFTIR分光計の価格、タイプ別(2020年~2031年)
第5章 エンドユーザー別セグメント
- 世界のFTIR分光計の販売台数、エンドユーザー別(2020年~2031年)
- 世界のFTIR分光計の販売額、エンドユーザー別(2020年~2031年)
- 世界のFTIR分光計の価格、エンドユーザー別(2020年~2031年)
第6章 主要企業のプロファイル
- Thermo Fisher Scientific
- PerkinElmer
- Bruker
- Agilent Technologies
- Shimadzu
- ABB
- Jasco
- MKS
- Tianjin Gangdong
- Beifen-Ruili
- Skyray Instrument
第7章 FTIR分光計の製造コスト分析
- FTIR分光計別主要原材料分析
- 製造コスト構造比
- FTIR分光計の製造プロセス分析
第8章 販売チャネル、販売代理店、トレーダー、ディーラー
- 販売チャネル
- 販売チャネル:直接チャネルと間接チャネル
- ダイレクトチャネルの長所と短所
- 間接チャネルの長所と短所
- 市場ポジショニング
第9章 市場力学
第10章 調査結果と結論
第11章 調査手法とデータソース
List of Tables
- Table 1. Global FTIR Spectrometer Market Value by Type, (US$ Million)
- Table 2. Global FTIR Spectrometer Market Value by End Users, (US$ Million)
- Table 3. Global FTIR Spectrometer Sales by Manufacturers (2022-2024) & (Units)
- Table 4. Global FTIR Spectrometer Sales Market Share by Manufacturers (2022-2024)
- Table 5. Global FTIR Spectrometer Sales Value by Manufacturers (2022-2024) & (US$ Million)
- Table 6. Global FTIR Spectrometer Sales Value Share by Manufacturers (2022-2024)
- Table 7. Company Type (Tier 1, Tier 2, and Tier 3) & (based on the Sales Value in FTIR Spectrometer as of 2024)
- Table 8. Global Market FTIR Spectrometer Average Price by Manufacturers (K US$/Unit) & (2022-2024)
- Table 9. Global Key Manufacturers of FTIR Spectrometer, Established Time and Headquarters
- Table 10. Global FTIR Spectrometer Manufacturers Market Concentration Ratio
- Table 11. Mergers & Acquisitions, Expansion Plans
- Table 12. Global FTIR Spectrometer Sales Value by Region (US$ Million)
- Table 13. Global FTIR Spectrometer Sales Value by Region (2020-2025) & (US$ Million)
- Table 14. Global FTIR Spectrometer Sales Value Market Share by Region (2020-2025)
- Table 15. Global FTIR Spectrometer Forecasted Sales Value by Region (2026-2031) & (US$ Million)
- Table 16. Global FTIR Spectrometer Forecasted Sales Value Market Share by Region (2026-2031)
- Table 17. Global FTIR Spectrometer Sales by Region (2020-2025) & (Units)
- Table 18. Global FTIR Spectrometer Sales Market Share by Region (2020-2025)
- Table 19. Global FTIR Spectrometer Forecasted Sales by Region (2026-2031) & (Units)
- Table 20. Global FTIR Spectrometer Forecasted Sales Market Share by Region (2026-2031)
- Table 21. North America FTIR Spectrometer Sales Value by Country (2020-2025) & (US$ Million)
- Table 22. North America FTIR Spectrometer Sales Value by Country (2026-2031) & (US$ Million)
- Table 23. North America FTIR Spectrometer Sales by Country (2020-2025) & (Units)
- Table 24. North America FTIR Spectrometer Sales by Country (2026-2031) & (Units)
- Table 25. Europe FTIR Spectrometer Sales Value by Country (2020-2025) & (US$ Million)
- Table 26. Europe FTIR Spectrometer Sales Value by Country (2026-2031) & (US$ Million)
- Table 27. Europe FTIR Spectrometer Sales by Country (2020-2025) & (Units)
- Table 28. Europe FTIR Spectrometer Sales by Country (2026-2031) & (Units)
- Table 29. Asia Pacific FTIR Spectrometer Sales Value by Region (2020-2025) & (US$ Million)
- Table 30. Asia Pacific FTIR Spectrometer Sales Value by Region (2026-2031) & (US$ Million)
- Table 31. Asia Pacific FTIR Spectrometer Sales by Region (2020-2025) & (Units)
- Table 32. Asia Pacific FTIR Spectrometer Sales by Region (2026-2031) & (Units)
- Table 33. South America FTIR Spectrometer Sales Value by Country (2020-2025) & (US$ Million)
- Table 34. South America FTIR Spectrometer Sales Value by Country (2026-2031) & (US$ Million)
- Table 35. South America FTIR Spectrometer Sales by Country (2020-2025) & (Units)
- Table 36. South America FTIR Spectrometer Sales by Country (2026-2031) & (Units)
- Table 37. Middle East & Africa FTIR Spectrometer Sales Value by Country (2020-2025) & (US$ Million)
- Table 38. Middle East & Africa FTIR Spectrometer Sales Value by Country (2026-2031) & (US$ Million)
- Table 39. Middle East & Africa FTIR Spectrometer Sales by Country (2020-2025) & (Units)
- Table 40. Middle East & Africa FTIR Spectrometer Sales by Country (2026-2031) & (Units)
- Table 41. Global FTIR Spectrometer Sales (Units) by Type (2020-2025)
- Table 42. Global FTIR Spectrometer Sales (Units) by Type (2026-2031)
- Table 43. Global FTIR Spectrometer Sales Market Share by Type (2020-2025)
- Table 44. Global FTIR Spectrometer Sales Market Share by Type (2026-2031)
- Table 45. Global FTIR Spectrometer Sales Value (US$ Million) by Type (2020-2025)
- Table 46. Global FTIR Spectrometer Sales Value (US$ Million) by Type (2026-2031)
- Table 47. Global FTIR Spectrometer Sales Value Market Share by Type (2020-2025)
- Table 48. Global FTIR Spectrometer Sales Value Market Share by Type (2026-2031)
- Table 49. Global FTIR Spectrometer Price (K US$/Unit) by Type (2020-2025)
- Table 50. Global FTIR Spectrometer Price (K US$/Unit) by Type (2026-2031)
- Table 51. Global FTIR Spectrometer Sales (Units) by End Users (2020-2025)
- Table 52. Global FTIR Spectrometer Sales (Units) by End Users (2026-2031)
- Table 53. Global FTIR Spectrometer Sales Market Share by End Users (2020-2025)
- Table 54. Global FTIR Spectrometer Sales Market Share by End Users (2026-2031)
- Table 55. Global FTIR Spectrometer Sales Value (US$ Million) by End Users (2020-2025)
- Table 56. Global FTIR Spectrometer Sales Value (US$ Million) by End Users (2026-2031)
- Table 57. Global FTIR Spectrometer Sales Value Market Share by End Users (2020-2025)
- Table 58. Global FTIR Spectrometer Sales Value Market Share by End Users (2026-2031)
- Table 59. Global FTIR Spectrometer Price (K US$/Unit) by End Users (2020-2025)
- Table 60. Global FTIR Spectrometer Price (K US$/Unit) by End Users (2026-2031)
- Table 61. Thermo Fisher Scientific Company Details
- Table 62. Company and Business Overview
- Table 63. Thermo Fisher Scientific FTIR Spectrometer Introduction
- Table 64. Thermo Fisher Scientific Revenue, Sales, Price and Gross Margin in FTIR Spectrometer Business (2022-2024)
- Table 65. PerkinElmer Company Details
- Table 66. Company and Business Overview
- Table 67. PerkinElmer FTIR Spectrometer Introduction
- Table 68. PerkinElmer Revenue, Sales, Price and Gross Margin in FTIR Spectrometer Business (2022-2024)
- Table 69. Bruker Company Details
- Table 70. Company and Business Overview
- Table 71. Bruker FTIR Spectrometer Introduction
- Table 72. Bruker Revenue, Sales, Price and Gross Margin in FTIR Spectrometer Business (2022-2024)
- Table 73. Agilent Technologies Company Details
- Table 74. Company and Business Overview
- Table 75. Agilent Technologies FTIR Spectrometer Introduction
- Table 76. Agilent Technologies Revenue, Sales, Price and Gross Margin in FTIR Spectrometer Business (2022-2024)
- Table 77. Shimadzu Company Details
- Table 78. Company and Business Overview
- Table 79. Shimadzu FTIR Spectrometer Introduction
- Table 80. Shimadzu Revenue, Sales, Price and Gross Margin in FTIR Spectrometer Business (2022-2024)
- Table 81. ABB Company Details
- Table 82. Company and Business Overview
- Table 83. ABB FTIR Spectrometer Introduction
- Table 84. ABB Revenue, Sales, Price and Gross Margin in FTIR Spectrometer Business (2022-2024)
- Table 85. Jasco Company Details
- Table 86. Company and Business Overview
- Table 87. Jasco FTIR Spectrometer Introduction
- Table 88. Jasco Revenue, Sales, Price and Gross Margin in FTIR Spectrometer Business (2022-2024)
- Table 89. MKS Company Details
- Table 90. Company and Business Overview
- Table 91. MKS FTIR Spectrometer Introduction
- Table 92. MKS Revenue, Sales, Price and Gross Margin in FTIR Spectrometer Business (2022-2024)
- Table 93. Tianjin Gangdong Company Details
- Table 94. Company and Business Overview
- Table 95. Tianjin Gangdong FTIR Spectrometer Introduction
- Table 96. Tianjin Gangdong Revenue, Sales, Price and Gross Margin in FTIR Spectrometer Business (2022-2024)
- Table 97. Beifen-Ruili Company Details
- Table 98. Company and Business Overview
- Table 99. Beifen-Ruili FTIR Spectrometer Introduction
- Table 100. Beifen-Ruili Revenue, Sales, Price and Gross Margin in FTIR Spectrometer Business (2022-2024)
- Table 101. Skyray Instrument Company Details
- Table 102. Company and Business Overview
- Table 103. Skyray Instrument FTIR Spectrometer Introduction
- Table 104. Skyray Instrument Revenue, Sales, Price and Gross Margin in FTIR Spectrometer Business (2022-2024)
- Table 105. Key Raw Materials
- Table 106. Market Key Trends
- Table 107. Key Challenges
- Table 108. Market Favorable Factors and Unfavorable Factors
- Table 109. Market Risks
- Table 110. Industry Enters Major Barriers
- Table 111. Research Programs/Design for This Report
- Table 112. Key Data Information from Secondary Sources
- Table 113. Key Data Information from Primary Sources
- Table 114. Authors List of This Report
List of Figures
- Figure 1. Product Picture of FTIR Spectrometer
- Figure 2. Global FTIR Spectrometer Market Share by Type: 2024
- Figure 3. Desktop FTIR Spectrometer Product Picture
- Figure 4. Portable FTIR Spectrometer Product Picture
- Figure 5. Global FTIR Spectrometer Market Share by End Users: 2024
- Figure 6. Global FTIR Spectrometer Sales Value (US$ Million) & (2020-2031)
- Figure 7. Global FTIR Spectrometer Sales (Units) & (2020-2031)
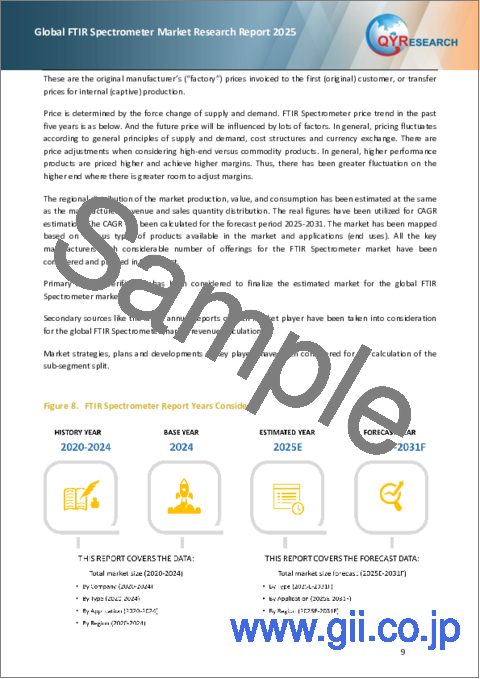
- Figure 8. FTIR Spectrometer Report Years Considered
- Figure 9. FTIR Spectrometer Sales Share by Manufacturers in 2024
- Figure 10. Global FTIR Spectrometer Sales Value Share by Manufacturers (2024)
- Figure 11. The Global 5 Largest Players: Market Share by FTIR Spectrometer Revenue in 2024
- Figure 12. Global FTIR Spectrometer Sales Market Share by Region: 2024
- Figure 13. North America FTIR Spectrometer Sales Value and Growth Rate (2020-2031) & (US$ Million)
- Figure 14. North America FTIR Spectrometer Sales Value Market Share by Country 2024
- Figure 15. U.S. FTIR Spectrometer Sales Value and Growth Rate (2020-2031) & (US$ Million)
- Figure 16. Canada FTIR Spectrometer Sales Value and Growth Rate (2020-2031) & (US$ Million)
- Figure 17. Mexico FTIR Spectrometer Sales Value and Growth Rate (2020-2031) & (US$ Million)
- Figure 18. Europe FTIR Spectrometer Sales Value and Growth Rate (2020-2031) & (US$ Million)
- Figure 19. Europe FTIR Spectrometer Sales Value Market Share by Country 2024
- Figure 20. Germany FTIR Spectrometer Sales Value and Growth Rate (2020-2031) & (US$ Million)
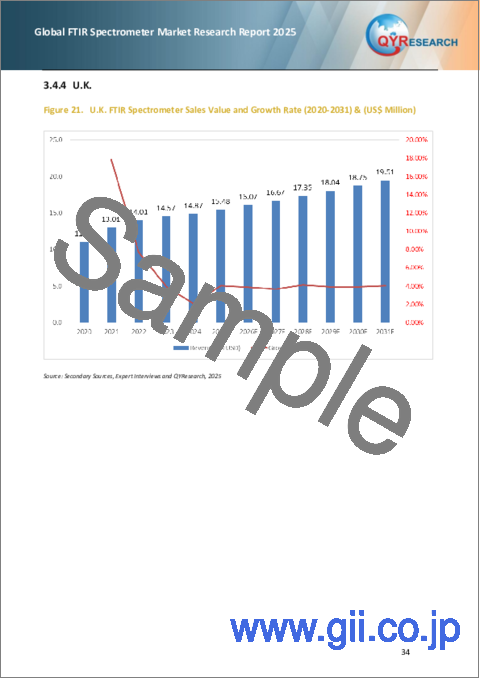
- Figure 21. U.K. FTIR Spectrometer Sales Value and Growth Rate (2020-2031) & (US$ Million)
- Figure 22. France FTIR Spectrometer Sales Value and Growth Rate (2020-2031) & (US$ Million)
- Figure 23. Italy FTIR Spectrometer Sales Value and Growth Rate (2020-2031) & (US$ Million)
- Figure 24. Russia FTIR Spectrometer Sales Value and Growth Rate (2020-2031) & (US$ Million)
- Figure 25. Asia Pacific FTIR Spectrometer Sales Value and Growth Rate (2020-2031) & (US$ Million)
- Figure 26. Asia Pacific FTIR Spectrometer Sales Value Market Share by Region 2024
- Figure 27. China FTIR Spectrometer Sales Value and Growth Rate (2020-2031) & (US$ Million)
- Figure 28. Japan FTIR Spectrometer Sales Value and Growth Rate (2020-2031) & (US$ Million)
- Figure 29. South Korea FTIR Spectrometer Sales Value and Growth Rate (2020-2031) & (US$ Million)
- Figure 30. India FTIR Spectrometer Sales Value and Growth Rate (2020-2031) & (US$ Million)
- Figure 31. Southeast Asia FTIR Spectrometer Sales Value and Growth Rate (2020-2031) & (US$ Million)
- Figure 32. South America FTIR Spectrometer Sales Value and Growth Rate (2020-2031) & (US$ Million)
- Figure 33. South America FTIR Spectrometer Sales Value Market Share by Country 2024
- Figure 34. Brazil FTIR Spectrometer Sales Value and Growth Rate (2020-2031) & (US$ Million)
- Figure 35. Argentina FTIR Spectrometer Sales Value and Growth Rate (2020-2031) & (US$ Million)
- Figure 36. Middle East & Africa FTIR Spectrometer Sales Value and Growth Rate (2020-2031) & (US$ Million)
- Figure 37. Middle East & Africa FTIR Spectrometer Sales Value Market Share by Country 2024
- Figure 38. Middle East FTIR Spectrometer Sales Value and Growth Rate (2020-2031) & (US$ Million)
- Figure 39. Africa FTIR Spectrometer Sales Value and Growth Rate (2020-2031) & (US$ Million)
- Figure 40. Global Sales Value Market Share of FTIR Spectrometer by Type 2024
- Figure 41. Global Sales Value Market Share of FTIR Spectrometer by End Users 2024
- Figure 42. Figure Manufacturing Cost Structure of FTIR Spectrometer
- Figure 43. Porter's Five Forces Analysis
- Figure 44. Bottom-up and Top-down Approaches for This Report
- Figure 45. Data Triangulation
The global FTIR Spectrometer market was valued at US$ 322.74 million in 2024 and is anticipated to reach US$ 430.20 million by 2031, witnessing a CAGR of 4.21% during the forecast period 2025-2031.
The major global manufacturers of FTIR Spectrometer include Thermo Fisher Scientific, PerkinElmer, Bruker, Agilent Technologies, Shimadzu, etc. in 2024, the world's top three vendors accounted for approximately 53% of the revenue.
This report aims to provide a comprehensive presentation of the global market for FTIR Spectrometer, with both quantitative and qualitative analysis, to help readers develop business/growth strategies, assess the market competitive situation, analyze their position in the current marketplace, and make informed business decisions regarding FTIR Spectrometer.
The FTIR Spectrometer market size, estimations, and forecasts are provided in terms of output/shipments (Units) and revenue ($ millions), considering 2024 as the base year, with history and forecast data for the period from 2020 to 2031. This report segments the global FTIR Spectrometer market comprehensively. Regional market sizes, concerning products by Type, by End Users, and by players, are also provided.
For a more in-depth understanding of the market, the report provides profiles of the competitive landscape, key competitors, and their respective market ranks. The report also discusses technological trends and new product developments.
The report will help the FTIR Spectrometer manufacturers, new entrants, and industry chain related companies in this market with information on the revenues, production, and average price for the overall market and the sub-segments across the different segments, by company, by Type, by End Users, and by regions.
Market Segmentation
By Company
- Thermo Fisher Scientific
- PerkinElmer
- Bruker
- Agilent Technologies
- Shimadzu
- ABB
- Jasco
- MKS
- Gangdong Technology
- Beifen-Ruili
- Skyray Instrument
Segment by Type
- Desktop FTIR Spectrometer
- Portable FTIR Spectrometer
Segment by End Users
- Chemical
- Pharmaceutical
- Food and Beverage
- Others
Consumption by Region
- North America
- U.S.
- Canada
- Mexico
- Asia-Pacific
- China
- Japan
- South Korea
- Southeast Asia
- India
- Europe
- Germany
- France
- U.K.
- Italy
- Russia
- Rest of Europe
- South America, Middle East & Africa
- Brazil
- Argentina
Chapter Outline
Chapter 1: Introduces the report scope of the report, executive summary of different market segments (by region, by Type, by End Users, etc), including the market size of each market segment, future development potential, and so on. It offers a high-level view of the current state of the market and its likely evolution in the short to mid-term, and long term.
Chapter 2: Detailed analysis of FTIR Spectrometer manufacturers competitive landscape, price, production and value market share, latest development plan, merger, and acquisition information, etc.
Chapter 3: Consumption of FTIR Spectrometer in regional level and country level. It provides a quantitative analysis of the market size and development potential of each region and its main countries and introduces the market development, future development prospects, market space, and production of each country in the world.
Chapter 4: Provides the analysis of various market segments by Type, covering the market size and development potential of each market segment, to help readers find the blue ocean market in different market segments.
Chapter 5: Provides the analysis of various market segments by End Users, covering the market size and development potential of each market segment, to help readers find the blue ocean market in different downstream markets.
Chapter 6: Provides profiles of key players, introducing the basic situation of the main companies in the market in detail, including product production/output, value, price, gross margin, product introduction, recent development, etc.
Chapter 7-9: Analysis of industrial chain, including the upstream and downstream of the industry. Introduces the market dynamics, latest developments of the market, the driving factors and restrictive factors of the market, the challenges and risks faced by manufacturers in the industry, and the analysis of relevant policies in the industry.
Chapter 10: The main points and conclusions of the report.
Table of Contents
1 FTIR Spectrometer Market Overview
- 1.1 Product Definition
- 1.2 FTIR Spectrometer by Type
- 1.2.1 Global FTIR Spectrometer Market Value Analysis by Type
- 1.2.2 Desktop FTIR Spectrometer
- 1.2.3 Portable FTIR Spectrometer
- 1.3 FTIR Spectrometer by End Users
- 1.3.1 Global FTIR Spectrometer Market Value Analysis by End Users
- 1.3.2 Chemical
- 1.3.3 Pharmaceutical
- 1.3.4 Food and Beverage
- 1.3.5 Others
- 1.4 Global Market Growth Prospects
- 1.4.1 Global FTIR Spectrometer Sales Value Estimates and Forecasts (2020-2031)
- 1.4.2 Global FTIR Spectrometer Sales Estimates and Forecasts (2020-2031)
- 1.5 Assumptions and Limitations
2 Market Competition by Manufacturers
- 2.1 Global FTIR Spectrometer Sales Market Share by Manufacturers (2022-2024)
- 2.2 Global FTIR Spectrometer Sales Value Market Share by Manufacturers (2022-2024)
- 2.3 Global FTIR Spectrometer Market Share by Company Type (Tier 1, Tier 2, and Tier 3)
- 2.4 Global FTIR Spectrometer Average Price by Manufacturers (2022-2024)
- 2.5 Global Key Manufacturers of FTIR Spectrometer, Established Time and Headquarters
- 2.6 FTIR Spectrometer Market Competitive Situation and Trends
- 2.6.1 FTIR Spectrometer Market Concentration Rate
- 2.6.2 Global 5 Largest FTIR Spectrometer Players Market Share by Revenue
- 2.7 Mergers & Acquisitions, Expansion
3 FTIR Spectrometer Sales by Region
- 3.1 Global FTIR Spectrometer Sales Estimates and Forecasts by Region
- 3.2 Global FTIR Spectrometer Sales and Sales Value by Region (2020-2031)
- 3.2.1 Global FTIR Spectrometer Sales Value by Region (2020-2025)
- 3.2.2 Global FTIR Spectrometer Forecasted Sales Value by Region (2026-2031)
- 3.2.3 Global FTIR Spectrometer Sales by Region (2020-2025)
- 3.2.4 Global FTIR Spectrometer Forecasted Sales by Region (2026-2031)
- 3.3 North America
- 3.3.1 North America FTIR Spectrometer Sales Value by Country (2020-2031)
- 3.3.2 North America FTIR Spectrometer Sales by Country (2020-2031)
- 3.3.3 U.S.
- 3.3.4 Canada
- 3.3.5 Mexico
- 3.4 Europe
- 3.4.1 Europe FTIR Spectrometer Sales Value by Country (2020-2031)
- 3.4.2 Europe FTIR Spectrometer Sales by Country (2020-2031)
- 3.4.3 Germany
- 3.4.4 U.K.
- 3.4.5 France
- 3.4.6 Italy
- 3.4.7 Russia
- 3.5 Asia Pacific
- 3.5.1 Asia Pacific FTIR Spectrometer Sales Value by Region (2020-2031)
- 3.5.2 Asia Pacific FTIR Spectrometer Sales by Region (2020-2031)
- 3.5.3 China
- 3.5.4 Japan
- 3.5.5 South Korea
- 3.5.6 India
- 3.5.7 Southeast Asia
- 3.6 South America
- 3.6.1 South America FTIR Spectrometer Sales Value by Country (2020-2031)
- 3.6.2 South America FTIR Spectrometer Sales by Country (2020-2031)
- 3.6.3 Brazil
- 3.6.4 Argentina
- 3.7 Middle East & Africa
- 3.7.1 Middle East & Africa FTIR Spectrometer Sales Value by Country (2020-2031)
- 3.7.2 Middle East & Africa FTIR Spectrometer Sales by Country (2020-2031)
- 3.7.3 Middle East
- 3.7.4 Africa
4 Segment by Type
- 4.1 Global FTIR Spectrometer Sales by Type (2020-2031)
- 4.1.1 Global FTIR Spectrometer Sales by Type (2020-2025)
- 4.1.2 Global FTIR Spectrometer Sales by Type (2026-2031)
- 4.1.3 Global FTIR Spectrometer Sales Market Share by Type (2020-2031)
- 4.2 Global FTIR Spectrometer Sales Value by Type (2020-2031)
- 4.2.1 Global FTIR Spectrometer Sales Value by Type (2020-2025)
- 4.2.2 Global FTIR Spectrometer Sales Value by Type (2026-2031)
- 4.2.3 Global FTIR Spectrometer Sales Value Market Share by Type (2020-2031)
- 4.3 Global FTIR Spectrometer Price by Type (2020-2031)
5 Segment by End Users
- 5.1 Global FTIR Spectrometer Sales by End Users (2020-2031)
- 5.1.1 Global FTIR Spectrometer Sales by End Users (2020-2025)
- 5.1.2 Global FTIR Spectrometer Sales by End Users (2026-2031)
- 5.1.3 Global FTIR Spectrometer Sales Market Share by End Users (2020-2031)
- 5.2 Global FTIR Spectrometer Sales Value by End Users (2020-2031)
- 5.2.1 Global FTIR Spectrometer Sales Value by End Users (2020-2025)
- 5.2.2 Global FTIR Spectrometer Sales Value by End Users (2026-2031)
- 5.2.3 Global FTIR Spectrometer Sales Value Market Share by End Users (2020-2031)
- 5.3 Global FTIR Spectrometer Price by End Users (2020-2031)
6 Key Players Profiles
- 6.1 Thermo Fisher Scientific
- 6.1.1 Thermo Fisher Scientific Company Details
- 6.1.2 Company and Business Overview
- 6.1.3 FTIR Spectrometer Introduction
- 6.1.4 Thermo Fisher Scientific Revenue, Sales, Price and Gross Margin in FTIR Spectrometer Business (2022-2024)
- 6.2 PerkinElmer
- 6.2.1 PerkinElmer Company Details
- 6.2.2 Company and Business Overview
- 6.2.3 FTIR Spectrometer Introduction
- 6.2.4 PerkinElmer Revenue, Sales, Price and Gross Margin in FTIR Spectrometer Business (2022-2024)
- 6.3 Bruker
- 6.3.1 Bruker Company Details
- 6.3.2 Company and Business Overview
- 6.3.3 FTIR Spectrometer Introduction
- 6.3.4 Bruker Revenue, Sales, Price and Gross Margin in FTIR Spectrometer Business (2022-2024)
- 6.4 Agilent Technologies
- 6.4.1 Agilent Technologies Company Details
- 6.4.2 Company and Business Overview
- 6.4.3 FTIR Spectrometer Introduction
- 6.4.4 Agilent Technologies Revenue, Sales, Price and Gross Margin in FTIR Spectrometer Business (2022-2024)
- 6.5 Shimadzu
- 6.5.1 Shimadzu Company Details
- 6.5.2 Company and Business Overview
- 6.5.3 FTIR Spectrometer Introduction
- 6.5.4 Shimadzu Revenue, Sales, Price and Gross Margin in FTIR Spectrometer Business (2022-2024)
- 6.6 ABB
- 6.6.1 ABB Company Details
- 6.6.2 Company and Business Overview
- 6.6.3 FTIR Spectrometer Introduction
- 6.6.4 ABB Revenue, Sales, Price and Gross Margin in FTIR Spectrometer Business (2022-2024)
- 6.7 Jasco
- 6.7.1 Jasco Company Details
- 6.7.2 Company and Business Overview
- 6.7.3 FTIR Spectrometer Introduction
- 6.7.4 Jasco Revenue, Sales, Price and Gross Margin in FTIR Spectrometer Business (2022-2024)
- 6.8 MKS
- 6.8.1 MKS Company Details
- 6.8.2 Company and Business Overview
- 6.8.3 FTIR Spectrometer Introduction
- 6.8.4 MKS Revenue, Sales, Price and Gross Margin in FTIR Spectrometer Business (2022-2024)
- 6.9 Tianjin Gangdong
- 6.9.1 Tianjin Gangdong Company Details
- 6.9.2 Company and Business Overview
- 6.9.3 FTIR Spectrometer Introduction
- 6.9.4 Tianjin Gangdong Revenue, Sales, Price and Gross Margin in FTIR Spectrometer Business (2022-2024)
- 6.10 Beifen-Ruili
- 6.10.1 Beifen-Ruili Company Details
- 6.10.2 Company and Business Overview
- 6.10.3 FTIR Spectrometer Introduction
- 6.10.4 Beifen-Ruili Revenue, Sales, Price and Gross Margin in FTIR Spectrometer Business (2022-2024)
- 6.11 Skyray Instrument
- 6.11.1 Skyray Instrument Company Details
- 6.11.2 Company and Business Overview
- 6.11.3 FTIR Spectrometer Introduction
- 6.11.4 Skyray Instrument Revenue, Sales, Price and Gross Margin in FTIR Spectrometer Business (2022-2024)
7 FTIR Spectrometer Manufacturing Cost Analysis
- 7.1 FTIR Spectrometer Key Raw Materials Analysis
- 7.1.1 Key Raw Materials
- 7.1.2 Key Raw Materials Price Trend
- 7.1.2.1 Key Raw Materials Steel SFE Price Trend (Yuan/MT)
- 7.1.2.2 Key Raw Materials Aluminum LME Price Trend (USD/Tonne)
- 7.1.2.3 Key Raw Materials Copper LME Price Trend (USD/LBs)
- 7.2 Proportion of Manufacturing Cost Structure
- 7.2.1 Raw Materials
- 7.2.2 Labor Cost
- 7.2.3 Manufacturing Expenses
- 7.3 Manufacturing Process Analysis of FTIR Spectrometer
8 Sales Channel, Distributors, Traders and Dealers
- 8.1 Sales Channel
- 8.2 Sales Channel: Direct Channel vs Indirect Channel
- 8.2.1 Direct Channel
- 8.2.2 Indirect Channel
- 8.3 Direct Channel Pros & Cons
- 8.4 Indirect Channel Pros & Cons
- 8.5 Market Positioning
- 8.5.1 Pricing Strategy
- 8.5.2 Brand Strategy
9 Market Dynamics
- 9.1 Market Trends
- 9.2 Challenges
- 9.3 Market Favorable Factors and Unfavorable Factors
- 9.4 Market Risks
- 9.5 Industry Enters Major Barriers
- 9.6 Porter's Five Forces Analysis
10 Research Findings and Conclusion
11 Methodology and Data Source
- 11.1 Methodology/Research Approach
- 11.1.1 Research Programs/Design
- 11.1.2 Market Size Estimation
- 11.1.3 Market Breakdown and Data Triangulation
- 11.2 Data Source
- 11.2.1 Secondary Sources
- 11.2.2 Primary Sources
- 11.3 Author List
- 11.4 Disclaimer 107
