|
|
市場調査レポート
商品コード
1702342
操船シミュレータの世界市場:実績と予測(2020年~2031年)Global Maritime Simulator Market Report, History and Forecast 2020-2031 |
||||||
|
|||||||
カスタマイズ可能
適宜更新あり
|
|||||||

| 操船シミュレータの世界市場:実績と予測(2020年~2031年) |
|
出版日: 2025年04月14日
発行: QYResearch
ページ情報: 英文 201 Pages
納期: 2~3営業日
|

全表示
- 概要
- 図表
- 目次
世界の操船シミュレータの市場規模は、2024年に2億5,659万米ドルとなりました。
同市場は、2025年から2031年の予測期間中に7.90%のCAGRで拡大し、2031年には4億3,930万米ドルに達すると予測されています。
北米の操船シミュレータの市場規模は、2024年に6,101万米ドルとなりました。同市場は、2024年から2031年の予測期間中に7.77%のCAGRで拡大し、2031年までに1億92万米ドルに達すると予測されています。
アジア太平洋の操船シミュレータの市場規模は、2024年に8,054万米ドルとなりました。同市場は、2024年から2031年の予測期間中に8.96%のCAGRで拡大し、2031年までに1億4,995万米ドルに達すると予測されています。
欧州の船シミュレータの市場規模は、2024年に9,074万米ドルとなりました。同市場は、2024年から2031年の予測期間中に7.03%のCAGRで拡大し、2031年には1億4,906万米ドルに達すると予測されています。
当レポートは、世界の操船シミュレータ市場を定量的・定性的分析の両面から包括的に紹介し、読者がビジネス/成長戦略を策定し、市場競争状況を評価し、現在の市場における自社のポジションを分析し、操船シミュレータに関する十分な情報に基づいたビジネス上の意思決定を行えるようにすることを目的としています。
操船シミュレータの市場規模・推計・予測は、2024年を基準年とし、2020年から2031年までの過去データと予測データを売上数量と収益で提供します。当レポートでは、世界の市場セグメンテーション市場を包括的に区分しています。製品タイプ別、用途別、プレイヤー別の地域別市場規模も掲載しています。
市場をより深く理解するために、競合情勢や主要競合企業のプロファイル、それぞれの市場ランクを掲載しています。また、技術動向や新製品開発についても論じています。
当レポートは、読者が業界内の競合を理解し、潜在的な利益を高めるための競合環境に対する戦略を理解するのに役立ちます。また、世界の操船シミュレータ市場の競合情勢に焦点を当て、主要企業の市場シェア、業界ランキング、競合エコシステム、市場実績、新製品開発、経営状況、事業拡大、買収などを詳細に紹介しており、読者が主要な競合企業を特定し、市場の競争パターンを深く理解するのに役立ちます。
当レポートでは、操船シミュレータをメーカー別、タイプ別、用途別、地域別、国別に分類し、2024年を基準年とした過去と予測期間(2020年~2024年、2025年~2031年)の市場規模(金額、数量、平均価格)とCAGRを掲載しています。また、さまざまなセグメントにおける潜在的な収益機会を明らかにし、この市場の魅力的な投資提案マトリクスについて解説しています。
目次
第1章 操船シミュレータ市場概要
- 操船シミュレータ製品概要
- 操船シミュレータ市場、タイプ別
- 船舶操縦シミュレーター
- レーダーシミュレーター
- ECDISシミュレータ
- GMDSSシミュレータ
- その他
- 世界の操船シミュレータ市場規模、用途別
- 主要地域別市場規模
第2章 操船シミュレータ市場における競争
第3章 操船シミュレータの現状と見通し、地域別
- 世界の操船シミュレータ市場規模とCAGR:2020年対2024年対2031年、地域別
- 世界の操船シミュレータ市場規模実績、地域別
- 世界の操船シミュレータ市場規模予測、地域別
第4章 操船シミュレータ、用途別
- 用途別操船シミュレータ市場
- 海事大学・学校
- 防衛・軍事
- 港・海運
- 石油・ガス
- その他
- 世界の操船シミュレータ市場規模、用途別
- 主要地域別市場規模、用途別
第5章 北米の操船シミュレータ、国別
第6章 欧州の操船シミュレータ、国別
第7章 アジア太平洋の操船シミュレータ、地域別
第8章 ラテンアメリカの操船シミュレータ、国別
第9章 中東・アフリカの操船シミュレータ、国別
第10章 企業プロファイル
- Wartsila
- Furuno
- Kongsberg Digital
- Rheinmetall
- VSTEP Simulation
- Japan Marine Science Inc.
- Poseidon Simulation
- PC Maritime
- ARI Simulation
- Virtual Marine Technology
- FORCE Technology
- Image Soft
- Dalian Haida Zhilong Technology
- Shanghai Haiyang Weather Airmanship
- Xiamen Honggeng Marine Technology
- Morild Interaktiv
第11章 上流、機会、課題、リスク、影響要因の分析
- 操船シミュレータの主要原材料
- 製造コスト構造
- 操船シミュレータ産業チェーン分析
- 操船シミュレータ市場力学
第12章 マーケティング戦略分析、販売代理店
第13章 調査結果と結論
第14章 付録
List of Tables
- Table 1. Major Company of Ship Handling Simulator
- Table 2. Major Company of Radar Simulator
- Table 3. Major Company of ECDIS Simulator
- Table 4. Major Company of GMDSS Simulator
- Table 5. Major Company of Other Simulators
- Table 6. Global Maritime Simulator Sales by Type: 2020 VS 2024 VS 2031 (US$ Million)
- Table 7. Global Maritime Simulator Sales by Type (2020-2025) & (Units)
- Table 8. Global Maritime Simulator Sales Market Share in Volume by Type (2020-2025)
- Table 9. Global Maritime Simulator Sales by Type (2020-2025) & (US$ Million)
- Table 10. Global Maritime Simulator Sales Market Share in Value by Type (2020-2025)
- Table 11. Global Maritime Simulator Price by Type (2020-2025) & (k USD/Unit)
- Table 12. Global Maritime Simulator Sales by Type (2026-2031) & (Units)
- Table 13. Global Maritime Simulator Sales Market Share in Volume by Type (2026-2031)
- Table 14. Global Maritime Simulator Sales by Type (2026-2031) & (US$ Million)
- Table 15. Global Maritime Simulator Sales Market Share in Value by Type (2026-2031)
- Table 16. Global Maritime Simulator Price by Type (2026-2031) & (k USD/Unit)
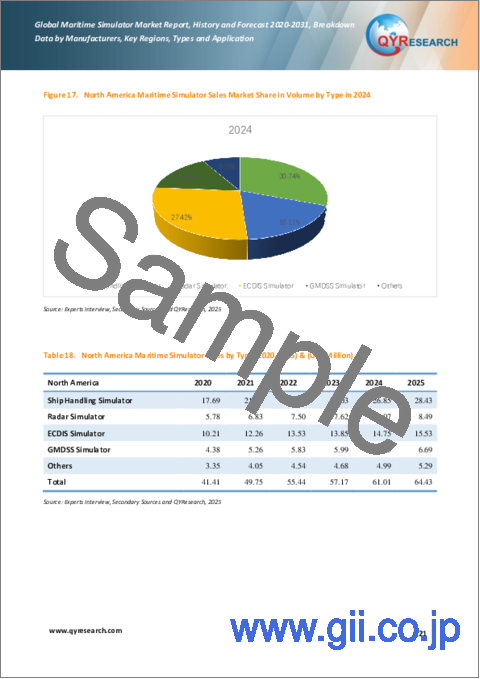
- Table 17. North America Maritime Simulator Sales by Type (2020-2025) & (Units)
- Table 18. North America Maritime Simulator Sales by Type (2020-2025) & (US$ Million)
- Table 19. Europe Maritime Simulator Sales (Units) by Type (2020-2025)
- Table 20. Europe Maritime Simulator Sales by Type (2020-2025) & (US$ Million)
- Table 21. Asia-Pacific Maritime Simulator Sales (Units) by Type (2020-2025)
- Table 22. Asia-Pacific Maritime Simulator Sales by Type (2020-2025) & (US$ Million)
- Table 23. Latin America Maritime Simulator Sales (Units) by Type (2020-2025)
- Table 24. Latin America Maritime Simulator Sales by Type (2020-2025) & (US$ Million)
- Table 25. Middle East and Africa Maritime Simulator Sales (Units) by Type (2020-2025)
- Table 26. Middle East and Africa Maritime Simulator Sales by Type (2020-2025) & (US$ Million)
- Table 27. Global Maritime Simulator Sales by Company (2020-2025) & (Units)
- Table 28. Global Maritime Simulator Sales Share by Company (2020-2025)
- Table 29. Global Maritime Simulator Revenue by Company (2020-2025) & (US$ Million)
- Table 30. Global Maritime Simulator Revenue Share by Company (2020-2025)
- Table 31. Global Market Maritime Simulator Price by Company (2020-2025) & (k USD/Unit)
- Table 32. Global Maritime Simulator Top Manufacturers Manufacturing Base Distribution and Headquarters
- Table 33. Global Maritime Simulator Manufacturers Market Concentration Ratio (CR5 and HHI)
- Table 34. Global Top Manufacturers Market Share by Company Type (Tier 1, Tier 2, and Tier 3) & (based on the Revenue in Maritime Simulator as of 2024)
- Table 35. Key Manufacturers Maritime Simulator Product Type
- Table 36. Global Maritime Simulator Market Size Comparison by Region (US$ Million): 2020 VS 2024 VS 2031
- Table 37. Global Maritime Simulator Sales by Region (2020-2025) & (Units)
- Table 38. Global Maritime Simulator Sales Market Share in Volume by Region (2020-2025)
- Table 39. Global Maritime Simulator Sales by Region (2020-2025) & (US$ Million)
- Table 40. Global Maritime Simulator Sales Market Share in Value by Region (2020-2025)
- Table 41. Global Maritime Simulator Sales (Units), Value (US$ Million), Price (k USD/Unit) and Gross Margin (2020-2025)
- Table 42. Global Maritime Simulator Sales by Region (2026-2031) & (Units)
- Table 43. Global Maritime Simulator Sales Market Share in Volume by Region (2026-2031)
- Table 44. Global Maritime Simulator Sales by Region (2026-2031) & (US$ Million)
- Table 45. Global Maritime Simulator Sales Market Share in Value by Region (2026-2031)
- Table 46. Global Maritime Simulator Sales (Units), Value (US$ Million), Price (k USD/Unit) and Gross Margin (2026-2031)
- Table 47. Global Maritime Simulator Sales by Application: 2020 VS 2024 VS 2031 (US$ Million)
- Table 48. Global Maritime Simulator Sales by Application (2020-2025) & (Units)
- Table 49. Global Maritime Simulator Sales Market Share in Volume by Application (2020-2025)
- Table 50. Global Maritime Simulator Sales by Application (2020-2025) & (US$ Million)
- Table 51. Global Maritime Simulator Sales Market Share in Value by Application (2020-2025)
- Table 52. Global Maritime Simulator Price by Application (2020-2025) & (k USD/Unit)
- Table 53. Global Maritime Simulator Sales by Application (2026-2031) & (Units)
- Table 54. Global Maritime Simulator Sales Market Share in Volume by Application (2026-2031)
- Table 55. Global Maritime Simulator Sales by Application (2026-2031) & (US$ Million)
- Table 56. Global Maritime Simulator Sales Market Share in Value by Application (2026-2031)
- Table 57. Global Maritime Simulator Price by Application (2026-2031) & (k USD/Unit)
- Table 58. North America Maritime Simulator Sales by Application (2020-2025) & (Units)
- Table 59. North America Maritime Simulator Sales by Application (2020-2025) & (US$ Million)
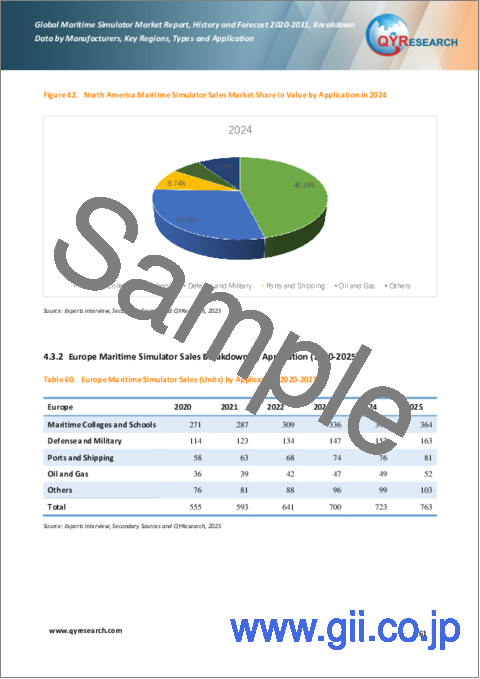
- Table 60. Europe Maritime Simulator Sales (Units) by Application (2020-2025)
- Table 61. Europe Maritime Simulator Sales by Application (2020-2025) & (US$ Million)
- Table 62. Asia-Pacific Maritime Simulator Sales (Units) by Application (2020-2025)
- Table 63. Asia-Pacific Maritime Simulator Sales by Application (2020-2025) & (US$ Million)
- Table 64. Latin America Maritime Simulator Sales (Units) by Application (2020-2025)
- Table 65. Latin America Maritime Simulator Sales by Application (2020-2025) & (US$ Million)
- Table 66. Middle East and Africa Maritime Simulator Sales (Units) by Application (2020-2025)
- Table 67. Middle East and Africa Maritime Simulator Sales by Application (2020-2025) & (US$ Million)
- Table 68. North America Maritime Simulator Market Size Growth Rate (CAGR) by Country (US$ Million): 2020 VS 2024 VS 2031
- Table 69. North America Maritime Simulator Sales by Country (2020-2025) & (Units)
- Table 70. North America Maritime Simulator Sales Market Share in Volume by Country (2020-2025)
- Table 71. North America Maritime Simulator Sales by Country (2020-2025) & (US$ Million)
- Table 72. North America Maritime Simulator Sales Market Share in Value by Country (2020-2025)
- Table 73. North America Maritime Simulator Sales by Country (2026-2031) & (Units)
- Table 74. North America Maritime Simulator Sales Market Share in Volume by Country (2026-2031)
- Table 75. North America Maritime Simulator Sales by Country (2026-2031) & (US$ Million)
- Table 76. North America Maritime Simulator Sales Market Share in Value by Country (2026-2031)
- Table 77. Europe Maritime Simulator Market Size Growth Rate (CAGR) by Country (US$ Million): 2020 VS 2024 VS 2031
- Table 78. Europe Maritime Simulator Sales by Country (2020-2025) & (Units)
- Table 79. Europe Maritime Simulator Sales Market Share in Volume by Country (2020-2025)
- Table 80. Europe Maritime Simulator Sales by Country (2020-2025) & (US$ Million)
- Table 81. Europe Maritime Simulator Sales Market Share in Value by Country (2020-2025)
- Table 82. Europe Maritime Simulator Sales by Country (2026-2031) & (Units)
- Table 83. Europe Maritime Simulator Sales Market Share in Volume by Country (2026-2031)
- Table 84. Europe Maritime Simulator Sales by Country (2026-2031) & (US$ Million)
- Table 85. Europe Maritime Simulator Sales Market Share in Value by Country (2026-2031)
- Table 86. Asia-Pacific Maritime Simulator Market Size Growth Rate (CAGR) by Region (US$ Million): 2020 VS 2024 VS 2031
- Table 87. Asia-Pacific Maritime Simulator Sales by Region (2020-2025) & (Units)
- Table 88. Asia-Pacific Maritime Simulator Sales Market Share in Volume by Region (2020-2025)
- Table 89. Asia-Pacific Maritime Simulator Sales by Region (2020-2025) & (US$ Million)
- Table 90. Asia-Pacific Maritime Simulator Sales Market Share in Value by Region (2020-2025)
- Table 91. Asia-Pacific Maritime Simulator Sales by Region (2026-2031) & (Units)
- Table 92. Asia-Pacific Maritime Simulator Sales Market Share in Volume by Region (2026-2031)
- Table 93. Asia-Pacific Maritime Simulator Sales by Region (2026-2031) & (US$ Million)
- Table 94. Asia-Pacific Maritime Simulator Sales Market Share in Value by Region (2026-2031)
- Table 95. Latin America Maritime Simulator Market Size Growth Rate (CAGR) by Country (US$ Million): 2020 VS 2024 VS 2031
- Table 96. Latin America Maritime Simulator Sales by Country (2020-2025) & (Units)
- Table 97. Latin America Maritime Simulator Sales Market Share in Volume by Country (2020-2025)
- Table 98. Latin America Maritime Simulator Sales by Country (2020-2025) & (US$ Million)
- Table 99. Latin America Maritime Simulator Sales Market Share in Value by Country (2020-2025)
- Table 100. Latin America Maritime Simulator Sales by Country (2026-2031) & (Units)
- Table 101. Latin America Maritime Simulator Sales Market Share in Volume by Country (2026-2031)
- Table 102. Latin America Maritime Simulator Sales by Country (2026-2031) & (US$ Million)
- Table 103. Latin America Maritime Simulator Sales Market Share in Value by Country (2026-2031)
- Table 104. Middle East and Africa Maritime Simulator Market Size Growth Rate (CAGR) by Country (US$ Million): 2020 VS 2024 VS 2031
- Table 105. Middle East and Africa Maritime Simulator Sales by Country (2020-2025) & (Units)
- Table 106. Middle East and Africa Maritime Simulator Sales Market Share in Volume by Country (2020-2025)
- Table 107. Middle East and Africa Maritime Simulator Sales by Country (2020-2025) & (US$ Million)
- Table 108. Middle East and Africa Maritime Simulator Sales Market Share in Value by Country (2020-2025)
- Table 109. Middle East and Africa Maritime Simulator Sales by Country (2026-2031) & (Units)
- Table 110. Middle East and Africa Maritime Simulator Sales Market Share by Country (2026-2031)
- Table 111. Middle East and Africa Maritime Simulator Sales by Country (2026-2031) & (US$ Million)
- Table 112. Middle East and Africa Maritime Simulator Sales Market Share in Value by Country (2026-2031)
- Table 113. Wartsila Company Information
- Table 114. Wartsila Introduction and Business Overview
- Table 115. Wartsila Maritime Simulator Sales (Units), Revenue (US$ Million), Price (k k USD/Unit) and Gross Margin (2020-2025)
- Table 116. Wartsila Maritime Simulator Product
- Table 117. Wartsila Recent Development
- Table 118. Furuno Company Information
- Table 119. Furuno Introduction and Business Overview
- Table 120. Furuno Maritime Simulator Sales (Units), Revenue (US$ Million), Price (k k USD/Unit) and Gross Margin (2020-2025)
- Table 121. Furuno Maritime Simulator Product
- Table 122. Kongsberg Digital Company Information
- Table 123. Kongsberg Digital Introduction and Business Overview
- Table 124. Kongsberg Digital Maritime Simulator Sales (Units), Revenue (US$ Million), Price (k k USD/Unit) and Gross Margin (2020-2025)
- Table 125. Kongsberg Digital Maritime Simulator Product
- Table 126. Kongsberg Digital Recent Development
- Table 127. Rheinmetall Company Information
- Table 128. Rheinmetall Introduction and Business Overview
- Table 129. Rheinmetall Maritime Simulator Sales (Units), Revenue (US$ Million), Price (k k USD/Unit) and Gross Margin (2020-2025)
- Table 130. Rheinmetall Maritime Simulator Product
- Table 131. Rheinmetall Recent Development
- Table 132. VSTEP Simulation Company Information
- Table 133. VSTEP Simulation Introduction and Business Overview
- Table 134. VSTEP Simulation Maritime Simulator Sales (Units), Revenue (US$ Million), Price (k k USD/Unit) and Gross Margin (2020-2025)
- Table 135. VSTEP Simulation Maritime Simulator Product
- Table 136. VSTEP Simulation Recent Development
- Table 137. Japan Marine Science Inc. Company Information
- Table 138. Japan Marine Science Inc. Introduction and Business Overview
- Table 139. Japan Marine Science Inc. Maritime Simulator Sales (Units), Revenue (US$ Million), Price (k k USD/Unit) and Gross Margin (2020-2025)
- Table 140. Japan Marine Science Inc. Maritime Simulator Product
- Table 141. Poseidon Simulation Company Information
- Table 142. Poseidon Simulation Introduction and Business Overview
- Table 143. Poseidon Simulation Maritime Simulator Sales (Units), Revenue (US$ Million), Price (k k USD/Unit) and Gross Margin (2020-2025)
- Table 144. Poseidon Simulation Maritime Simulator Product
- Table 145. PC Maritime Company Information
- Table 146. PC Maritime Introduction and Business Overview
- Table 147. PC Maritime Maritime Simulator Sales (Units), Revenue (US$ Million), Price (k k USD/Unit) and Gross Margin (2020-2025)
- Table 148. PC Maritime Maritime Simulator Product
- Table 149. ARI Simulation Company Information
- Table 150. ARI Simulation Introduction and Business Overview
- Table 151. ARI Simulation Maritime Simulator Sales (Units), Revenue (US$ Million), Price (k k USD/Unit) and Gross Margin (2020-2025)
- Table 152. ARI Simulation Maritime Simulator Product
- Table 153. Virtual Marine Technology Company Information
- Table 154. Virtual Marine Technology Introduction and Business Overview
- Table 155. Virtual Marine Technology Maritime Simulator Sales (Units), Revenue (US$ Million), Price (k k USD/Unit) and Gross Margin (2020-2025)
- Table 156. Virtual Marine Technology Maritime Simulator Product
- Table 157. Virtual Marine Technology Recent Development
- Table 158. FORCE Technology Company Information
- Table 159. FORCE Technology Introduction and Business Overview
- Table 160. FORCE Technology Maritime Simulator Sales (Units), Revenue (US$ Million), Price (k k USD/Unit) and Gross Margin (2020-2025)
- Table 161. FORCE Technology Maritime Simulator Product
- Table 162. FORCE Technology Recent Development
- Table 163. Image Soft Company Information
- Table 164. Image Soft Introduction and Business Overview
- Table 165. Image Soft Maritime Simulator Sales (Units), Revenue (US$ Million), Price (k k USD/Unit) and Gross Margin (2020-2025)
- Table 166. Image Soft Maritime Simulator Product
- Table 167. Dalian Haida Zhilong Technology Company Information
- Table 168. Dalian Haida Zhilong Technology Introduction and Business Overview
- Table 169. Dalian Haida Zhilong Technology Maritime Simulator Sales (Units), Revenue (US$ Million), Price (k k USD/Unit) and Gross Margin (2020-2025)
- Table 170. Dalian Haida Zhilong Technology Maritime Simulator Product
- Table 171. Shanghai Haiyang Weather Airmanship Company Information
- Table 172. Shanghai Haiyang Weather Airmanship Introduction and Business Overview
- Table 173. Shanghai Haiyang Weather Airmanship Maritime Simulator Sales (Units), Revenue (US$ Million), Price (k k USD/Unit) and Gross Margin (2020-2025)
- Table 174. Shanghai Haiyang Weather Airmanship Maritime Simulator Product
- Table 175. Xiamen Honggeng Marine Technology Company Information
- Table 176. Xiamen Honggeng Marine Technology Introduction and Business Overview
- Table 177. Xiamen Honggeng Marine Technology Maritime Simulator Sales (Units), Revenue (US$ Million), Price (k k USD/Unit) and Gross Margin (2020-2025)
- Table 178. Xiamen Honggeng Marine Technology Maritime Simulator Product
- Table 179. Morild Interaktiv Company Information
- Table 180. Morild Interaktiv Introduction and Business Overview
- Table 181. Morild Interaktiv Maritime Simulator Sales (Units), Revenue (US$ Million), Price (k k USD/Unit) and Gross Margin (2020-2025)
- Table 182. Morild Interaktiv Maritime Simulator Product
- Table 183. Key Raw Materials Lists
- Table 184. Raw Materials Key Suppliers Lists
- Table 185. Maritime Simulator Market Trends
- Table 186. Maritime Simulator Market Drivers
- Table 187. Maritime Simulator Market Challenges
- Table 188. Maritime Simulator Market Restraints
- Table 189. Maritime Simulator Distributors List
- Table 190. Maritime Simulator Downstream Customers
- Table 191. Research Programs/Design for This Report
- Table 192. Key Data Information from Secondary Sources
- Table 193. Key Data Information from Primary Sources
List of Figures
- Figure 1. Maritime Simulator Product Picture
- Figure 2. Global Maritime Simulator Market Size, 2020 VS 2024 VS 2031 (US$ Million)
- Figure 3. Global Maritime Simulator Market Size Status and Outlook (2020-2031) & (US$ Million)
- Figure 4. Global Maritime Simulator Sales Status and Outlook (2020-2031) & (Units)
- Figure 5. Product Picture of Ship Handling Simulator
- Figure 6. Global Ship Handling Simulator Sales YoY Growth (2020-2031) & (Units)
- Figure 7. Product Picture of Radar Simulator
- Figure 8. Global Radar Simulator Sales YoY Growth (2020-2031) & (Units)
- Figure 9. Product Picture of ECDIS Simulator
- Figure 10. Global ECDIS Simulator Sales YoY Growth (2020-2031) & (Units)
- Figure 11. Product Picture of GMDSS Simulator
- Figure 12. Global GMDSS Simulators Sales YoY Growth (2020-2031) & (Units)
- Figure 13. Product Picture of Other Simulators
- Figure 14. Global ROV Simulators Sales YoY Growth (2020-2031) & (Units)
- Figure 15. Global Maritime Simulator Sales by Type (2020-2031) & (US$ Million)
- Figure 16. Global Maritime Simulator Market Share by Type in 2024 & 2031
- Figure 17. North America Maritime Simulator Sales Market Share in Volume by Type in 2024
- Figure 18. North America Maritime Simulator Sales Market Share in Value by Type in 2024
- Figure 19. Europe Maritime Simulator Sales Market Share in Volume by Type in 2024
- Figure 20. Europe Maritime Simulator Sales Market Share in Value by Type in 2024
- Figure 21. Asia-Pacific Maritime Simulator Sales Market Share in Volume by Type in 2024
- Figure 22. Asia-Pacific Maritime Simulator Sales Market Share in Value by Type in 2024
- Figure 23. Latin America Maritime Simulator Sales Market Share in Volume by Type in 2024
- Figure 24. Latin America Maritime Simulator Sales Market Share in Value by Type in 2024
- Figure 25. Middle East and Africa Maritime Simulator Sales Market Share in Volume by Type in 2024
- Figure 26. Middle East and Africa Maritime Simulator Sales Market Share in Value by Type in 2024
- Figure 27. The 5 and 10 Largest Manufacturers in the World: Market Share by Maritime Simulator Revenue in 2024
- Figure 28. Maritime Simulator Market Share by Company Type (Tier 1, Tier 2, and Tier 3): 2020 VS 2024
- Figure 29. Product Picture of Maritime Colleges and Schools
- Figure 30. Global Maritime Colleges and Schools Sales YoY Growth (2020-2031) & (Units)
- Figure 31. Product Picture of Defense and Military
- Figure 32. Global Defense and Military Sales YoY Growth (2020-2031) & (Units)
- Figure 33. Product Picture of Ports and Shipping
- Figure 34. Global Ports and Shipping Sales YoY Growth (2020-2031) & (Units)
- Figure 35. Product Picture of Oil and Gas
- Figure 36. Global Oil and Gas Sales YoY Growth (2020-2031) & (Units)
- Figure 37. Product Picture of Search and Rescue Operations
- Figure 38. Global Others Sales YoY Growth (2020-2031) & (Units)
- Figure 39. Global Maritime Simulator Sales by Application (2020-2031) & (US$ Million)
- Figure 40. Global Maritime Simulator Market Share by Application in 2024 & 2031
- Figure 41. North America Maritime Simulator Sales Market Share in Volume by Application in 2024
- Figure 42. North America Maritime Simulator Sales Market Share in Value by Application in 2024
- Figure 43. Europe Maritime Simulator Sales Market Share in Volume by Application in 2024
- Figure 44. Europe Maritime Simulator Sales Market Share in Value by Application in 2024
- Figure 45. Asia-Pacific Maritime Simulator Sales Market Share in Volume by Application in 2024
- Figure 46. Asia-Pacific Maritime Simulator Sales Market Share in Value by Application in 2024
- Figure 47. Latin America Maritime Simulator Sales Market Share in Volume by Application in 2024
- Figure 48. Latin America Maritime Simulator Sales Market Share in Value by Application in 2024
- Figure 49. Middle East and Africa Maritime Simulator Sales Market Share in Volume by Application in 2024
- Figure 50. Middle East and Africa Maritime Simulator Sales Market Share in Value by Application in 2024
- Figure 51. Maritime Simulator Manufacturing Cost Structure
- Figure 52. Maritime Simulator Industrial Chain Analysis
- Figure 53. Bottom-up and Top-down Approaches for This Report
- Figure 54. Data Triangulation
- Figure 55. Key Executives Interviewed
The global market for Maritime Simulator was valued at US$ 256.59 million in the year 2024 and is projected to reach a revised size of US$ 439.30 million by 2031, growing at a CAGR of 7.90% during the forecast period 2025-2031.
North American market for Maritime Simulator was valued at $ 61.01 million in 2024 and will reach $ 100.92 million by 2031, at a CAGR of 7.77% during the forecast period of 2024 through 2031.
Asia-Pacific market for Maritime Simulator was valued at $ 80.54 million in 2024 and will reach $ 149.95 million by 2031, at a CAGR of 8.96% during the forecast period of 2024 through 2031.
Europe market for Maritime Simulator was valued at $ 90.74 million in 2024 and will reach $ 149.06 million by 2031, at a CAGR of 7.03% during the forecast period of 2024 through 2031.
Report Scope
This report aims to provide a comprehensive presentation of the global market for Maritime Simulator, with both quantitative and qualitative analysis, to help readers develop business/growth strategies, assess the market competitive situation, analyze their position in the current marketplace, and make informed business decisions regarding Maritime Simulator.
The Maritime Simulator market size, estimations, and forecasts are provided in terms of sales volume (Units) and revenue ($ millions), considering 2024 as the base year, with history and forecast data for the period from 2020 to 2031. This report segments the global Maritime Simulator market comprehensively. Regional market sizes, concerning products by Type, by Application, and by players, are also provided.
For a more in-depth understanding of the market, the report provides profiles of the competitive landscape, key competitors, and their respective market ranks. The report also discusses technological trends and new product developments.
This report will help the readers to understand the competition within the industries and strategies for the competitive environment to enhance the potential profit. The report also focuses on the competitive landscape of the global Maritime Simulator market, and introduces in detail the market share, industry ranking, competitor ecosystem, market performance, new product development, operation situation, expansion, and acquisition. etc. of the main players, which helps the readers to identify the main competitors and deeply understand the competition pattern of the market.
Market Segmentation
This report covers the Maritime Simulator segments by manufacturers, by Type, by Application, by region and country, and provides market size (value, volume and average price) and CAGR for the history and forecast period (2020-2024, 2025-2031), considering 2024 as the base year. It elucidates potential revenue opportunities across different segments and explains attractive investment proposition matrices for this market.
By Company
- Wartsila
- Furuno
- Kongsberg Digital
- Rheinmetall
- VSTEP B.V.
- Japan Marine Science
- Poseidon Simulation
- PC Maritime
- ARI Simulation
- Virtual Marine Technology
- FORCE Technology
- Image Soft
- Dalian Haida Zhilong Technology
- Shanghai Haiyang Weather Routing Technology
- Xiamen Honggeng Marine Technology
- Morild Interaktiv
Segment by Type
- Ship Handling Simulator
- Radar Simulator
- ECDIS Simulator
- GMDSS Simulator
- Others
Segment by Application
- Maritime Colleges and Schools
- Defense and Military
- Ports and Shipping
- Oil and Gas
- Others
By Region
- North America
- United States
- Canada
- Asia-Pacific
- China
- Japan
- South Korea
- Southeast Asia
- India
- Europe
- Germany
- Norway
- UK
- Netherlands
- Denmark
- Latin America
- Mexico
- Brazil
- Middle East & Africa
- Saudi Arabia
- UAE
- Oman
- South Africa
Chapter Outline
Chapter One: Introduces the study scope of this report, executive summary of market segments by Type, market size segments for North America, Europe, Asia Pacific, Latin America, Middle East & Africa.
Chapter Two: Detailed analysis of Maritime Simulator manufacturers competitive landscape, price, sales, revenue, market share and ranking, latest development plan, merger, and acquisition information, etc.
Chapter Three: Sales, revenue of Maritime Simulator in regional level. It provides a quantitative analysis of the market size and development potential of each region and introduces the future development prospects, and market space in the world.
Chapter Four: Introduces market segments by Application, market size segment for North America, Europe, Asia Pacific, Latin America, Middle East & Africa.
Chapter Five, Six, Seven, Eight and Nine: North America, Europe, Asia Pacific, Latin America, Middle East & Africa, sales and revenue by country.
Chapter Ten: Provides profiles of key players, introducing the basic situation of the main companies in the market in detail, including product sales, revenue, price, gross margin, product introduction, recent development, etc.
Chapter Eleven: Analysis of industrial chain, key raw materials, manufacturing cost, and market dynamics. Introduces the market dynamics, latest developments of the market, the driving factors and restrictive factors of the market, the challenges and risks faced by manufacturers in the industry, and the analysis of relevant policies in the industry.
Chapter Twelve: Analysis of sales channel, distributors and customers.
Chapter Thirteen: Research Findings and Conclusion.
Table of Contents
1 Maritime Simulator Market Overview
- 1.1 Maritime Simulator Product Overview
- 1.2 Maritime Simulator Market by Type
- 1.2.1 Ship Handling Simulator
- 1.2.2 Radar Simulator
- 1.2.3 ECDIS Simulator
- 1.2.4 GMDSS Simulator
- 1.2.5 Others
- 1.3 Global Maritime Simulator Market Size by Type
- 1.3.1 Global Maritime Simulator Market Size Overview by Type (2020-2031)
- 1.3.2 Global Maritime Simulator Historic Market Size Review by Type (2020-2025)
- 1.3.3 Global Maritime Simulator Forecasted Market Size by Type (2026-2031)
- 1.4 Key Regions Market Size by Type
- 1.4.1 North America Maritime Simulator Sales Breakdown by Type (2020-2025)
- 1.4.2 Europe Maritime Simulator Sales Breakdown by Type (2020-2025)
- 1.4.3 Asia-Pacific Maritime Simulator Sales Breakdown by Type (2020-2025)
- 1.4.4 Latin America Maritime Simulator Sales Breakdown by Type (2020-2025)
- 1.4.5 Middle East and Africa Maritime Simulator Sales Breakdown by Type (2020-2025)
2 Maritime Simulator Market Competition by Company
- 2.1 Global Top Players by Maritime Simulator Sales (2020-2025)
- 2.2 Global Top Players by Maritime Simulator Revenue (2020-2025)
- 2.3 Global Top Players by Maritime Simulator Price (2020-2025)
- 2.4 Global Top Manufacturers Maritime Simulator Manufacturing Base Distribution and Headquarters
- 2.5 Maritime Simulator Market Competitive Situation and Trends
- 2.5.1 Maritime Simulator Market Concentration Rate (2020-2025)
- 2.5.2 Global 5 and 10 Largest Manufacturers by Maritime Simulator Sales and Revenue in 2024
- 2.6 Global Top Manufacturers by Company Type (Tier 1, Tier 2, and Tier 3) & (based on the Revenue in Maritime Simulator as of 2024)
- 2.7 Key Manufacturers Maritime Simulator Product Offered
3 Maritime Simulator Status and Outlook by Region
- 3.1 Global Maritime Simulator Market Size and CAGR by Region: 2020 VS 2024 VS 2031
- 3.2 Global Maritime Simulator Historic Market Size by Region
- 3.2.1 Global Maritime Simulator Sales in Volume by Region (2020-2025)
- 3.2.2 Global Maritime Simulator Sales in Value by Region (2020-2025)
- 3.2.3 Global Maritime Simulator Sales (Volume & Value), Price and Gross Margin (2020-2025)
- 3.3 Global Maritime Simulator Forecasted Market Size by Region
- 3.3.1 Global Maritime Simulator Sales in Volume by Region (2026-2031)
- 3.3.2 Global Maritime Simulator Sales in Value by Region (2026-2031)
- 3.3.3 Global Maritime Simulator Sales (Volume & Value), Price and Gross Margin (2026-2031)
4 Maritime Simulator by Application
- 4.1 Maritime Simulator Market by Application
- 4.1.1 Maritime Colleges and Schools
- 4.1.2 Defense and Military
- 4.1.3 Ports and Shipping
- 4.1.4 Oil and Gas
- 4.1.5 Others
- 4.2 Global Maritime Simulator Market Size by Application
- 4.2.1 Global Maritime Simulator Market Size Overview by Application (2020-2031)
- 4.2.2 Global Maritime Simulator Historic Market Size Review by Application (2020-2025)
- 4.2.3 Global Maritime Simulator Forecasted Market Size by Application (2026-2031)
- 4.3 Key Regions Market Size by Application
- 4.3.1 North America Maritime Simulator Sales Breakdown by Application (2020-2025)
- 4.3.2 Europe Maritime Simulator Sales Breakdown by Application (2020-2025)
- 4.3.3 Asia-Pacific Maritime Simulator Sales Breakdown by Application (2020-2025)
- 4.3.4 Latin America Maritime Simulator Sales Breakdown by Application (2020-2025)
- 4.3.5 Middle East and Africa Maritime Simulator Sales Breakdown by Application (2020-2025)
5 North America Maritime Simulator by Country
- 5.1 North America Maritime Simulator Historic Market Size by Country
- 5.1.1 North America Maritime Simulator Market Size Growth Rate (CAGR) by Country: 2020 VS 2024 VS 2031
- 5.1.2 North America Maritime Simulator Sales in Volume by Country (2020-2025)
- 5.1.3 North America Maritime Simulator Sales in Value by Country (2020-2025)
- 5.2 North America Maritime Simulator Forecasted Market Size by Country
- 5.2.1 North America Maritime Simulator Sales in Volume by Country (2026-2031)
- 5.2.2 North America Maritime Simulator Sales in Value by Country (2026-2031)
6 Europe Maritime Simulator by Country
- 6.1 Europe Maritime Simulator Historic Market Size by Country
- 6.1.1 Europe Maritime Simulator Market Size Growth Rate (CAGR) by Country: 2020 VS 2024 VS 2031
- 6.1.2 Europe Maritime Simulator Sales in Volume by Country (2020-2025)
- 6.1.3 Europe Maritime Simulator Sales in Value by Country (2020-2025)
- 6.2 Europe Maritime Simulator Forecasted Market Size by Country
- 6.2.1 Europe Maritime Simulator Sales in Volume by Country (2026-2031)
- 6.2.2 Europe Maritime Simulator Sales in Value by Country (2026-2031)
7 Asia-Pacific Maritime Simulator by Region
- 7.1 Asia-Pacific Maritime Simulator Historic Market Size by Region
- 7.1.1 Asia-Pacific Maritime Simulator Market Size Growth Rate (CAGR) by Region: 2020 VS 2024 VS 2031
- 7.1.2 Asia-Pacific Maritime Simulator Sales in Volume by Region (2020-2025)
- 7.1.3 Asia-Pacific Maritime Simulator Sales in Value by Region (2020-2025)
- 7.2 Asia-Pacific Maritime Simulator Forecasted Market Size by Region
- 7.2.1 Asia-Pacific Maritime Simulator Sales in Volume by Region (2026-2031)
- 7.2.2 Asia-Pacific Maritime Simulator Sales in Value by Region (2026-2031)
8 Latin America Maritime Simulator by Country
- 8.1 Latin America Maritime Simulator Historic Market Size by Country
- 8.1.1 Latin America Maritime Simulator Market Size Growth Rate (CAGR) by Country: 2020 VS 2024 VS 2031
- 8.1.2 Latin America Maritime Simulator Sales in Volume by Country (2020-2025)
- 8.1.3 Latin America Maritime Simulator Sales in Value by Country (2020-2025)
- 8.2 Latin America Maritime Simulator Forecasted Market Size by Country
- 8.2.1 Latin America Maritime Simulator Sales in Volume by Country (2026-2031)
- 8.2.2 Latin America Maritime Simulator Sales in Value by Country (2026-2031)
9 Middle East and Africa Maritime Simulator by Country
- 9.1 Middle East and Africa Maritime Simulator Historic Market Size by Country
- 9.1.1 Middle East and Africa Maritime Simulator Market Size Growth Rate (CAGR) by Country: 2020 VS 2024 VS 2031
- 9.1.2 Middle East and Africa Maritime Simulator Sales in Volume by Country (2020-2025)
- 9.1.3 Middle East and Africa Maritime Simulator Sales in Value by Country (2020-2025)
- 9.2 Middle East and Africa Maritime Simulator Forecasted Market Size by Country
- 9.2.1 Middle East and Africa Maritime Simulator Sales in Volume by Country (2026-2031)
- 9.2.2 Middle East and Africa Maritime Simulator Sales in Value by Country (2026-2031)
10 Company Profiles
- 10.1 Wartsila
- 10.1.1 Wartsila Company Information
- 10.1.2 Wartsila Introduction and Business Overview
- 10.1.3 Wartsila Maritime Simulator Sales, Revenue and Gross Margin (2020-2025)
- 10.1.4 Wartsila Maritime Simulator Products Offered
- 10.1.5 Wartsila Recent Development
- 10.2 Furuno
- 10.2.1 Furuno Company Information
- 10.2.2 Furuno Introduction and Business Overview
- 10.2.3 Furuno Maritime Simulator Sales, Revenue and Gross Margin (2020-2025)
- 10.2.4 Furuno Maritime Simulator Products Offered
- 10.3 Kongsberg Digital
- 10.3.1 Kongsberg Digital Company Information
- 10.3.2 Kongsberg Digital Introduction and Business Overview
- 10.3.3 Kongsberg Digital Maritime Simulator Sales, Revenue and Gross Margin (2020-2025)
- 10.3.4 Kongsberg Digital Maritime Simulator Products Offered
- 10.3.5 Kongsberg Digital Recent Development
- 10.4 Rheinmetall
- 10.4.1 Rheinmetall Company Information
- 10.4.2 Rheinmetall Introduction and Business Overview
- 10.4.3 Rheinmetall Maritime Simulator Sales, Revenue and Gross Margin (2020-2025)
- 10.4.4 Rheinmetall Maritime Simulator Products Offered
- 10.4.5 Rheinmetall Recent Development
- 10.5 VSTEP Simulation
- 10.5.1 VSTEP Simulation Company Information
- 10.5.2 VSTEP Simulation Introduction and Business Overview
- 10.5.3 VSTEP Simulation Maritime Simulator Sales, Revenue and Gross Margin (2020-2025)
- 10.5.4 VSTEP Simulation Maritime Simulator Products Offered
- 10.5.5 VSTEP Simulation Recent Development
- 10.6 Japan Marine Science Inc.
- 10.6.1 Japan Marine Science Inc. Company Information
- 10.6.2 Japan Marine Science Inc. Introduction and Business Overview
- 10.6.3 Japan Marine Science Inc. Maritime Simulator Sales, Revenue and Gross Margin (2020-2025)
- 10.6.4 Japan Marine Science Inc. Maritime Simulator Products Offered
- 10.7 Poseidon Simulation
- 10.7.1 Poseidon Simulation Company Information
- 10.7.2 Poseidon Simulation Introduction and Business Overview
- 10.7.3 Poseidon Simulation Maritime Simulator Sales, Revenue and Gross Margin (2020-2025)
- 10.7.4 Poseidon Simulation Maritime Simulator Products Offered
- 10.8 PC Maritime
- 10.8.1 PC Maritime Company Information
- 10.8.2 PC Maritime Introduction and Business Overview
- 10.8.3 PC Maritime Maritime Simulator Sales, Revenue and Gross Margin (2020-2025)
- 10.8.4 PC Maritime Maritime Simulator Products Offered
- 10.9 ARI Simulation
- 10.9.1 ARI Simulation Company Information
- 10.9.2 ARI Simulation Introduction and Business Overview
- 10.9.3 ARI Simulation Maritime Simulator Sales, Revenue and Gross Margin (2020-2025)
- 10.9.4 ARI Simulation Maritime Simulator Products Offered
- 10.10 Virtual Marine Technology
- 10.10.1 Virtual Marine Technology Company Information
- 10.10.2 Virtual Marine Technology Introduction and Business Overview
- 10.10.3 Virtual Marine Technology Maritime Simulator Sales, Revenue and Gross Margin (2020-2025)
- 10.10.4 Virtual Marine Technology Maritime Simulator Products Offered
- 10.10.5 Virtual Marine Technology Recent Development
- 10.11 FORCE Technology
- 10.11.1 FORCE Technology Company Information
- 10.11.2 FORCE Technology Introduction and Business Overview
- 10.11.3 FORCE Technology Maritime Simulator Sales, Revenue and Gross Margin (2020-2025)
- 10.11.4 FORCE Technology Maritime Simulator Products Offered
- 10.11.5 FORCE Technology Recent Development
- 10.12 Image Soft
- 10.12.1 Image Soft Company Information
- 10.12.2 Image Soft Introduction and Business Overview
- 10.12.3 Image Soft Maritime Simulator Sales, Revenue and Gross Margin (2020-2025)
- 10.12.4 Image Soft Maritime Simulator Products Offered
- 10.13 Dalian Haida Zhilong Technology
- 10.13.1 Dalian Haida Zhilong Technology Company Information
- 10.13.2 Dalian Haida Zhilong Technology Introduction and Business Overview
- 10.13.3 Dalian Haida Zhilong Technology Maritime Simulator Sales, Revenue and Gross Margin (2020-2025)
- 10.13.4 Dalian Haida Zhilong Technology Maritime Simulator Products Offered
- 10.14 Shanghai Haiyang Weather Airmanship
- 10.14.1 Shanghai Haiyang Weather Airmanship Company Information
- 10.14.2 Shanghai Haiyang Weather Airmanship Introduction and Business Overview
- 10.14.3 Shanghai Haiyang Weather Airmanship Maritime Simulator Sales, Revenue and Gross Margin (2020-2025)
- 10.14.4 Shanghai Haiyang Weather Airmanship Maritime Simulator Products Offered
- 10.15 Xiamen Honggeng Marine Technology
- 10.15.1 Xiamen Honggeng Marine Technology Company Information
- 10.15.2 Xiamen Honggeng Marine Technology Introduction and Business Overview
- 10.15.3 Xiamen Honggeng Marine Technology Maritime Simulator Sales, Revenue and Gross Margin (2020-2025)
- 10.15.4 Xiamen Honggeng Marine Technology Maritime Simulator Products Offered
- 10.16 Morild Interaktiv
- 10.16.1 Morild Interaktiv Company Information
- 10.16.2 Morild Interaktiv Introduction and Business Overview
- 10.16.3 Morild Interaktiv Maritime Simulator Sales, Revenue and Gross Margin (2020-2025)
- 10.16.4 Morild Interaktiv Maritime Simulator Products Offered
11 Upstream, Opportunities, Challenges, Risks and Influences Factors Analysis
- 11.1 Maritime Simulator Key Raw Materials
- 11.1.1 Key Raw Materials
- 11.1.2 Raw Materials Key Suppliers
- 11.2 Manufacturing Cost Structure
- 11.2.1 Raw Materials
- 11.2.2 Labor Cost
- 11.2.3 Manufacturing Expenses
- 11.3 Maritime Simulator Industrial Chain Analysis
- 11.4 Maritime Simulator Market Dynamics
- 11.4.1 Maritime Simulator Industry Trends
- 11.4.2 Maritime Simulator Market Drivers
- 11.4.3 Maritime Simulator Market Challenges
- 11.4.4 Maritime Simulator Market Restraints
12 Marketing Strategy Analysis, Distributors
- 12.1 Sales Channel
- 12.2 Maritime Simulator Distributors
- 12.3 Maritime Simulator Downstream Customers
13 Research Findings and Conclusion
14 Appendix
- 14.1 Research Methodology
- 14.1.1 Methodology/Research Approach
- 14.1.2 Data Source
- 14.2 Author Details
- 14.3 Disclaimer 180
