|
|
市場調査レポート
商品コード
1702340
LiTDIの世界市場:2025年Global LiTDI Market Research Report 2025 |
||||||
|
|||||||
カスタマイズ可能
適宜更新あり
|
|||||||

| LiTDIの世界市場:2025年 |
|
出版日: 2025年04月14日
発行: QYResearch
ページ情報: 英文 101 Pages
納期: 2~3営業日
|

全表示
- 概要
- 図表
- 目次
世界のLiTDIの市場規模(収益ベース)は、2024年の1,424万米ドルから2031年には9,788万米ドルに達し、2025年~2031年のCAGRは30.90%と予測されています。
また、売上ベースでは、2024年の3万4,019Kgから2031年には26万4,802Kgに達し、2025年~2031年のCAGRは33.93%と予測されています。
北米のLiTDIの市場規模は、2024年の180万米ドルから2031年には1,004万米ドルに達し、2025年~2031年の予測期間中のCAGRは30.64%と予測されています。
LiTDIの欧州の市場規模は、2024年の198万米ドルから2031年には1,177万米ドルに達し、2025年~2031年の予測期間中のCAGRは28.45%と予測されています。
アジア太平洋のLiTDIの市場規模は、2024年の1,032万米ドルから2031年には7,531万米ドルに達し、2025年~2031年の予測期間中のCAGRは31.39%と予測されています。
LiTDIの主な世界メーカーには、Arkema、Suzhou Cheerchem Advanced Material、Hunan Chemfish Pharmaceuticalなどがあります。2024年には、世界の上位3ベンダーが売上高の約76.19%を占めています。
当レポートは、LiTDIの世界市場を量的・質的分析の両面から包括的に紹介することで、読者がビジネス/成長戦略を策定し、市場競争状況を評価し、現在の市場における自社のポジションを分析し、LiTDIに関する十分な情報に基づいたビジネス上の意思決定を行えるようにすることを目的としています。
LiTDIの市場規模・推計・予測は、2024年を基準年として、生産量/出荷量および収益で提供し、2020年から2031年までの期間の履歴データと予測データを掲載しています。当レポートでは、世界のLiTDI市場を包括的にセグメント化しています。製品タイプ別、用途別、参入企業別の地域別市場規模も掲載しています。
市場をより深く理解するために、競合情勢、主要競合企業のプロファイル、それぞれの市場ランクを掲載しています。また、技術動向や新製品開発についても論じています。
当レポートは、この市場におけるLiTDIメーカー、新規参入企業、産業チェーン関連企業にとって、市場全体と企業別、タイプ別、用途別、地域別のサブセグメントにおける収益、生産量、平均価格に関する情報を提供する一助となります。
目次
第1章 LiTDI市場概要
- 製品定義
- タイプ別LiTDI
- 用途別LiTDI
- 世界市場の成長見通し
- 前提と制限
第2章 メーカーによる別市場競争
第3章 LiTDIの生産、地域別
- 世界のLiTDIの生産額予測:2020年対2024年対2031年、地域別
- 世界のLiTDIの生産額:2020年~2031年、地域別
- 世界のLiTDIの生産量予測:2020年対2024年対2031年、地域別
- 世界のLiTDIの生産量:2020年~2031年、地域別
- 世界のLiTDI市場価格分析:2020年~2025年、地域別
- 世界のLiTDIの生産量と価値、前年比成長率
第4章 LiTDIの消費量、地域別
- 世界のLiTDIの消費量予測:2020年対2024年対2031年、地域別
- 世界のLiTDIの消費量:2020年~2031年、地域別
- 北米
- 欧州
- アジア太平洋
- ラテンアメリカ
- 中東・アフリカ
第5章 タイプ別セグメント
- 世界のLiTDのI生産量、タイプ別(2020年~2031年)
- 世界のLiTDIの生産額、タイプ別(2020年~2031年)
- 世界のLiTDIの価格、タイプ別(2020年~2031年)
第6章 用途別セグメント
- 世界のLiTDのI生産量、用途別(2020年~2031年)
- 世界のLiTDIの生産額、用途別(2020年~2031年)
- 世界のLiTDIの価格、用途別(2020年~2031年)
第7章 主要企業のプロファイル
- Arkema
- Suzhou Cheerchem Advanced Material
- Hunan Chemfish Pharmaceutica
第8章 産業チェーンと販売チャネルの分析
- LiTDI産業チェーン分析
- LiTDI原材料供給分析
- LiTDI生産モードとプロセス分析
- LiTDIセールス&マーケティング
- LiTDI顧客分析
第9章 LiTDI市場力学
第10章 調査結果と結論
第11章 調査手法とデータソース
List of Tables
- Table 1. Global LiTDI Market Value by Type, (US$ Million) & (2024 VS 2031)
- Table 2. Global LiTDI Market Value by Application, (US$ Million) & (2024 VS 2031)
- Table 3. Global LiTDI Production Capacity (Kg) by Manufacturers in 2024
- Table 4. Global LiTDI Production by Manufacturers (2020-2025) & (Kg)
- Table 5. Global LiTDI Production Market Share by Manufacturers (2020-2025)
- Table 6. Global LiTDI Production Value by Manufacturers (2020-2025) & (US$ Million)
- Table 7. Global LiTDI Production Value Share by Manufacturers (2020-2025)
- Table 8. Global Key Players of LiTDI, Industry Ranking, 2023 VS 2024
- Table 9. Company Type (Tier 1, Tier 2, and Tier 3) & (based on the Production Value in LiTDI as of 2024)
- Table 10. Global Market LiTDI Average Price by Manufacturers (US$/Kg) & (2020-2025)
- Table 11. Global Key Manufacturers of LiTDI, Manufacturing Base Distribution and Headquarters
- Table 12. Global Key Manufacturers of LiTDI, Product Offered and Application
- Table 13. Global Key Manufacturers of LiTDI, Date of Enter into This Industry
- Table 14. Global LiTDI Manufacturers Market Concentration Ratio (CR3 and HHI)
- Table 15. Mergers & Acquisitions, Expansion Plans
- Table 16. Global LiTDI Production Value by Region: 2020 VS 2024 VS 2031 (US$ Million)
- Table 17. Global LiTDI Production Value (US$ Million) by Region (2020-2025)
- Table 18. Global LiTDI Production Value Market Share by Region (2020-2025)
- Table 19. Global LiTDI Production Value (US$ Million) Forecast by Region (2026-2031)
- Table 20. Global LiTDI Production Value Market Share Forecast by Region (2026-2031)
- Table 21. Global LiTDI Production Comparison by Region: 2020 VS 2024 VS 2031 (Kg)
- Table 22. Global LiTDI Production (Kg) by Region (2020-2025)
- Table 23. Global LiTDI Production Market Share by Region (2020-2025)
- Table 24. Global LiTDI Production (Kg) Forecast by Region (2026-2031)
- Table 25. Global LiTDI Production Market Share Forecast by Region (2026-2031)
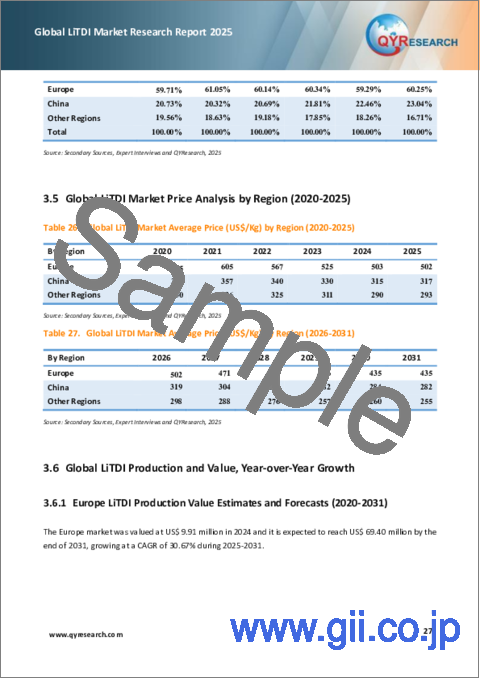
- Table 26. Global LiTDI Market Average Price (US$/Kg) by Region (2020-2025)
- Table 27. Global LiTDI Market Average Price (US$/Kg) by Region (2026-2031)
- Table 28. Global LiTDI Consumption Growth Rate by Region: 2020 VS 2024 VS 2031 (Kg)
- Table 29. Global LiTDI Consumption by Region (2020-2025) & (Kg)
- Table 30. Global LiTDI Consumption Market Share by Region (2020-2025)
- Table 31. Global LiTDI Forecasted Consumption by Region (2026-2031) & (Kg)
- Table 32. Global LiTDI Forecasted Consumption Market Share by Region (2026-2031)
- Table 33. North America LiTDI Consumption Growth Rate by Country: 2020 VS 2024 VS 2031 (Kg)
- Table 34. North America LiTDI Consumption by Country (2020-2025) & (Kg)
- Table 35. North America LiTDI Consumption by Country (2026-2031) & (Kg)
- Table 36. Europe LiTDI Consumption Growth Rate by Country: 2020 VS 2024 VS 2031 (Kg)
- Table 37. Europe LiTDI Consumption by Country (2020-2025) & (Kg)
- Table 38. Europe LiTDI Consumption by Country (2026-2031) & (Kg)
- Table 39. Asia Pacific LiTDI Consumption Growth Rate by Region: 2020 VS 2024 VS 2031 (Kg)
- Table 40. Asia Pacific LiTDI Consumption by Region (2020-2025) & (Kg)
- Table 41. Asia Pacific LiTDI Consumption by Region (2026-2031) & (Kg)
- Table 42. Global LiTDI Production (Kg) by Type (2020-2025)
- Table 43. Global LiTDI Production (Kg) by Type (2026-2031)
- Table 44. Global LiTDI Production Market Share by Type (2020-2025)
- Table 45. Global LiTDI Production Market Share by Type (2026-2031)
- Table 46. Global LiTDI Production Value (US$ Million) by Type (2020-2025)
- Table 47. Global LiTDI Production Value (US$ Million) by Type (2026-2031)
- Table 48. Global LiTDI Production Value Market Share by Type (2020-2025)
- Table 49. Global LiTDI Production Value Market Share by Type (2026-2031)
- Table 50. Global LiTDI Price (US$/Kg) by Type (2020-2025)
- Table 51. Global LiTDI Price (US$/Kg) by Type (2026-2031)
- Table 52. Global LiTDI Production (Kg) by Application (2020-2025)
- Table 53. Global LiTDI Production (Kg) by Application (2026-2031)
- Table 54. Global LiTDI Production Market Share by Application (2020-2025)
- Table 55. Global LiTDI Production Market Share by Application (2026-2031)
- Table 56. Global LiTDI Production Value (US$ Million) by Application (2020-2025)
- Table 57. Global LiTDI Production Value (US$ Million) by Application (2026-2031)
- Table 58. Global LiTDI Production Value Market Share by Application (2020-2025)
- Table 59. Global LiTDI Production Value Market Share by Application (2026-2031)
- Table 60. Global LiTDI Price (US$/Kg) by Application (2020-2025)
- Table 61. Global LiTDI Price (US$/Kg) by Application (2026-2031)
- Table 62. Arkema LiTDI Company Information
- Table 63. Arkema LiTDI Specification and Application
- Table 64. Arkema LiTDI Production (Kg), Value (US$ Million), Price (US$/Kg) and Gross Margin (2020-2025)
- Table 65. Arkema Main Business and Markets Served
- Table 66. Arkema Recent Developments/Updates
- Table 67. Suzhou Cheerchem Advanced Material LiTDI Company Information
- Table 68. Suzhou Cheerchem Advanced Material LiTDI Specification and Application
- Table 69. Suzhou Cheerchem Advanced Material LiTDI Production (Kg), Value (US$ Million), Price (US$/Kg) and Gross Margin (2020-2025)
- Table 70. Suzhou Cheerchem Advanced Material Main Business and Markets Served
- Table 71. Hunan Chemfish Pharmaceutical LiTDI Company Information
- Table 72. Hunan Chemfish Pharmaceutical LiTDI Specification and Application
- Table 73. Hunan Chemfish Pharmaceutical LiTDI Production (Kg), Value (US$ Million), Price (US$/Kg) and Gross Margin (2020-2025)
- Table 74. Hunan Chemfish Pharmaceutical Main Business and Markets Served
- Table 75. Key Raw Materials Lists
- Table 76. Raw Materials Key Suppliers Lists
- Table 77. LiTDI Distributors List
- Table 78. LiTDI Customers List
- Table 79. LiTDI Market Trends
- Table 80. LiTDI Market Drivers
- Table 81. LiTDI Market Challenges
- Table 82. LiTDI Market Restraints
- Table 83. Research Programs/Design for This Report
- Table 84. Key Data Information from Secondary Sources
- Table 85. Key Data Information from Primary Sources
- Table 86. Authors List of This Report
List of Figures
- Figure 1. Product Picture of LiTDI
- Figure 2. Global LiTDI Market Value by Type, (US$ Million) & (2020-2031)
- Figure 3. Global LiTDI Market Share by Type: 2024 VS 2031
- Figure 4. Global LiTDI Market Value by Application, (US$ Million) & (2020-2031)
- Figure 5. Global LiTDI Market Share by Application: 2024 VS 2031
- Figure 6. Lithium-ion Battery Electrolyte Additive
- Figure 7. Others
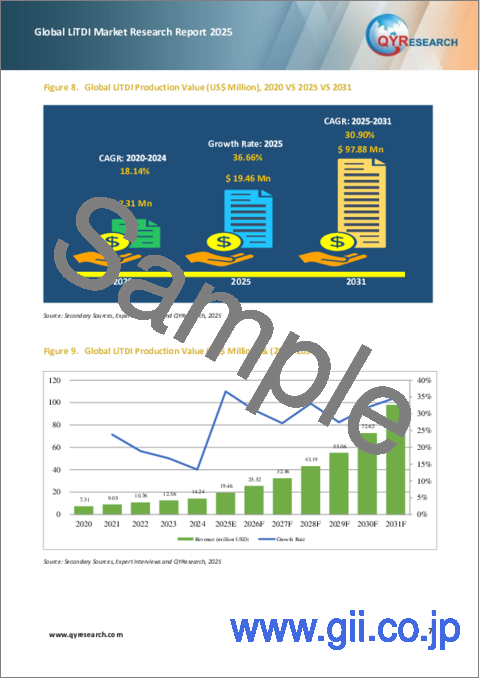
- Figure 8. Global LiTDI Production Value (US$ Million), 2020 VS 2025 VS 2031
- Figure 9. Global LiTDI Production Value (US$ Million) & (2020-2031)
- Figure 10. Global LiTDI Production Capacity (Kg) & (2020-2031)
- Figure 11. Global LiTDI Production (Kg) & (2020-2031)
- Figure 12. Global LiTDI Average Price (US$/Kg) & (2020-2031)
- Figure 13. LiTDI Report Years Considered
- Figure 14. LiTDI Production Share by Manufacturers in 2024
- Figure 15. Global LiTDI Production Value Share by Manufacturers (2024)
- Figure 16. LiTDI Market Share by Company Type (Tier 1, Tier 2, and Tier 3): 2020 VS 2024
- Figure 17. The Global 3 Largest Players: Market Share by LiTDI Revenue in 2024
- Figure 18. Global LiTDI Production Value by Region: 2020 VS 2024 VS 2031 (US$ Million)
- Figure 19. Global LiTDI Production Value Market Share by Region: 2020 VS 2024 VS 2031
- Figure 20. Global LiTDI Production Comparison by Region: 2020 VS 2024 VS 2031 (Kg)
- Figure 21. Global LiTDI Production Market Share by Region: 2020 VS 2024 VS 2031
- Figure 22. Europe LiTDI Production Value (US$ Million) Growth Rate (2020-2031)
- Figure 23. China LiTDI Production Value (US$ Million) Growth Rate (2020-2031)
- Figure 24. Global LiTDI Consumption by Region: 2020 VS 2024 VS 2031 (Kg)
- Figure 25. Global LiTDI Consumption Market Share by Region: 2020 VS 2024 VS 2031
- Figure 26. North America LiTDI Consumption and Growth Rate (2020-2031) & (Kg)
- Figure 27. North America LiTDI Consumption Market Share by Country (2020-2031)
- Figure 28. U.S. LiTDI Consumption and Growth Rate (2020-2031) & (Kg)
- Figure 29. Canada LiTDI Consumption and Growth Rate (2020-2031) & (Kg)
- Figure 30. Europe LiTDI Consumption and Growth Rate (2020-2031) & (Kg)
- Figure 31. Europe LiTDI Consumption Market Share by Country (2020-2031)
- Figure 32. Germany LiTDI Consumption and Growth Rate (2020-2031) & (Kg)
- Figure 33. France LiTDI Consumption and Growth Rate (2020-2031) & (Kg)
- Figure 34. U.K. LiTDI Consumption and Growth Rate (2020-2031) & (Kg)
- Figure 35. Italy LiTDI Consumption and Growth Rate (2020-2031) & (Kg)
- Figure 36. Russia LiTDI Consumption and Growth Rate (2020-2031) & (Kg)
- Figure 37. Asia Pacific LiTDI Consumption and Growth Rate (2020-2031) & (Kg)
- Figure 38. Asia Pacific LiTDI Consumption Market Share by Region (2020-2031)
- Figure 39. China LiTDI Consumption and Growth Rate (2020-2031) & (Kg)
- Figure 40. Japan LiTDI Consumption and Growth Rate (2020-2031) & (Kg)
- Figure 41. South Korea LiTDI Consumption and Growth Rate (2020-2031) & (Kg)
- Figure 42. Southeast Asia LiTDI Consumption and Growth Rate (2020-2031) & (Kg)
- Figure 43. India LiTDI Consumption and Growth Rate (2020-2031) & (Kg)
- Figure 44. Australia LiTDI Consumption and Growth Rate (2020-2031) & (Kg)
- Figure 45. Latin America LiTDI Consumption and Growth Rate (2020-2031) & (Kg)
- Figure 46. Middle East and Africa LiTDI Consumption and Growth Rate (2020-2031) & (Kg)
- Figure 47. Global Production Market Share of LiTDI by Type (2020-2031)
- Figure 48. Global Production Value Market Share of LiTDI by Type (2020-2031)
- Figure 49. Global LiTDI Price (US$/Kg) by Type (2020-2031)
- Figure 50. Global Production Market Share of LiTDI by Application (2020-2031)
- Figure 51. Global Production Value Market Share of LiTDI by Application (2020-2031)
- Figure 52. Global LiTDI Price (US$/Kg) by Application (2020-2031)
- Figure 53. LiTDI Value Chain
- Figure 54. Channels of Distribution (Direct Vs Distribution)
- Figure 55. Bottom-up and Top-down Approaches for This Report
- Figure 56. Data Triangulation
Global LiTDI market size in terms of revenue is projected to reach 97.88 million USD by 2031 from 14.24 million USD in 2024, with a CAGR 30.90% during 2025-2031. Global LiTDI market size in terms of sales is projected to reach 264,802 Kg by 2031 from 34,019 Kg in 2024, with a CAGR 33.93% during 2025-2031.
North America market for LiTDI is estimated to increase from 1.80 million USD in 2024 to reach 10.04 million USD by 2031, at a CAGR of 30.64% during the forecast period of 2025 through 2031.
Europe market for LiTDI is estimated to increase from 1.98 million USD in 2024 to reach 11.77 million USD by 2031, at a CAGR of 28.45% during the forecast period of 2025 through 2031.
Asia-Pacific market for LiTDI is estimated to increase from 10.32 million USD in 2024 to reach 75.31 million USD by 2031, at a CAGR of 31.39% during the forecast period of 2025 through 2031.
The major global manufacturers of LiTDI include Arkema, Suzhou Cheerchem Advanced Material, Hunan Chemfish Pharmaceutical etc. In 2024, the world's top three vendors accounted for approximately 76.19% of the revenue.
This report aims to provide a comprehensive presentation of the global market for LiTDI, with both quantitative and qualitative analysis, to help readers develop business/growth strategies, assess the market competitive situation, analyze their position in the current marketplace, and make informed business decisions regarding LiTDI.
The LiTDI market size, estimations, and forecasts are provided in terms of output/shipments (Kg) and revenue ($ millions), considering 2024 as the base year, with history and forecast data for the period from 2020 to 2031. This report segments the global LiTDI market comprehensively. Regional market sizes, concerning products by Type, by Application, and by players, are also provided.
For a more in-depth understanding of the market, the report provides profiles of the competitive landscape, key competitors, and their respective market ranks. The report also discusses technological trends and new product developments.
The report will help the LiTDI manufacturers, new entrants, and industry chain related companies in this market with information on the revenues, production, and average price for the overall market and the sub-segments across the different segments, by company, by Type, by Application, and by regions.
Market Segmentation
By Company
- Arkema
- Suzhou Cheerchem Advanced Material
- Hunan Chemfish Pharmaceutical
Segment by Type
- >=99.5%
- <99.5%
Segment by Application
- Lithium-ion Battery Electrolyte Additive
- Others
Production by Region
- Europe
- China
Consumption by Region
- North America
- U.S.
- Canada
- Asia-Pacific
- China
- Japan
- South Korea
- Southeast Asia
- India
- Australia
- Europe
- Germany
- France
- U.K.
- Italy
- Russia
- Rest of Europe
- Latin America, Middle East & Africa
Chapter Outline
Chapter 1: Introduces the report scope of the report, executive summary of different market segments (by region, by Type, by Application, etc), including the market size of each market segment, future development potential, and so on. It offers a high-level view of the current state of the market and its likely evolution in the short to mid-term, and long term.
Chapter 2: Detailed analysis of LiTDI manufacturers competitive landscape, price, production and value market share, latest development plan, merger, and acquisition information, etc.
Chapter 3: Production/output, value of LiTDI by region/country. It provides a quantitative analysis of the market size and development potential of each region in the next six years.
Chapter 4: Consumption of LiTDI in regional level and country level. It provides a quantitative analysis of the market size and development potential of each region and its main countries and introduces the market development, future development prospects, market space, and production of each country in the world.
Chapter 5: Provides the analysis of various market segments by Type, covering the market size and development potential of each market segment, to help readers find the blue ocean market in different market segments.
Chapter 6: Provides the analysis of various market segments by Application, covering the market size and development potential of each market segment, to help readers find the blue ocean market in different downstream markets.
Chapter 7: Provides profiles of key players, introducing the basic situation of the main companies in the market in detail, including product production/output, value, price, gross margin, product introduction, recent development, etc.
Chapter 8: Analysis of industrial chain, including the upstream and downstream of the industry.
Chapter 9: Introduces the market dynamics, latest developments of the market, the driving factors and restrictive factors of the market, the challenges and risks faced by manufacturers in the industry, and the analysis of relevant policies in the industry.
Chapter 10: The main points and conclusions of the report.
Table of Contents
1 LiTDI Market Overview
- 1.1 Product Definition
- 1.2 LiTDI by Type
- 1.2.1 Global LiTDI Market Value Growth Rate Analysis by Type: 2024 VS 2031
- 1.2.2 >=99.5%
- 1.2.3 <99.5%
- 1.3 LiTDI by Application
- 1.3.1 Global LiTDI Market Value Growth Rate Analysis by Application: 2024 VS 2031
- 1.3.2 Lithium-ion Battery Electrolyte Additive
- 1.3.3 Others
- 1.4 Global Market Growth Prospects
- 1.4.1 Global LiTDI Production Value Estimates and Forecasts (2020-2031)
- 1.4.2 Global LiTDI Production Capacity Estimates and Forecasts (2020-2031)
- 1.4.3 Global LiTDI Production Estimates and Forecasts (2020-2031)
- 1.4.4 Global LiTDI Market Average Price Estimates and Forecasts (2020-2031)
- 1.5 Assumptions and Limitations
2 Market Competition by Manufacturers
- 2.1 Global LiTDI Production Market Share by Manufacturers (2020-2025)
- 2.2 Global LiTDI Production Value Market Share by Manufacturers (2020-2025)
- 2.3 Global Key Players of LiTDI, Industry Ranking, 2023 VS 2024
- 2.4 Global LiTDI Company Type and Market Share by Company Type (Tier 1, Tier 2, and Tier 3)
- 2.5 Global LiTDI Average Price by Manufacturers (2020-2025)
- 2.6 Global Key Manufacturers of LiTDI, Manufacturing Base Distribution and Headquarters
- 2.7 Global Key Manufacturers of LiTDI, Product Offered and Application
- 2.8 Global Key Manufacturers of LiTDI, Date of Enter into This Industry
- 2.9 LiTDI Market Competitive Situation and Trends
- 2.9.1 LiTDI Market Concentration Rate
- 2.9.2 Global 3 Largest LiTDI Players Market Share by Revenue
- 2.10 Mergers & Acquisitions, Expansion
3 LiTDI Production by Region
- 3.1 Global LiTDI Production Value Estimates and Forecasts by Region: 2020 VS 2024 VS 2031
- 3.2 Global LiTDI Production Value by Region (2020-2031)
- 3.2.1 Global LiTDI Production Value by Region (2020-2025)
- 3.2.2 Global Forecasted Production Value of LiTDI by Region (2026-2031)
- 3.3 Global LiTDI Production Estimates and Forecasts by Region: 2020 VS 2024 VS 2031
- 3.4 Global LiTDI Production Volume by Region (2020-2031)
- 3.4.1 Global LiTDI Production by Region (2020-2025)
- 3.4.2 Global Forecasted Production of LiTDI by Region (2026-2031)
- 3.5 Global LiTDI Market Price Analysis by Region (2020-2025)
- 3.6 Global LiTDI Production and Value, Year-over-Year Growth
- 3.6.1 Europe LiTDI Production Value Estimates and Forecasts (2020-2031)
- 3.6.2 China LiTDI Production Value Estimates and Forecasts (2020-2031)
4 LiTDI Consumption by Region
- 4.1 Global LiTDI Consumption Estimates and Forecasts by Region: 2020 VS 2024 VS 2031
- 4.2 Global LiTDI Consumption by Region (2020-2031)
- 4.2.1 Global LiTDI Consumption by Region (2020-2025)
- 4.2.2 Global LiTDI Forecasted Consumption by Region (2026-2031)
- 4.3 North America
- 4.3.1 North America LiTDI Consumption Growth Rate by Country: 2020 VS 2024 VS 2031
- 4.3.2 North America LiTDI Consumption by Country (2020-2031)
- 4.3.3 U.S.
- 4.3.4 Canada
- 4.4 Europe
- 4.4.1 Europe LiTDI Consumption Growth Rate by Country: 2020 VS 2024 VS 2031
- 4.4.2 Europe LiTDI Consumption by Country (2020-2031)
- 4.4.3 Germany
- 4.4.4 France
- 4.4.5 U.K.
- 4.4.6 Italy
- 4.4.7 Russia
- 4.5 Asia Pacific
- 4.5.1 Asia Pacific LiTDI Consumption Growth Rate by Region: 2020 VS 2024 VS 2031
- 4.5.2 Asia Pacific LiTDI Consumption by Region (2020-2031)
- 4.5.3 China
- 4.5.4 Japan
- 4.5.5 South Korea
- 4.5.6 Southeast Asia
- 4.5.7 India
- 4.5.8 Australia
- 4.6 Latin America
- 4.7 Middle East and Africa
5 Segment by Type
- 5.1 Global LiTDI Production by Type (2020-2031)
- 5.1.1 Global LiTDI Production by Type (2020-2025)
- 5.1.2 Global LiTDI Production by Type (2026-2031)
- 5.1.3 Global LiTDI Production Market Share by Type (2020-2031)
- 5.2 Global LiTDI Production Value by Type (2020-2031)
- 5.2.1 Global LiTDI Production Value by Type (2020-2025)
- 5.2.2 Global LiTDI Production Value by Type (2026-2031)
- 5.2.3 Global LiTDI Production Value Market Share by Type (2020-2031)
- 5.3 Global LiTDI Price by Type (2020-2031)
6 Segment by Application
- 6.1 Global LiTDI Production by Application (2020-2031)
- 6.1.1 Global LiTDI Production by Application (2020-2025)
- 6.1.2 Global LiTDI Production by Application (2026-2031)
- 6.1.3 Global LiTDI Production Market Share by Application (2020-2031)
- 6.2 Global LiTDI Production Value by Application (2020-2031)
- 6.2.1 Global LiTDI Production Value by Application (2020-2025)
- 6.2.2 Global LiTDI Production Value by Application (2026-2031)
- 6.2.3 Global LiTDI Production Value Market Share by Application (2020-2031)
- 6.3 Global LiTDI Price by Application (2020-2031)
7 Key Companies Profiled
- 7.1 Arkema
- 7.1.1 Arkema LiTDI Company Information
- 7.1.2 Arkema LiTDI Product Portfolio
- 7.1.3 Arkema LiTDI Production, Value, Price and Gross Margin (2020-2025)
- 7.1.4 Arkema Main Business and Markets Served
- 7.1.5 Arkema Recent Developments/Updates
- 7.2 Suzhou Cheerchem Advanced Material
- 7.2.1 Suzhou Cheerchem Advanced Material LiTDI Company Information
- 7.2.2 Suzhou Cheerchem Advanced Material LiTDI Product Portfolio
- 7.2.3 Suzhou Cheerchem Advanced Material LiTDI Production, Value, Price and Gross Margin (2020-2025)
- 7.2.4 Suzhou Cheerchem Advanced Material Main Business and Markets Served
- 7.3 Hunan Chemfish Pharmaceutical
- 7.3.1 Hunan Chemfish Pharmaceutical LiTDI Company Information
- 7.3.2 Hunan Chemfish Pharmaceutical LiTDI Product Portfolio
- 7.3.3 Hunan Chemfish Pharmaceutical LiTDI Production, Value, Price and Gross Margin (2020-2025)
- 7.3.4 Hunan Chemfish Pharmaceutical Main Business and Markets Served
8 Industry Chain and Sales Channels Analysis
- 8.1 LiTDI Industry Chain Analysis
- 8.2 LiTDI Raw Material Supply Analysis
- 8.2.1 Key Raw Materials
- 8.2.2 Raw Materials Key Suppliers
- 8.3 LiTDI Production Mode & Process Analysis
- 8.4 LiTDI Sales and Marketing
- 8.4.1 LiTDI Sales Channels
- 8.4.2 LiTDI Distributors
- 8.5 LiTDI Customer Analysis
9 LiTDI Market Dynamics
- 9.1 LiTDI Industry Trends
- 9.2 LiTDI Market Drivers
- 9.3 LiTDI Market Challenges
- 9.4 LiTDI Market Restraints
10 Research Findings and Conclusion
11 Methodology and Data Source
- 11.1 Methodology/Research Approach
- 11.1.1 Research Programs/Design
- 11.1.2 Market Size Estimation
- 11.1.3 Market Breakdown and Data Triangulation
- 11.2 Data Source
- 11.2.1 Secondary Sources
- 11.2.2 Primary Sources
- 11.3 Author List
- 11.4 Disclaimer 85

