|
|
市場調査レポート
商品コード
1689617
合成/バイオアニリンの世界市場 - 市場シェアとランキング、全体の売上、需要の予測(2025年~2031年)Synthetic and Bio-Based Aniline - Global Market Share and Ranking, Overall Sales and Demand Forecast 2025-2031 |
||||||
|
|||||||
カスタマイズ可能
適宜更新あり
|
|||||||

| 合成/バイオアニリンの世界市場 - 市場シェアとランキング、全体の売上、需要の予測(2025年~2031年) |
|
出版日: 2025年03月27日
発行: QYResearch
ページ情報: 英文 177 Pages
納期: 2~3営業日
|

全表示
- 概要
- 図表
- 目次
世界の合成/バイオアニリンの市場規模(収益ベース)は、2024年の119億3,506万米ドルから2031年までに172億4,720万米ドルに達すると予測され、2025年~2031年にCAGRで5.60%の成長が見込まれます。
北米の市場規模は、2024年の22億5,019万米ドルから2031年までに27億9,670万米ドルに達すると推定され、2025年~2031年の予測期間のCAGRは5.34%です。
欧州の市場規模は、2024年の30億6,640万米ドルから2031年までに43億3,768万米ドルに達すると推定され、2025年~2031年の予測期間のCAGRは5.67%です。
アジア太平洋の市場規模は、2024年の59億8,792万米ドルから2031年までに92億1,552万米ドルに達すると推定され、2025年~2031年の予測期間のCAGRは5.75%です。
世界の合成/バイオアニリンの主要メーカーは、BASF、Covestro、Wanhua Chemical、Bondalti、Lanxess、Sumitomo Chemical、San Fu Chemical、Shandong Jinling Group、Jilin Connell Chemical、Sinopecなどです。2024年、世界の上位5ベンダーが収益の約72.04%を占めました。Huntsmanのアニリンは主にMDIとMDIベースの製品を製造するための化学中間体として使用され、消費者向けに直接販売されていません。
当レポートでは、世界の合成/バイオアニリン市場について調査分析し、各地域の市場規模と予測、主要企業のランキング、市場シェアなどの情報を提供しています。
目次
第1章 市場の概要
- 合成/バイオアニリン製品のイントロダクション
- 世界の合成/バイオアニリンの市場規模の予測
- 世界の合成/バイオアニリンの売上金額(2020年~2031年)
- 世界の合成/バイオアニリンの売上数量(2020年~2031年)
- 世界の合成/バイオアニリンの販売価格(2020年~2031年)
- 合成/バイオアニリン市場の動向と促進要因
- 合成/バイオアニリン産業の動向
- 合成/バイオアニリン市場の促進要因と機会
- 合成/バイオアニリン市場の課題
- 合成/バイオアニリン市場の抑制要因
- 前提条件と制限
- 調査目的
- 考慮される年数
第2章 競合分析:企業別
- 世界の合成/バイオアニリン企業の収益ランキング(2024年)
- 世界の合成/バイオアニリンの収益:企業別(2020年~2025年)
- 世界の合成/バイオアニリン企業の売上数量ランキング(2024年)
- 世界の合成/バイオアニリンの売上数量:企業別(2020年~2025年)
- 世界の合成/バイオアニリンの平均価格:企業別(2020年~2025年)
- 主要メーカーの合成/バイオアニリン製造拠点と本社
- 主要メーカーの合成/バイオアニリン製品
- 合成/バイオアニリンの主要メーカー、設立日
- 合成/バイオアニリン市場の競合分析
- 合成/バイオアニリンの市場集中度(2020年~2025年)
- 世界の合成/バイオアニリンの収益における5大・10大メーカー(2024年)
- 世界の主要メーカー:企業タイプ別(Tier 1・Tier 2・Tier 3)(2024年時点の合成/バイオアニリンの収益に基づく)
- 合併と買収、拡大
第3章 セグメント:タイプ別
- イントロダクション:タイプ別
- 合成アニリン(石油系)
- バイオアニリン
- 世界の合成/バイオアニリンの売上金額:タイプ別
- 世界の合成/バイオアニリンの売上金額:タイプ別(2020年・2024年・2031年)
- 世界の合成/バイオアニリンの売上金額:タイプ別(2020年~2031年)
- 世界の合成/バイオアニリンの売上金額:タイプ別(2020年~2031年)
- 世界の合成/バイオアニリンの売上数量:タイプ別
- 世界の合成/バイオアニリンの売上数量:タイプ別(2020年・2024年・2031年)
- 世界の合成/バイオアニリンの売上数量:タイプ別(2020年~2031年)
- 世界の合成/バイオアニリンの売上数量:タイプ別(2020年~2031年)
- 世界の合成/バイオアニリンの平均価格:タイプ別(2020年~2031年)
第4章 セグメント:用途別
- イントロダクション:用途別
- ジフェニルメタンジイソシアネート(MDI)
- ゴム
- 染料、顔料
- 農薬
- 製薬
- その他
- 世界の合成/バイオアニリンの売上金額:用途別
- 世界の合成/バイオアニリンの売上金額:用途別(2020年・2024年・2031年)
- 世界の合成/バイオアニリンの売上金額:用途別(2020年~2031年)
- 世界の合成/バイオアニリンの売上金額:用途別(2020年~2031年)
- 世界の合成/バイオアニリンの売上数量:用途別
- 世界の合成/バイオアニリンの売上数量:用途別(2020年・2024年・2031年)
- 世界の合成/バイオアニリンの売上数量:用途別(2020年~2031年)
- 世界の合成/バイオアニリンの売上数量:用途別(2020年~2031年)
- 世界の合成/バイオアニリンの平均価格:用途別(2020年~2031年)
第5章 セグメント:地域別
- 世界の合成/バイオアニリンの売上金額:地域別
- 世界の合成/バイオアニリンの売上金額:地域別(2020年・2024年・2031年)
- 世界の合成/バイオアニリンの売上金額:地域別(2020年~2025年)
- 世界の合成/バイオアニリンの売上金額:地域別(2026年~2031年)
- 世界の合成/バイオアニリンの売上金額:地域別(2020年~2031年)
- 世界の合成/バイオアニリンの売上数量:地域別
- 世界の合成/バイオアニリンの売上数量:地域別(2020年・2024年・2031年)
- 世界の合成/バイオアニリンの売上数量:地域別(2020年~2025年)
- 世界の合成/バイオアニリンの売上数量:地域別(2026年~2031年)
- 世界の合成/バイオアニリンの売上数量:地域別(2020年~2031年)
- 世界の合成/バイオアニリンの平均価格:地域別(2020年~2031年)
- 北米
- 北米の合成/バイオアニリンの売上金額(2020年~2031年)
- 北米の合成/バイオアニリンの売上金額:国別(2024年・2031年)
- 欧州
- 欧州の合成/バイオアニリンの売上金額(2020年~2031年)
- 欧州の合成/バイオアニリンの売上金額:国別(2024年・2031年)
- アジア太平洋
- アジア太平洋の合成/バイオアニリンの売上金額(2020年~2031年)
- アジア太平洋の合成/バイオアニリンの売上金額:地域別(2024年・2031年)
- ラテンアメリカ
- ラテンアメリカの合成/バイオアニリンの売上金額(2020年~2031年)
- ラテンアメリカの合成/バイオアニリンの売上金額:国別(2024年・2031年)
- 中東・アフリカ
- 中東・アフリカの合成/バイオアニリンの売上金額(2020年~2031年)
- 中東・アフリカの合成/バイオアニリンの売上金額:国別(2024年・2031年)
第6章 セグメント:主要国/地域別
- 主要国/地域の合成/バイオアニリンの売上金額成長動向(2020年・2024年・2031年)
- 主要国/地域の合成/バイオアニリンの売上金額と売上数量
- 主要国/地域の合成/バイオアニリンの売上金額(2020年~2031年)
- 主要国/地域の合成/バイオアニリンの売上数量(2020年~2031年)
- 米国
- 米国の合成/バイオアニリンの売上金額(2020年~2031年)
- 米国の合成/バイオアニリンの売上金額:タイプ別(2024年・2031年)
- 米国の合成/バイオアニリンの売上金額:用途別(2024年・2031年)
- 欧州
- 欧州の合成/バイオアニリンの売上金額(2020年~2031年)
- 欧州の合成/バイオアニリンの売上金額:タイプ別(2024年・2031年)
- 欧州の合成/バイオアニリンの売上金額:用途別(2024年・2031年)
- 中国
- 中国の合成/バイオアニリンの売上金額(2020年~2031年)
- 中国の合成/バイオアニリンの売上金額:タイプ別(2024年・2031年)
- 中国の合成/バイオアニリンの売上金額:用途別(2024年・2031年)
- 日本
- 日本の合成/バイオアニリンの売上金額(2020年~2031年)
- 日本の合成/バイオアニリンの売上金額:タイプ別(2024年・2031年)
- 日本の合成/バイオアニリンの売上金額:用途別(2024年・2031年)
- 韓国
- 韓国の合成/バイオアニリンの売上金額(2020年~2031年)
- 韓国の合成/バイオアニリンの売上金額:タイプ別(2024年・2031年)
- 韓国の合成/バイオアニリンの売上金額:用途別(2024年・2031年)
- 東南アジア
- 東南アジアの合成/バイオアニリンの売上金額(2020年~2031年)
- 東南アジアの合成/バイオアニリンの売上金額:タイプ別(2024年・2031年)
- 東南アジアの合成/バイオアニリンの売上金額:用途別(2024年・2031年)
- インド
- インドの合成/バイオアニリンの売上金額(2020年~2031年)
- インドの合成/バイオアニリンの売上金額:タイプ別(2024年・2031年)
- インドの合成/バイオアニリンの売上金額:用途別(2024年・2031年)
第7章 企業プロファイル
- BASF
- Covestro
- Wanhua Chemical
- Bondalti
- Lanxess
- Sumitomo Chemical
- San Fu Chemical
- Shandong Jinling Group
- Connell Chemical
- Sinopec
- Sinochem Group
- Chongqing Changfeng Chemical
- Shandong Hangda Chemical
第8章 産業チェーン分析
- 合成/バイオアニリンの産業チェーン
- 合成/バイオアニリンの上流分析
- 主な原材料
- 原材料の主要サプライヤー
- 製造コスト構造
- 中流分析
- 下流分析(顧客分析)
- 販売モデルと販売チャネル
- 合成/バイオアニリンの販売モデル
- 販売チャネル
- 合成/バイオアニリンの販売業者
第9章 調査結果と結論
第10章 付録
List of Tables
- Table 1. Synthetic and Bio-Based Aniline Market Trends
- Table 2. Synthetic and Bio-Based Aniline Market Drivers & Opportunity
- Table 3. Synthetic and Bio-Based Aniline Market Challenges
- Table 4. Synthetic and Bio-Based Aniline Market Restraints
- Table 5. Global Synthetic and Bio-Based Aniline Revenue by Company (2020-2025) & (million USD)
- Table 6. Global Synthetic and Bio-Based Aniline Revenue Market Share by Company (2020-2025)
- Table 7. Global Synthetic and Bio-Based Aniline Sales Volume by Company (2020-2025) & (k Tons)
- Table 8. Global Synthetic and Bio-Based Aniline Sales Volume Market Share by Company (2020-2025)
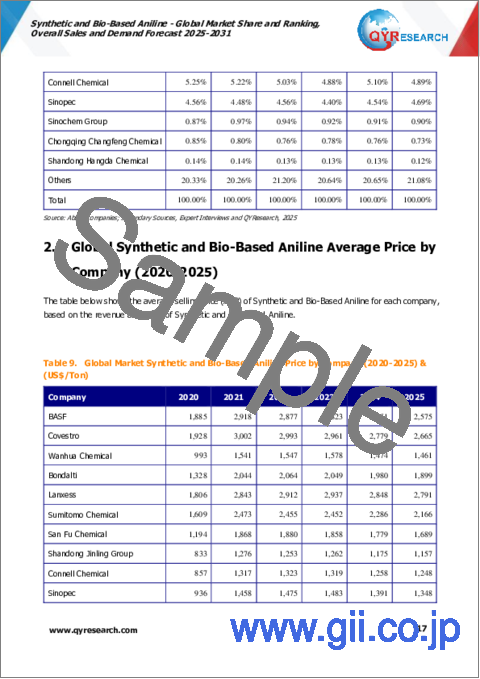
- Table 9. Global Market Synthetic and Bio-Based Aniline Price by Company (2020-2025) & (US$/Ton)
- Table 10. Key Manufacturers Synthetic and Bio-Based Aniline Manufacturing Base and Headquarters
- Table 11. Key Manufacturers Synthetic and Bio-Based Aniline Product Type
- Table 12. Key Manufacturers of Synthetic and Bio-Based Aniline, Founding Date
- Table 13. Global Synthetic and Bio-Based Aniline Manufacturers Market Concentration Ratio (CR5 and HHI)
- Table 14. Global Top Manufacturers Market Share by Company Type (Tier 1, Tier 2, and Tier 3) & (based on the Revenue in Synthetic and Bio-Based Aniline as of 2024)
- Table 15. Mergers & Acquisitions, Expansion Plans
- Table 16. Global Synthetic and Bio-Based Aniline Sales Value by Type: 2020 VS 2024 VS 2031 (million USD)
- Table 17. Global Synthetic and Bio-Based Aniline Sales Value by Type (2020-2025) & (million USD)
- Table 18. Global Synthetic and Bio-Based Aniline Sales Value by Type (2026-2031) & (million USD)
- Table 19. Global Synthetic and Bio-Based Aniline Sales Market Share in Value by Type (2020-2025)
- Table 20. Global Synthetic and Bio-Based Aniline Sales Market Share in Value by Type (2026-2031)
- Table 21. Global Synthetic and Bio-Based Aniline Sales Volume by Type: 2020 VS 2024 VS 2031 (k Tons)
- Table 22. Global Synthetic and Bio-Based Aniline Sales Volume by Type (2020-2025) & (k Tons)
- Table 23. Global Synthetic and Bio-Based Aniline Sales Volume by Type (2026-2031) & (k Tons)
- Table 24. Global Synthetic and Bio-Based Aniline Sales Volume Market Share by Type (2020-2025)
- Table 25. Global Synthetic and Bio-Based Aniline Sales Volume Market Share by Type (2026-2031)
- Table 26. Global Synthetic and Bio-Based Aniline Price by Type (2020-2025) & (US$/Ton)
- Table 27. Global Synthetic and Bio-Based Aniline Price by Type (2026-2031) & (US$/Ton)
- Table 28. Global Synthetic and Bio-Based Aniline Sales Value by Application: 2020 VS 2024 VS 2031 (million USD)
- Table 29. Global Synthetic and Bio-Based Aniline Sales Value by Application (2020-2025) & (million USD)
- Table 30. Global Synthetic and Bio-Based Aniline Sales Value by Application (2026-2031) & (million USD)
- Table 31. Global Synthetic and Bio-Based Aniline Sales Market Share in Value by Application (2020-2025)
- Table 32. Global Synthetic and Bio-Based Aniline Sales Market Share in Value by Application (2026-2031)
- Table 33. Global Synthetic and Bio-Based Aniline Sales Volume by Application: 2020 VS 2024 VS 2031 (k Tons)
- Table 34. Global Synthetic and Bio-Based Aniline Sales Volume by Application (2020-2025) & (k Tons)
- Table 35. Global Synthetic and Bio-Based Aniline Sales Volume by Application (2026-2031) & (k Tons)
- Table 36. Global Synthetic and Bio-Based Aniline Sales Volume Market Share by Application (2020-2025)
- Table 37. Global Synthetic and Bio-Based Aniline Sales Volume Market Share by Application (2026-2031)
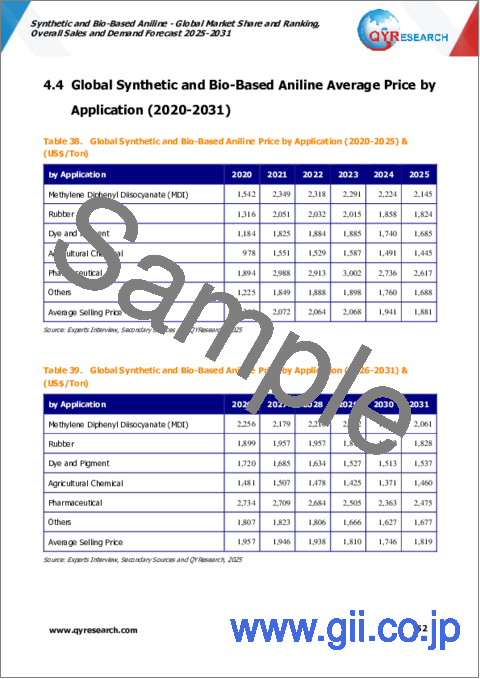
- Table 38. Global Synthetic and Bio-Based Aniline Price by Application (2020-2025) & (US$/Ton)
- Table 39. Global Synthetic and Bio-Based Aniline Price by Application (2026-2031) & (US$/Ton)
- Table 40. Global Synthetic and Bio-Based Aniline Sales Value by Region, (2020 VS 2024 VS 2031) & (million USD)
- Table 41. Global Synthetic and Bio-Based Aniline Sales Value by Region (2020-2025) & (million USD)
- Table 42. Global Synthetic and Bio-Based Aniline Sales Value by Region (2026-2031) & (million USD)
- Table 43. Global Synthetic and Bio-Based Aniline Sales Value by Region (2020-2025) & (%)
- Table 44. Global Synthetic and Bio-Based Aniline Sales Value by Region (2026-2031) & (%)
- Table 45. Global Synthetic and Bio-Based Aniline Sales Volume by Region (k Tons): 2020 VS 2024 VS 2031
- Table 46. Global Synthetic and Bio-Based Aniline Sales Volume by Region (2020-2025) & (k Tons)
- Table 47. Global Synthetic and Bio-Based Aniline Sales Volume by Region (2026-2031) & (k Tons)
- Table 48. Global Synthetic and Bio-Based Aniline Sales Volume by Region (2020-2025) & (%)
- Table 49. Global Synthetic and Bio-Based Aniline Sales Volume by Region (2026-2031) & (%)
- Table 50. Global Synthetic and Bio-Based Aniline Average Price by Region (2020-2025) & (US$/Ton)
- Table 51. Global Synthetic and Bio-Based Aniline Average Price by Region (2026-2031) & (US$/Ton)
- Table 52. Key Countries/Regions Synthetic and Bio-Based Aniline Sales Value Growth Trends, (million USD): 2020 VS 2024 VS 2031
- Table 53. Key Countries/Regions Synthetic and Bio-Based Aniline Sales Value, (2020-2025) & (million USD)
- Table 54. Key Countries/Regions Synthetic and Bio-Based Aniline Sales Value, (2026-2031) & (million USD)
- Table 55. Key Countries/Regions Synthetic and Bio-Based Aniline Sales Volume, (2020-2025) & (k Tons)
- Table 56. Key Countries/Regions Synthetic and Bio-Based Aniline Sales Volume, (2026-2031) & (k Tons)
- Table 57. BASF Company Information
- Table 58. BASF Introduction and Business Overview
- Table 59. BASF Synthetic and Bio-Based Aniline Sales (k Tons), Revenue (million USD), Price (US$/Ton) and Gross Margin (2020-2025)
- Table 60. BASF Synthetic and Bio-Based Aniline Product Offerings
- Table 61. BASF Recent Development
- Table 62. Covestro Company Information
- Table 63. Covestro Introduction and Business Overview
- Table 64. Covestro Synthetic and Bio-Based Aniline Sales (k Tons), Revenue (million USD), Price (US$/Ton) and Gross Margin (2020-2025)
- Table 65. Covestro Synthetic and Bio-Based Aniline Product Offerings
- Table 66. Covestro Recent Development
- Table 67. Wanhua Chemical Company Information
- Table 68. Wanhua Chemical Introduction and Business Overview
- Table 69. Wanhua Chemical Synthetic and Bio-Based Aniline Sales (k Tons), Revenue (million USD), Price (US$/Ton) and Gross Margin (2020-2025)
- Table 70. Wanhua Chemical Synthetic and Bio-Based Aniline Product Offerings
- Table 71. Wanhua Chemical Recent Development
- Table 72. Bondalti Company Information
- Table 73. Bondalti Introduction and Business Overview
- Table 74. Bondalti Synthetic and Bio-Based Aniline Sales (k Tons), Revenue (million USD), Price (US$/Ton) and Gross Margin (2020-2025)
- Table 75. Bondalti Synthetic and Bio-Based Aniline Product Offerings
- Table 76. Lanxess Company Information
- Table 77. Lanxess Introduction and Business Overview
- Table 78. Lanxess Synthetic and Bio-Based Aniline Sales (k Tons), Revenue (million USD), Price (US$/Ton) and Gross Margin (2020-2025)
- Table 79. Lanxess Synthetic and Bio-Based Aniline Product Offerings
- Table 80. Sumitomo Chemical Company Information
- Table 81. Sumitomo Chemical Introduction and Business Overview
- Table 82. Sumitomo Chemical Synthetic and Bio-Based Aniline Sales (k Tons), Revenue (million USD), Price (US$/Ton) and Gross Margin (2020-2025)
- Table 83. Sumitomo Chemical Synthetic and Bio-Based Aniline Product Offerings
- Table 84. San Fu Chemical Company Information
- Table 85. San Fu Chemical Introduction and Business Overview
- Table 86. San Fu Chemical Synthetic and Bio-Based Aniline Sales (k Tons), Revenue (million USD), Price (US$/Ton) and Gross Margin (2020-2025)
- Table 87. San Fu Chemical Synthetic and Bio-Based Aniline Product Offerings
- Table 88. Shandong Jinling Group Company Information
- Table 89. Shandong Jinling Group Introduction and Business Overview
- Table 90. Shandong Jinling Group Synthetic and Bio-Based Aniline Sales (k Tons), Revenue (million USD), Price (US$/Ton) and Gross Margin (2020-2025)
- Table 91. Shandong Jinling Group Synthetic and Bio-Based Aniline Product Offerings
- Table 92. Connell Chemical Company Information
- Table 93. Connell Chemical Introduction and Business Overview
- Table 94. Connell Chemical Synthetic and Bio-Based Aniline Sales (k Tons), Revenue (million USD), Price (US$/Ton) and Gross Margin (2020-2025)
- Table 95. Connell Chemical Synthetic and Bio-Based Aniline Product Offerings
- Table 96. Connell Chemical Recent Development
- Table 97. Sinopec Company Information
- Table 98. Sinopec Introduction and Business Overview
- Table 99. Sinopec Synthetic and Bio-Based Aniline Sales (k Tons), Revenue (million USD), Price (US$/Ton) and Gross Margin (2020-2025)
- Table 100. Sinopec Synthetic and Bio-Based Aniline Product Offerings
- Table 101. Sinopec Recent Development
- Table 102. Sinochem Group Company Information
- Table 103. Sinochem Group Introduction and Business Overview
- Table 104. Sinochem Group Synthetic and Bio-Based Aniline Sales (k Tons), Revenue (million USD), Price (US$/Ton) and Gross Margin (2020-2025)
- Table 105. Sinochem Group Synthetic and Bio-Based Aniline Product Offerings
- Table 106. Chongqing Changfeng Chemical Company Information
- Table 107. Chongqing Changfeng Chemical Introduction and Business Overview
- Table 108. Chongqing Changfeng Chemical Synthetic and Bio-Based Aniline Sales (k Tons), Revenue (million USD), Price (US$/Ton) and Gross Margin (2020-2025)
- Table 109. Chongqing Changfeng Chemical Synthetic and Bio-Based Aniline Product Offerings
- Table 110. Shandong Hangda Chemical Company Information
- Table 111. Shandong Hangda Chemical Introduction and Business Overview
- Table 112. Shandong Hangda Chemical Synthetic and Bio-Based Aniline Sales (k Tons), Revenue (million USD), Price (US$/Ton) and Gross Margin (2020-2025)
- Table 113. Shandong Hangda Chemical Synthetic and Bio-Based Aniline Product Offerings
- Table 114. Key Raw Materials Lists
- Table 115. Raw Materials Key Suppliers Lists
- Table 116. Synthetic and Bio-Based Aniline Downstream Customers
- Table 117. Synthetic and Bio-Based Aniline Distributors List
- Table 118. Research Programs/Design for This Report
- Table 119. Key Data Information from Secondary Sources
- Table 120. Key Data Information from Primary Sources
List of Figures
- Figure 1. Synthetic and Bio-Based Aniline Product Picture
- Figure 2. Global Synthetic and Bio-Based Aniline Sales Value, 2020 VS 2025 VS 2031 (million USD)
- Figure 3. Global Synthetic and Bio-Based Aniline Sales Value (2020-2031) & (million USD)
- Figure 4. Global Synthetic and Bio-Based Aniline Sales Volume (2020-2031) & (k Tons)
- Figure 5. Global Synthetic and Bio-Based Aniline Sales Price (2020-2031) & (US$/Ton)
- Figure 6. Synthetic and Bio-Based Aniline Report Years Considered
- Figure 7. Global Synthetic and Bio-Based Aniline Players Revenue Ranking (2024) & (million USD)
- Figure 8. Global Synthetic and Bio-Based Aniline Players Sales Volume Ranking (2024) & (k Tons)
- Figure 9. The 5 and 10 Largest Manufacturers in the World: Market Share by Synthetic and Bio-Based Aniline Revenue in 2024
- Figure 10. Synthetic and Bio-Based Aniline Market Share by Company Type (Tier 1, Tier 2, and Tier 3): 2020 VS 2024
- Figure 11. Synthetic Aniline Picture (Flow chart of nitrobenzene liquid-phase catalytic hydrogenation reaction experimental device)
- Figure 12. Bio-Based Aniline Picture (Flow chart)
- Figure 13. Global Synthetic and Bio-Based Aniline Sales Value by Type (2020 VS 2024 VS 2031) & (million USD)
- Figure 14. Global Synthetic and Bio-Based Aniline Sales Value Market Share by Type, 2024 & 2031
- Figure 15. Global Synthetic and Bio-Based Aniline Sales Volume by Type (2020 VS 2024 VS 2031) & (k Tons)
- Figure 16. Global Synthetic and Bio-Based Aniline Sales Volume Market Share by Type, 2024 & 2031
- Figure 17. Global Synthetic and Bio-Based Aniline Price by Type (2020-2031) & (US$/Ton)
- Figure 18. Product Picture of Methylene Diphenyl Diisocyanate (MDI)
- Figure 19. Product Picture of Rubber Additive
- Figure 20. Product Picture of Dye and Pigment
- Figure 21. Product Picture of Agricultural Chemical
- Figure 22. Product Picture of Pharmaceutical
- Figure 23. Picture of Polyaniline
- Figure 24. Global Synthetic and Bio-Based Aniline Sales Value by Application (2020 VS 2024 VS 2031) & (million USD)
- Figure 25. Global Synthetic and Bio-Based Aniline Sales Value Market Share by Application, 2024 & 2031
- Figure 26. Global Synthetic and Bio-Based Aniline Sales Volume by Application (2020 VS 2024 VS 2031) & (k Tons)
- Figure 27. Global Synthetic and Bio-Based Aniline Sales Volume Market Share by Application, 2024 & 2031
- Figure 28. Global Synthetic and Bio-Based Aniline Price by Application (2020-2031) & (US$/Ton)
- Figure 29. North America Synthetic and Bio-Based Aniline Sales Value (2020-2031) & (million USD)
- Figure 30. North America Synthetic and Bio-Based Aniline Sales Value by Country (%), 2024 VS 2031
- Figure 31. Europe Synthetic and Bio-Based Aniline Sales Value, (2020-2031) & (million USD)
- Figure 32. Europe Synthetic and Bio-Based Aniline Sales Value by Country (%), 2024 VS 2031
- Figure 33. Asia Pacific Synthetic and Bio-Based Aniline Sales Value, (2020-2031) & (million USD)
- Figure 34. Asia Pacific Synthetic and Bio-Based Aniline Sales Value by Region (%), 2024 VS 2031
- Figure 35. Latin America Synthetic and Bio-Based Aniline Sales Value, (2020-2031) & (million USD)
- Figure 36. Latin America Synthetic and Bio-Based Aniline Sales Value by Country (%), 2024 VS 2031
- Figure 37. Middle East & Africa Synthetic and Bio-Based Aniline Sales Value, (2020-2031) & (million USD)
- Figure 38. Middle East & Africa Synthetic and Bio-Based Aniline Sales Value by Country (%), 2024 VS 2031
- Figure 39. Key Countries/Regions Synthetic and Bio-Based Aniline Sales Value (%), (2020-2031)
- Figure 40. Key Countries/Regions Synthetic and Bio-Based Aniline Sales Volume (%), (2020-2031)
- Figure 41. United States Synthetic and Bio-Based Aniline Sales Value, (2020-2031) & (million USD)
- Figure 42. United States Synthetic and Bio-Based Aniline Sales Value by Type (%), 2024 VS 2031
- Figure 43. United States Synthetic and Bio-Based Aniline Sales Value by Application (%), 2024 VS 2031
- Figure 44. Europe Synthetic and Bio-Based Aniline Sales Value, (2020-2031) & (million USD)
- Figure 45. Europe Synthetic and Bio-Based Aniline Sales Value by Type (%), 2024 VS 2031
- Figure 46. Europe Synthetic and Bio-Based Aniline Sales Value by Application (%), 2024 VS 2031
- Figure 47. China Synthetic and Bio-Based Aniline Sales Value, (2020-2031) & (million USD)
- Figure 48. China Synthetic and Bio-Based Aniline Sales Value by Type (%), 2024 VS 2031
- Figure 49. China Synthetic and Bio-Based Aniline Sales Value by Application (%), 2024 VS 2031
- Figure 50. Japan Synthetic and Bio-Based Aniline Sales Value, (2020-2031) & (million USD)
- Figure 51. Japan Synthetic and Bio-Based Aniline Sales Value by Type (%), 2024 VS 2031
- Figure 52. Japan Synthetic and Bio-Based Aniline Sales Value by Application (%), 2024 VS 2031
- Figure 53. South Korea Synthetic and Bio-Based Aniline Sales Value, (2020-2031) & (million USD)
- Figure 54. South Korea Synthetic and Bio-Based Aniline Sales Value by Type (%), 2024 VS 2031
- Figure 55. South Korea Synthetic and Bio-Based Aniline Sales Value by Application (%), 2024 VS 2031
- Figure 56. Southeast Asia Synthetic and Bio-Based Aniline Sales Value, (2020-2031) & (million USD)
- Figure 57. Southeast Asia Synthetic and Bio-Based Aniline Sales Value by Type (%), 2024 VS 2031
- Figure 58. Southeast Asia Synthetic and Bio-Based Aniline Sales Value by Application (%), 2024 VS 2031
- Figure 59. India Synthetic and Bio-Based Aniline Sales Value, (2020-2031) & (million USD)
- Figure 60. India Synthetic and Bio-Based Aniline Sales Value by Type (%), 2024 VS 2031
- Figure 61. India Synthetic and Bio-Based Aniline Sales Value by Application (%), 2024 VS 2031
- Figure 62. Synthetic and Bio-Based Aniline Industrial Chain
- Figure 63. Synthetic and Bio-Based Aniline Production Comparison
- Figure 64. Synthetic and Bio-Based Aniline Manufacturing Cost Structure in 2025
- Figure 65. Channels of Distribution (Direct Sales, and Distribution)
- Figure 66. Bottom-up and Top-down Approaches for This Report
- Figure 67. Data Triangulation
- Figure 68. Key Executives Interviewed
Global Synthetic and Bio-Based Aniline market size in terms of revenue is projected to reach 17,247.20 million USD by 2031 from 11,935.06 million USD in 2024, with a CAGR 5.60% during 2025-2031.
North America market for Synthetic and Bio-Based Aniline is estimated to increase from 2,250.19 million USD in 2024 to reach 2,796.70 million USD by 2031, at a CAGR of 5.34% during the forecast period of 2025 through 2031.
Europe market for Synthetic and Bio-Based Aniline is estimated to increase from 3,066.40 million USD in 2024 to reach 4,337.68 million USD by 2031, at a CAGR of 5.67% during the forecast period of 2025 through 2031.
Asia-Pacific market for Synthetic and Bio-Based Aniline is estimated to increase from 5,987.92 million USD in 2024 to reach 9,215.52 million USD by 2031, at a CAGR of 5.75% during the forecast period of 2025 through 2031.
The major global manufacturers of Synthetic and Bio-Based Aniline include BASF, Covestro, Wanhua Chemical, Bondalti, Lanxess, Sumitomo Chemical, San Fu Chemical, Shandong Jinling Group, Jilin Connell Chemical, Sinopec, etc. In 2024, the world's top five vendors accounted for approximately 72.04% of the revenue. Huntsman's Aniline is primarily used as a chemical intermediate to manufacture MDI and MDI- based products for their own, not marketed directly for consumer use.
This report aims to provide a comprehensive presentation of the global market for Synthetic and Bio-Based Aniline, focusing on the total sales volume, sales revenue, price, key companies market share and ranking, together with an analysis of Synthetic and Bio-Based Aniline by region & country, by Type, and by Application.
The Synthetic and Bio-Based Aniline market size, estimations, and forecasts are provided in terms of sales volume (k Tons) and sales revenue ($ millions), considering 2024 as the base year, with history and forecast data for the period from 2020 to 2031. With both quantitative and qualitative analysis, to help readers develop business/growth strategies, assess the market competitive situation, analyze their position in the current marketplace, and make informed business decisions regarding Synthetic and Bio-Based Aniline.
Market Segmentation
By Company
- BASF
- Covestro
- Wanhua Chemical
- Bondalti
- Lanxess
- Sumitomo Chemical
- San Fu Chemical
- Shandong Jinling Group
- Jilin Connell Chemical
- Sinopec
- Sinochem Group
- Chongqing Changfeng Chemical
- Shandong Hangda Chemical
Segment by Type
- Synthetic Aniline (Petroleum-based)
- Bio-based Aniline
Segment by Application
- Methylene Diphenyl Diisocyanate (MDI)
- Rubber
- Dye and Pigment
- Agricultural Chemical
- Pharmaceutical
- Others
By Region
- North America
- United States
- Canada
- Asia-Pacific
- China
- Japan
- South Korea
- Southeast Asia
- India
- Australia
- Rest of Asia-Pacific
- Europe
- Germany
- France
- U.K.
- Italy
- Russia
- Rest of Europe
- Latin America
- Mexico
- Brazil
- Rest of Latin America
- Middle East & Africa
- Saudi Arabia
- UAE
- Egypt
- South Africa
- Rest of MEA
Chapter Outline
Chapter 1: Introduces the report scope of the report, global total market size (valve, volume and price). This chapter also provides the market dynamics, latest developments of the market, the driving factors and restrictive factors of the market, the challenges and risks faced by manufacturers in the industry, and the analysis of relevant policies in the industry.
Chapter 2: Detailed analysis of Synthetic and Bio-Based Aniline manufacturers competitive landscape, price, sales and revenue market share, latest development plan, merger, and acquisition information, etc.
Chapter 3: Provides the analysis of various market segments by Type, covering the market size and development potential of each market segment, to help readers find the blue ocean market in different market segments.
Chapter 4: Provides the analysis of various market segments by Application, covering the market size and development potential of each market segment, to help readers find the blue ocean market in different downstream markets.
Chapter 5: Sales, revenue of Synthetic and Bio-Based Aniline in regional level. It provides a quantitative analysis of the market size and development potential of each region and introduces the market development, future development prospects, market space, and market size of each country in the world.
Chapter 6: Sales, revenue of Synthetic and Bio-Based Aniline in country level. It provides sigmate data by Type, and by Application for each country/region.
Chapter 7: Provides profiles of key players, introducing the basic situation of the main companies in the market in detail, including product sales, revenue, price, gross margin, product introduction, recent development, etc.
Chapter 8: Analysis of industrial chain, including the upstream and downstream of the industry.
Chapter 9: Conclusion.
Table of Contents
1 Market Overview
- 1.1 Synthetic and Bio-Based Aniline Product Introduction
- 1.2 Global Synthetic and Bio-Based Aniline Market Size Forecast
- 1.2.1 Global Synthetic and Bio-Based Aniline Sales Value (2020-2031)
- 1.2.2 Global Synthetic and Bio-Based Aniline Sales Volume (2020-2031)
- 1.2.3 Global Synthetic and Bio-Based Aniline Sales Price (2020-2031)
- 1.3 Synthetic and Bio-Based Aniline Market Trends & Drivers
- 1.3.1 Synthetic and Bio-Based Aniline Industry Trends
- 1.3.2 Synthetic and Bio-Based Aniline Market Drivers & Opportunity
- 1.3.3 Synthetic and Bio-Based Aniline Market Challenges
- 1.3.4 Synthetic and Bio-Based Aniline Market Restraints
- 1.4 Assumptions and Limitations
- 1.5 Study Objectives
- 1.6 Years Considered
2 Competitive Analysis by Company
- 2.1 Global Synthetic and Bio-Based Aniline Players Revenue Ranking (2024)
- 2.2 Global Synthetic and Bio-Based Aniline Revenue by Company (2020-2025)
- 2.3 Global Synthetic and Bio-Based Aniline Players Sales Volume Ranking (2024)
- 2.4 Global Synthetic and Bio-Based Aniline Sales Volume by Company Players (2020-2025)
- 2.5 Global Synthetic and Bio-Based Aniline Average Price by Company (2020-2025)
- 2.6 Key Manufacturers Synthetic and Bio-Based Aniline Manufacturing Base and Headquarters
- 2.7 Key Manufacturers Synthetic and Bio-Based Aniline Product Offered
- 2.8 Key Manufacturers of Synthetic and Bio-Based Aniline, Founding Date
- 2.9 Synthetic and Bio-Based Aniline Market Competitive Analysis
- 2.9.1 Synthetic and Bio-Based Aniline Market Concentration Rate (2020-2025)
- 2.9.2 Global 5 and 10 Largest Manufacturers by Synthetic and Bio-Based Aniline Revenue in 2024
- 2.9.3 Global Top Manufacturers by Company Type (Tier 1, Tier 2, and Tier 3) & (based on the Revenue in Synthetic and Bio-Based Aniline as of 2024)
- 2.10 Mergers & Acquisitions, Expansion
3 Segmentation by Type
- 3.1 Introduction by Type
- 3.1.1 Synthetic Aniline (Petroleum-based)
- 3.1.2 Bio-Based Aniline
- 3.2 Global Synthetic and Bio-Based Aniline Sales Value by Type
- 3.2.1 Global Synthetic and Bio-Based Aniline Sales Value by Type (2020 VS 2024 VS 2031)
- 3.2.2 Global Synthetic and Bio-Based Aniline Sales Value, by Type (2020-2031)
- 3.2.3 Global Synthetic and Bio-Based Aniline Sales Value, by Type (%) (2020-2031)
- 3.3 Global Synthetic and Bio-Based Aniline Sales Volume by Type
- 3.3.1 Global Synthetic and Bio-Based Aniline Sales Volume by Type (2020 VS 2024 VS 2031)
- 3.3.2 Global Synthetic and Bio-Based Aniline Sales Volume, by Type (2020-2031)
- 3.3.3 Global Synthetic and Bio-Based Aniline Sales Volume, by Type (%) (2020-2031)
- 3.4 Global Synthetic and Bio-Based Aniline Average Price by Type (2020-2031)
4 Segmentation by Application
- 4.1 Introduction by Application
- 4.1.1 Methylene Diphenyl Diisocyanate (MDI)
- 4.1.2 Rubber
- 4.1.3 Dye and Pigment
- 4.1.4 Agricultural Chemical
- 4.1.5 Pharmaceutical
- 4.1.6 Others
- 4.2 Global Synthetic and Bio-Based Aniline Sales Value by Application
- 4.2.1 Global Synthetic and Bio-Based Aniline Sales Value by Application (2020 VS 2024 VS 2031)
- 4.2.2 Global Synthetic and Bio-Based Aniline Sales Value, by Application (2020-2031)
- 4.2.3 Global Synthetic and Bio-Based Aniline Sales Value, by Application (%) (2020-2031)
- 4.3 Global Synthetic and Bio-Based Aniline Sales Volume by Application
- 4.3.1 Global Synthetic and Bio-Based Aniline Sales Volume by Application (2020 VS 2024 VS 2031)
- 4.3.2 Global Synthetic and Bio-Based Aniline Sales Volume, by Application (2020-2031)
- 4.3.3 Global Synthetic and Bio-Based Aniline Sales Volume, by Application (%) (2020-2031)
- 4.4 Global Synthetic and Bio-Based Aniline Average Price by Application (2020-2031)
5 Segmentation by Region
- 5.1 Global Synthetic and Bio-Based Aniline Sales Value by Region
- 5.1.1 Global Synthetic and Bio-Based Aniline Sales Value by Region: 2020 VS 2024 VS 2031
- 5.1.2 Global Synthetic and Bio-Based Aniline Sales Value by Region (2020-2025)
- 5.1.3 Global Synthetic and Bio-Based Aniline Sales Value by Region (2026-2031)
- 5.1.4 Global Synthetic and Bio-Based Aniline Sales Value by Region (%), (2020-2031)
- 5.2 Global Synthetic and Bio-Based Aniline Sales Volume by Region
- 5.2.1 Global Synthetic and Bio-Based Aniline Sales Volume by Region: 2020 VS 2024 VS 2031
- 5.2.2 Global Synthetic and Bio-Based Aniline Sales Volume by Region (2020-2025)
- 5.2.3 Global Synthetic and Bio-Based Aniline Sales Volume by Region (2026-2031)
- 5.2.4 Global Synthetic and Bio-Based Aniline Sales Volume by Region (%), (2020-2031)
- 5.3 Global Synthetic and Bio-Based Aniline Average Price by Region (2020-2031)
- 5.4 North America
- 5.4.1 North America Synthetic and Bio-Based Aniline Sales Value, 2020-2031
- 5.4.2 North America Synthetic and Bio-Based Aniline Sales Value by Country (%), 2024 VS 2031
- 5.5 Europe
- 5.5.1 Europe Synthetic and Bio-Based Aniline Sales Value, 2020-2031
- 5.5.2 Europe Synthetic and Bio-Based Aniline Sales Value by Country (%), 2024 VS 2031
- 5.6 Asia Pacific
- 5.6.1 Asia Pacific Synthetic and Bio-Based Aniline Sales Value, 2020-2031
- 5.6.2 Asia Pacific Synthetic and Bio-Based Aniline Sales Value by Region (%), 2024 VS 2031
- 5.7 Latin America
- 5.7.1 Latin America Synthetic and Bio-Based Aniline Sales Value, 2020-2031
- 5.7.2 Latin America Synthetic and Bio-Based Aniline Sales Value by Country (%), 2024 VS 2031
- 5.8 Middle East & Africa
- 5.8.1 Middle East & Africa Synthetic and Bio-Based Aniline Sales Value, 2020-2031
- 5.8.2 Middle East & Africa Synthetic and Bio-Based Aniline Sales Value by Country (%), 2024 VS 2031
6 Segmentation by Key Countries/Regions
- 6.1 Key Countries/Regions Synthetic and Bio-Based Aniline Sales Value Growth Trends, 2020 VS 2024 VS 2031
- 6.2 Key Countries/Regions Synthetic and Bio-Based Aniline Sales Value and Sales Volume
- 6.2.1 Key Countries/Regions Synthetic and Bio-Based Aniline Sales Value, 2020-2031
- 6.2.2 Key Countries/Regions Synthetic and Bio-Based Aniline Sales Volume, 2020-2031
- 6.3 United States
- 6.3.1 United States Synthetic and Bio-Based Aniline Sales Value, 2020-2031
- 6.3.2 United States Synthetic and Bio-Based Aniline Sales Value by Type (%), 2024 VS 2031
- 6.3.3 United States Synthetic and Bio-Based Aniline Sales Value by Application, 2024 VS 2031
- 6.4 Europe
- 6.4.1 Europe Synthetic and Bio-Based Aniline Sales Value, 2020-2031
- 6.4.2 Europe Synthetic and Bio-Based Aniline Sales Value by Type (%), 2024 VS 2031
- 6.4.3 Europe Synthetic and Bio-Based Aniline Sales Value by Application, 2024 VS 2031
- 6.5 China
- 6.5.1 China Synthetic and Bio-Based Aniline Sales Value, 2020-2031
- 6.5.2 China Synthetic and Bio-Based Aniline Sales Value by Type (%), 2024 VS 2031
- 6.5.3 China Synthetic and Bio-Based Aniline Sales Value by Application, 2024 VS 2031
- 6.6 Japan
- 6.6.1 Japan Synthetic and Bio-Based Aniline Sales Value, 2020-2031
- 6.6.2 Japan Synthetic and Bio-Based Aniline Sales Value by Type (%), 2024 VS 2031
- 6.6.3 Japan Synthetic and Bio-Based Aniline Sales Value by Application, 2024 VS 2031
- 6.7 South Korea
- 6.7.1 South Korea Synthetic and Bio-Based Aniline Sales Value, 2020-2031
- 6.7.2 South Korea Synthetic and Bio-Based Aniline Sales Value by Type (%), 2024 VS 2031
- 6.7.3 South Korea Synthetic and Bio-Based Aniline Sales Value by Application, 2024 VS 2031
- 6.8 Southeast Asia
- 6.8.1 Southeast Asia Synthetic and Bio-Based Aniline Sales Value, 2020-2031
- 6.8.2 Southeast Asia Synthetic and Bio-Based Aniline Sales Value by Type (%), 2024 VS 2031
- 6.8.3 Southeast Asia Synthetic and Bio-Based Aniline Sales Value by Application, 2024 VS 2031
- 6.9 India
- 6.9.1 India Synthetic and Bio-Based Aniline Sales Value, 2020-2031
- 6.9.2 India Synthetic and Bio-Based Aniline Sales Value by Type (%), 2024 VS 2031
- 6.9.3 India Synthetic and Bio-Based Aniline Sales Value by Application, 2024 VS 2031
7 Company Profiles
- 7.1 BASF
- 7.1.1 BASF Company Information
- 7.1.2 BASF Introduction and Business Overview
- 7.1.3 BASF Synthetic and Bio-Based Aniline Sales, Revenue, Price and Gross Margin (2020-2025)
- 7.1.4 BASF Synthetic and Bio-Based Aniline Product Offerings
- 7.1.5 BASF Recent Development
- 7.2 Covestro
- 7.2.1 Covestro Company Information
- 7.2.2 Covestro Introduction and Business Overview
- 7.2.3 Covestro Synthetic and Bio-Based Aniline Sales, Revenue, Price and Gross Margin (2020-2025)
- 7.2.4 Covestro Synthetic and Bio-Based Aniline Product Offerings
- 7.2.5 Covestro Recent Development
- 7.3 Wanhua Chemical
- 7.3.1 Wanhua Chemical Company Information
- 7.3.2 Wanhua Chemical Introduction and Business Overview
- 7.3.3 Wanhua Chemical Synthetic and Bio-Based Aniline Sales, Revenue, Price and Gross Margin (2020-2025)
- 7.3.4 Wanhua Chemical Synthetic and Bio-Based Aniline Product Offerings
- 7.3.5 Wanhua Chemical Recent Development
- 7.4 Bondalti
- 7.4.1 Bondalti Company Information
- 7.4.2 Bondalti Introduction and Business Overview
- 7.4.3 Bondalti Synthetic and Bio-Based Aniline Sales, Revenue, Price and Gross Margin (2020-2025)
- 7.4.4 Bondalti Synthetic and Bio-Based Aniline Product Offerings
- 7.5 Lanxess
- 7.5.1 Lanxess Company Information
- 7.5.2 Lanxess Introduction and Business Overview
- 7.5.3 Lanxess Synthetic and Bio-Based Aniline Sales, Revenue, Price and Gross Margin (2020-2025)
- 7.5.4 Lanxess Synthetic and Bio-Based Aniline Product Offerings
- 7.6 Sumitomo Chemical
- 7.6.1 Sumitomo Chemical Company Information
- 7.6.2 Sumitomo Chemical Introduction and Business Overview
- 7.6.3 Sumitomo Chemical Synthetic and Bio-Based Aniline Sales, Revenue, Price and Gross Margin (2020-2025)
- 7.6.4 Sumitomo Chemical Synthetic and Bio-Based Aniline Product Offerings
- 7.7 San Fu Chemical
- 7.7.1 San Fu Chemical Company Information
- 7.7.2 San Fu Chemical Introduction and Business Overview
- 7.7.3 San Fu Chemical Synthetic and Bio-Based Aniline Sales, Revenue, Price and Gross Margin (2020-2025)
- 7.7.4 San Fu Chemical Synthetic and Bio-Based Aniline Product Offerings
- 7.8 Shandong Jinling Group
- 7.8.1 Shandong Jinling Group Company Information
- 7.8.2 Shandong Jinling Group Introduction and Business Overview
- 7.8.3 Shandong Jinling Group Synthetic and Bio-Based Aniline Sales, Revenue, Price and Gross Margin (2020-2025)
- 7.8.4 Shandong Jinling Group Synthetic and Bio-Based Aniline Product Offerings
- 7.9 Connell Chemical
- 7.9.1 Connell Chemical Company Information
- 7.9.2 Connell Chemical Introduction and Business Overview
- 7.9.3 Connell Chemical Synthetic and Bio-Based Aniline Sales, Revenue, Price and Gross Margin (2020-2025)
- 7.9.4 Connell Chemical Synthetic and Bio-Based Aniline Product Offerings
- 7.9.5 Connell Chemical Recent Development
- 7.10 Sinopec
- 7.10.1 Sinopec Company Information
- 7.10.2 Sinopec Introduction and Business Overview
- 7.10.3 Sinopec Synthetic and Bio-Based Aniline Sales, Revenue, Price and Gross Margin (2020-2025)
- 7.10.4 Sinopec Synthetic and Bio-Based Aniline Product Offerings
- 7.10.5 Sinopec Recent Development
- 7.11 Sinochem Group
- 7.11.1 Sinochem Group Company Information
- 7.11.2 Sinochem Group Introduction and Business Overview
- 7.11.3 Sinochem Group Synthetic and Bio-Based Aniline Sales, Revenue, Price and Gross Margin (2020-2025)
- 7.11.4 Sinochem Group Synthetic and Bio-Based Aniline Product Offerings
- 7.12 Chongqing Changfeng Chemical
- 7.12.1 Chongqing Changfeng Chemical Company Information
- 7.12.2 Chongqing Changfeng Chemical Introduction and Business Overview
- 7.12.3 Chongqing Changfeng Chemical Synthetic and Bio-Based Aniline Sales, Revenue, Price and Gross Margin (2020-2025)
- 7.12.4 Chongqing Changfeng Chemical Synthetic and Bio-Based Aniline Product Offerings
- 7.13 Shandong Hangda Chemical
- 7.13.1 Shandong Hangda Chemical Company Information
- 7.13.2 Shandong Hangda Chemical Introduction and Business Overview
- 7.13.3 Shandong Hangda Chemical Synthetic and Bio-Based Aniline Sales, Revenue, Price and Gross Margin (2020-2025)
- 7.13.4 Shandong Hangda Chemical Synthetic and Bio-Based Aniline Product Offerings
8 Industry Chain Analysis
- 8.1 Synthetic and Bio-Based Aniline Industrial Chain
- 8.2 Synthetic and Bio-Based Aniline Upstream Analysis
- 8.2.1 Key Raw Materials
- 8.2.2 Raw Materials Key Suppliers
- 8.2.3 Manufacturing Cost Structure
- 8.3 Midstream Analysis
- 8.4 Downstream Analysis (Customers Analysis)
- 8.5 Sales Model and Sales Channels
- 8.5.1 Synthetic and Bio-Based Aniline Sales Model
- 8.5.2 Sales Channel
- 8.5.3 Synthetic and Bio-Based Aniline Distributors
9 Research Findings and Conclusion
10 Appendix
- 10.1 Research Methodology
- 10.1.1 Methodology/Research Approach
- 10.1.2 Data Source
- 10.2 Author Details
- 10.3 Disclaimer
