|
|
市場調査レポート
商品コード
1861353
ニオブ酸リチウム単結晶:世界市場シェアとランキング、総売上高および需要予測(2025年~2031年)Lithium Niobate Single Crystal - Global Market Share and Ranking, Overall Sales and Demand Forecast 2025-2031 |
||||||
|
|||||||
カスタマイズ可能
適宜更新あり
|
|||||||

| ニオブ酸リチウム単結晶:世界市場シェアとランキング、総売上高および需要予測(2025年~2031年) |
|
出版日: 2025年10月15日
発行: QYResearch
ページ情報: 英文 97 Pages
納期: 2~3営業日
|

概要
世界のニオブ酸リチウム単結晶市場は、2024年に1億9,700万米ドルと推定され、2025年から2031年の予測期間中にCAGR 10.6%で成長し、2031年までに3億8,600万米ドルに拡大すると予測されています。
本報告書は、ニオブ酸リチウム単結晶の越境産業フットプリント、資本配分パターン、地域経済の相互依存性、サプライチェーンの再構築に関する、最近の関税調整と国際的な戦略的対抗措置について包括的な評価を提供します。
ニオブ酸リチウム(LiNbO3)、略称LNは、リチウム、ニオブ、酸素からなる合成塩です。その物理的特性のユニークな組み合わせにより、単結晶形態で特に価値が高く、様々な技術応用において重要な材料となっています。
2024年、世界のニオブ酸リチウム単結晶の販売量は約430万ユニットに達し、世界平均市場価格は1ユニットあたり約46米ドルでした。
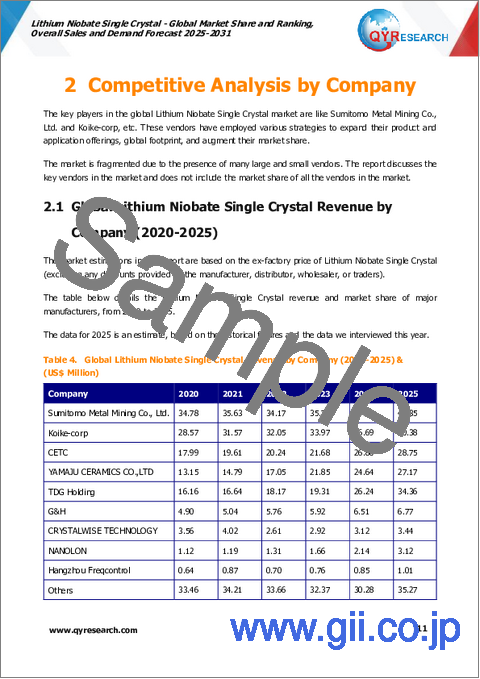
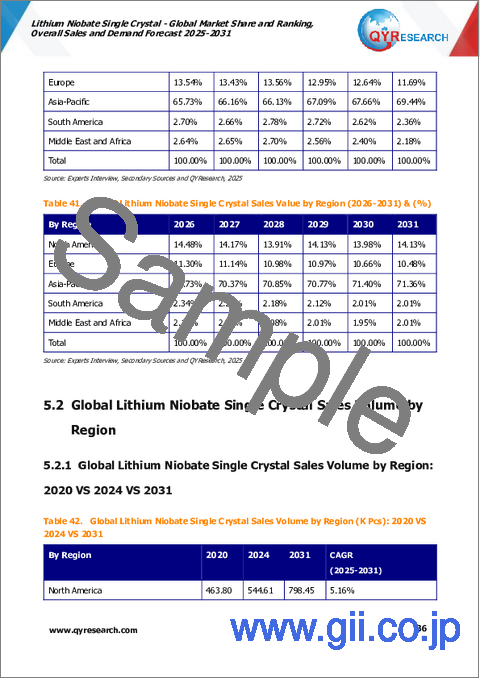
ニオブ酸リチウム単結晶の世界的な主要メーカーには、Koike-Corp, Sumitomo Metal Mining Co., Ltd., CETCなどが挙げられます。上位5社のシェアは75%を超えています。アジア太平洋が最大の市場で、約66%のシェアを占め、次いで欧州、北米がそれぞれ15%のシェアを有しています。製品タイプ別では、4インチ以下が最大のセグメントであり、82%のシェアを占めています。
世界のニオブ酸リチウム市場は、その独自の電気光学特性、非線形光学特性、圧電特性に支えられ、強力な成長可能性を示しております。これらの特性により、同材料は以下のような高付加価値産業において不可欠な存在となっております:・通信分野:高速変調器や集積フォトニック回路の基盤として活用・量子技術分野:低損失・高安定性性能が新興の量子通信・量子コンピューティングデバイスを支える・高度なセンシング技術分野:安定した効率的な導波管を必要とするLiDARや精密測定システムに適用・医療画像診断およびレーザー応用分野:非線形光学特性により周波数倍増やその他の波長変換を実現・民生用電子機器分野:基板材料として表面処理に活用高度なセンシング分野(LiDARや精密測定システムなど、安定かつ効率的な導波路を必要とする用途)、医療画像診断やレーザー応用分野(非線形光学特性による周波数倍増や波長変換を実現)、民生用電子機器分野(スマートフォンやRFシステム向けフィルタに使用される表面弾性波(SAW)デバイスの基板として)など、幅広い産業で不可欠な存在です。5G、6G、クラウドコンピューティング、データセンターへの継続的な投資により、需要は急速に拡大する見込みです。また、米国、欧州、中国、日本における政府資金によるプログラムが、ニオブ酸リチウムフォトニクスの商用化を加速させています。同時に、結晶成長技術の進歩によりコスト削減と品質向上が図られており、ニッチな高性能分野を超え、主流の集積光学素子や産業システムへの普及が促進されています。これにより、ニオブ酸リチウム単結晶は、次世代フォトニクス革新とグローバルデジタルインフラにおける基幹材料としての地位を維持すると考えられます。
本レポートは、ニオブ酸リチウム単結晶の世界市場について、総販売数量、売上高、価格、主要企業の市場シェアおよび順位に焦点を当て、地域・国別、タイプ別、用途別の分析を包括的に提示することを目的としております。
本報告書では、2024年を基準年とし、2020年から2031年までの過去データと予測データに基づき、販売数量(千個)および売上高(百万米ドル)の観点から、ニオブ酸リチウム単結晶の市場規模、推定・予測を提供しております。定量的・定性的分析の両面から、読者の皆様がニオブ酸リチウム単結晶に関する事業戦略・成長戦略の策定、市場競争の評価、現在のマーケットプレースにおける自社の位置付けの分析、情報に基づいた事業判断を行うお手伝いをいたします。
市場セグメンテーション
企業別
- Sumitomo Metal Mining Co., Ltd.
- Koike-corp
- CETC
- YAMAJU CERAMICS CO.,LTD
- TDG Holding
- G&H
- CRYSTALWISE TECHNOLOGY
- NANOLON
- Hangzhou Freqcontrol
タイプ別セグメント
- 4インチ未満
- 6~8インチ
用途別セグメント
- 表面弾性波
- 電気光学
- 光モジュール
- その他
地域別
- 北米
- 米国
- カナダ
- アジア太平洋
- 中国
- 日本
- 韓国
- 東南アジア
- インド
- オーストラリア
- その他アジア太平洋地域
- 欧州
- ドイツ
- フランス
- 英国
- イタリア
- オランダ
- 北欧諸国
- その他欧州
- ラテンアメリカ
- メキシコ
- ブラジル
- その他ラテンアメリカ
- 中東・アフリカ
- トルコ
- サウジアラビア
- アラブ首長国連邦
- その他中東・アフリカ

