|
|
市場調査レポート
商品コード
1609541
半導体向けレイズドフロアの世界市場 - 市場シェアとランキング、全体の売上と需要の予測(2024年~2030年)Raised Floor for Semiconductor - Global Market Share and Ranking, Overall Sales and Demand Forecast 2024-2030 |
||||||
|
|||||||
カスタマイズ可能
適宜更新あり
|
|||||||

| 半導体向けレイズドフロアの世界市場 - 市場シェアとランキング、全体の売上と需要の予測(2024年~2030年) |
|
出版日: 2024年12月11日
発行: QYResearch
ページ情報: 英文 167 Pages
納期: 2~3営業日
|

全表示
- 概要
- 図表
- 目次
世界の半導体向けレイズドフロアの市場規模は、2023年に5億6,650万米ドルであり、2030年までに11億263万米ドルに達すると予測され、予測期間の2024年~2030年にCAGRで8.18%の成長が見込まれます。
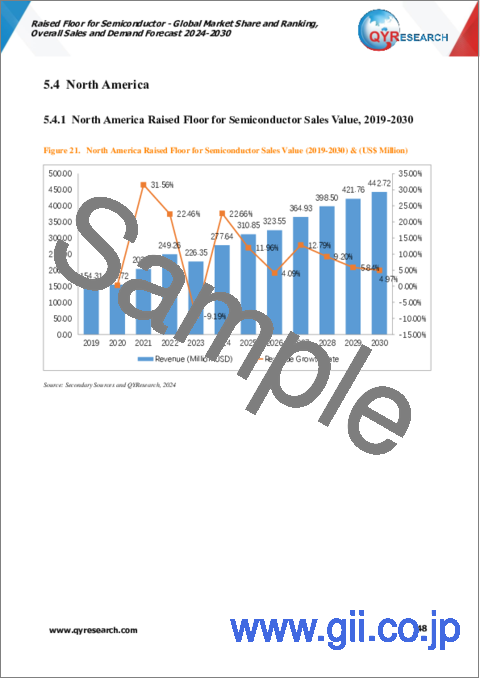
北米の市場規模は、2023年に2億2,635万米ドルであり、2030年までに4億4,272万米ドルに達すると予測され、予測期間のCAGRは8.09%です。
アジア太平洋の市場規模は、2023年に2億8,802万米ドルであり、2030年までに5億6,476万米ドルに達すると予測され、予測期間のCAGRは8.39%です。
欧州の市場規模は、2023年に4,500万米ドルであり、2030年までに8,271万米ドルに達すると予測され、予測期間のCAGRは7.50%です。
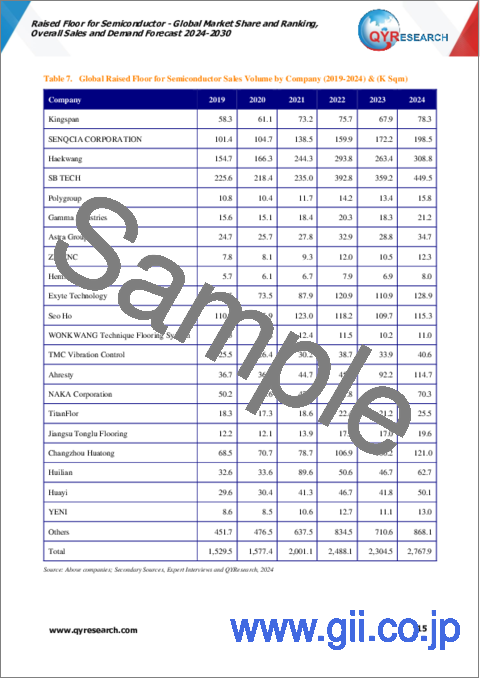
世界の半導体向けレイズドフロアの主要企業は、Kingspan、SENQCIA CORPORATION、Haekwang、SB TECH、Polygroup、Gamma Industries、Astra Groupなどです。2023年、世界の上位5社が収益ベースで約46.45%のシェアを占めました。
当レポートでは、世界の半導体向けレイズドフロア市場について調査分析し、各地域の売上と予測、主要企業の市場シェア、ランキングなどの情報を提供しています。
目次
第1章 市場の概要
- 半導体向けレイズドフロア製品のイントロダクション
- 世界の半導体向けレイズドフロアの市場規模の予測
- 世界の半導体向けレイズドフロアの売上金額(2019年~2030年)
- 世界の半導体向けレイズドフロアの売上数量(2019年~2030年)
- 世界の半導体向けレイズドフロアの販売価格(2019年~2030年)
- 半導体向けレイズドフロア市場の動向と促進要因
- 半導体向けレイズドフロア産業の動向
- 半導体向けレイズドフロア市場の促進要因と機会
- 半導体向けレイズドフロア市場の課題
- 半導体向けレイズドフロア市場の抑制要因
- 前提条件と制限
- 調査目的
- 考慮される年数
第2章 競合分析:企業別
- 世界の半導体向けレイズドフロア企業の収益ランキング(2023年)
- 世界の半導体向けレイズドフロアの収益:企業別(2019年~2024年)
- 世界の半導体向けレイズドフロア企業の売上数量ランキング(2023年)
- 世界の半導体向けレイズドフロアの売上数量:企業別(2019年~2024年)
- 世界の半導体向けレイズドフロアの平均価格:企業別(2019年~2024年)
- 主要メーカーの半導体向けレイズドフロア製造拠点、本社
- 主要メーカーの設立日
- 半導体向けレイズドフロア市場の競合分析
- 半導体向けレイズドフロアの市場集中度(2019年~2024年)
- 世界の半導体向けレイズドフロアの収益の5大・10大メーカー(2023年)
- 世界の主要メーカー:企業タイプ別(Tier 1・Tier 2・Tier 3)(2023年時点の半導体向けレイズドフロアの収益に基づく)
- 合併と買収、拡大
第3章 セグメント:タイプ別
- イントロダクション:タイプ別
- アルミ合金床
- ステンレススチール床
- その他
- 世界の半導体向けレイズドフロアの売上金額:タイプ別
- 世界の半導体向けレイズドフロアの売上金額:タイプ別(2019年・2023年・2030年)
- 世界の半導体向けレイズドフロアの売上金額:タイプ別(2019年~2030年)
- 世界の半導体向けレイズドフロアの売上金額:タイプ別(2019年~2030年)
- 世界の半導体向けレイズドフロアの売上数量:タイプ別
- 世界の半導体向けレイズドフロアの売上数量:タイプ別(2019年・2023年・2030年)
- 世界の半導体向けレイズドフロアの売上数量:タイプ別(2019年~2030年)
- 世界の半導体向けレイズドフロアの売上数量:タイプ別(2019年~2030年)
- 世界の半導体向けレイズドフロアの平均価格:タイプ別(2019年~2030年)
第4章 セグメント:用途別
- イントロダクション:用途別
- Fab
- OAST
- 世界の半導体向けレイズドフロアの売上金額:用途別
- 世界の半導体向けレイズドフロアの売上金額:用途別(2019年・2023年・2030年)
- 世界の半導体向けレイズドフロアの売上金額:用途別(2019年~2030年)
- 世界の半導体向けレイズドフロアの売上金額:用途別(2019年~2030年)
- 世界の半導体向けレイズドフロアの売上数量:用途別
- 世界の半導体向けレイズドフロアの売上数量:用途別(2019年・2023年・2030年)
- 世界の半導体向けレイズドフロアの売上数量:用途別(2019年~2030年)
- 世界の半導体向けレイズドフロアの売上数量:用途別(2019年~2030年)
- 世界の半導体向けレイズドフロアの平均価格:用途別(2019年~2030年)
第5章 セグメント:地域別
- 世界の半導体向けレイズドフロアの売上金額:地域別
- 世界の半導体向けレイズドフロアの売上金額:地域別(2019年・2023年・2030年)
- 世界の半導体向けレイズドフロアの売上金額:地域別(2019年~2024年)
- 世界の半導体向けレイズドフロアの売上金額:地域別(2025年~2030年)
- 世界の半導体向けレイズドフロアの売上金額:地域別(2019年~2030年)
- 世界の半導体向けレイズドフロアの売上数量:地域別
- 世界の半導体向けレイズドフロアの売上数量:地域別(2019年・2023年・2030年)
- 世界の半導体向けレイズドフロアの売上数量:地域別(2019年~2024年)
- 世界の半導体向けレイズドフロアの売上数量:地域別(2025年~2030年)
- 世界の半導体向けレイズドフロアの売上数量:地域別(2019年~2030年)
- 半導体向けレイズドフロアの平均価格:地域別(2019年~2030年)
- 北米
- 北米の半導体向けレイズドフロアの売上金額(2019年~2030年)
- 北米の半導体向けレイズドフロアの売上金額:国別(2023年・2030年)
- 欧州
- 欧州の半導体向けレイズドフロアの売上金額(2019年~2030年)
- 欧州の半導体向けレイズドフロアの売上金額:国別(2023年・2030年)
- アジア太平洋
- アジア太平洋の半導体向けレイズドフロアの売上金額(2019年~2030年)
- アジア太平洋の半導体向けレイズドフロアの売上金額:地域別(2023年・2030年)
- ラテンアメリカ
- ラテンアメリカの半導体向けレイズドフロアの売上金額(2019年~2030年)
- ラテンアメリカの半導体向けレイズドフロアの売上金額:国別(2023年・2030年)
- 中東・アフリカ
第6章 セグメント:主要国/地域別
- 主要国/地域の半導体向けレイズドフロアの売上金額成長動向(2019年・2023年・2030年)
- 主要国/地域の半導体向けレイズドフロアの売上金額
- 主要国/地域の半導体向けレイズドフロアの売上金額(2019年~2030年)
- 主要国/地域の半導体向けレイズドフロアの売上数量(2019年~2030年)
- 米国
- 米国の半導体向けレイズドフロアの売上金額(2019年~2030年)
- 米国の半導体向けレイズドフロアの売上金額:タイプ別(2023年・2030年)
- 米国の半導体向けレイズドフロアの売上金額:用途別(2023年・2030年)
- 欧州
- 欧州の半導体向けレイズドフロアの売上金額(2019年~2030年)
- 欧州の半導体向けレイズドフロアの売上金額:タイプ別(2023年・2030年)
- 欧州の半導体向けレイズドフロアの売上金額:用途別(2023年・2030年)
- 中国
- 中国の半導体向けレイズドフロアの売上金額(2019年~2030年)
- 中国の半導体向けレイズドフロアの売上金額:タイプ別(2023年・2030年)
- 中国の半導体向けレイズドフロアの売上金額:用途別(2023年・2030年)
- 日本
- 日本の半導体向けレイズドフロアの売上金額(2019年~2030年)
- 日本の半導体向けレイズドフロアの売上金額:タイプ別(2023年・2030年)
- 日本の半導体向けレイズドフロアの売上金額:用途別(2023年・2030年)
- 韓国
- 韓国の半導体向けレイズドフロアの売上金額(2019年~2030年)
- 韓国の半導体向けレイズドフロアの売上金額:タイプ別(2023年・2030年)
- 韓国の半導体向けレイズドフロアの売上金額:用途別(2023年・2030年)
- 東南アジア
- 東南アジアの半導体向けレイズドフロアの売上金額(2019年~2030年)
- 東南アジアの半導体向けレイズドフロアの売上金額:タイプ別(2023年・2030年)
- 東南アジアの半導体向けレイズドフロアの売上金額:用途別(2023年・2030年)
- インド
- インドの半導体向けレイズドフロアの売上金額(2019年~2030年)
- インドの半導体向けレイズドフロアの売上金額:タイプ別(2023年・2030年)
- インドの半導体向けレイズドフロアの売上金額:用途別(2023年・2030年)
第7章 企業プロファイル
- Kingspan
- SENQCIA CORPORATION
- Haekwang
- SB TECH
- Polygroup
- Gamma Industries
- Astra Group
- ZIP ENC
- Hemsco
- Exyte Technology
- Seo Ho
- WONKWANG Technique Flooring System
- TMC Vibration Control
- Ahresty
- NAKA Corporation
- TitanFlor
- Jiangsu Tonglu Flooring
- Changzhou Huatong
- Huilian
- Huayi
- YENI
第8章 産業チェーン分析
- 半導体向けレイズドフロア床の産業チェーン
- 半導体向けレイズドフロアの上流分析
- 主な原材料
- 原材料の主要サプライヤー
- 製造コスト構造
- 中流分析
- 下流分析(顧客分析)
- 販売モデルと販売チャネル
- 半導体向けレイズドフロアの販売モデル
- 販売チャネル
- 半導体向けレイズドフロアの販売業者
第9章 調査結果と結論
第10章 付録
List of Tables
- Table 1. Raised Floor for Semiconductor Market Trends
- Table 2. Raised Floor for Semiconductor Market Drivers & Opportunity
- Table 3. Raised Floor for Semiconductor Market Challenges
- Table 4. Raised Floor for Semiconductor Market Restraints
- Table 5. Global Raised Floor for Semiconductor Revenue by Company (2019-2024) & (US$ Million)
- Table 6. Global Raised Floor for Semiconductor Revenue Market Share by Company (2019-2024)
- Table 7. Global Raised Floor for Semiconductor Sales Volume by Company (2019-2024) & (K Sqm)
- Table 8. Global Raised Floor for Semiconductor Sales Volume Market Share by Company (2019-2024)
- Table 9. Global Market Raised Floor for Semiconductor Price by Company (2019-2024) & (US$/Sqm)
- Table 10. Key Manufacturers Raised Floor for Semiconductor Manufacturing Base and Headquarters
- Table 11. Key Manufacturers Time to Established
- Table 12. Global Raised Floor for Semiconductor Manufacturers Market Concentration Ratio (CR5)
- Table 13. Global Top Manufacturers Market Share by Company Type (Tier 1, Tier 2, and Tier 3) & (based on the Revenue in Raised Floor for Semiconductor as of 2023)
- Table 14. Mergers & Acquisitions, Expansion Plans
- Table 15. Global Raised Floor for Semiconductor Sales Value by Type: 2019 VS 2023 VS 2030 (US$ Million)
- Table 16. Global Raised Floor for Semiconductor Sales Value by Type (2019-2024) & (US$ Million)
- Table 17. Global Raised Floor for Semiconductor Sales Value by Type (2025-2030) & (US$ Million)
- Table 18. Global Raised Floor for Semiconductor Sales Market Share in Value by Type (2019-2024)
- Table 19. Global Raised Floor for Semiconductor Sales Market Share in Value by Type (2025-2030)
- Table 20. Global Raised Floor for Semiconductor Sales Volume by Type: 2019 VS 2023 VS 2030 (K Sqm)
- Table 21. Global Raised Floor for Semiconductor Sales Volume by Type (2019-2024) & (K Sqm)
- Table 22. Global Raised Floor for Semiconductor Sales Volume by Type (2025-2030) & (K Sqm)
- Table 23. Global Raised Floor for Semiconductor Sales Market Share in Value by Type (2019-2024)
- Table 24. Global Raised Floor for Semiconductor Sales Market Share in Value by Type (2025-2030)
- Table 25. Global Raised Floor for Semiconductor Price by Type (2019-2024) & (US$/Sqm)
- Table 26. Global Raised Floor for Semiconductor Price by Type (2025-2030) & (US$/Sqm)
- Table 27. Global Raised Floor for Semiconductor Sales Value by Application: 2019 VS 2023 VS 2030 (US$ Million)
- Table 28. Global Raised Floor for Semiconductor Sales Value by Application (2019-2024) & (US$ Million)
- Table 29. Global Raised Floor for Semiconductor Sales Value by Application (2025-2030) & (US$ Million)
- Table 30. Global Raised Floor for Semiconductor Sales Market Share in Value by Application (2019-2024)
- Table 31. Global Raised Floor for Semiconductor Sales Market Share in Value by Application (2025-2030)
- Table 32. Global Raised Floor for Semiconductor Sales Volume by Application: 2019 VS 2023 VS 2030 (K Sqm)
- Table 33. Global Raised Floor for Semiconductor Sales Volume by Application (2019-2024) & (K Sqm)
- Table 34. Global Raised Floor for Semiconductor Sales Volume by Application (2025-2030) & (K Sqm)
- Table 35. Global Raised Floor for Semiconductor Sales Market Share in Value by Application (2019-2024)
- Table 36. Global Raised Floor for Semiconductor Sales Market Share in Value by Application (2025-2030)
- Table 37. Global Raised Floor for Semiconductor Price by Application (2019-2024) & (US$/Sqm)
- Table 38. Global Raised Floor for Semiconductor Price by Application (2025-2030) & (US$/Sqm)
- Table 39. Global Raised Floor for Semiconductor Sales Value by Region, (2019 VS 2023 VS 2030) & (US$ Million)
- Table 40. Global Raised Floor for Semiconductor Sales Value by Region (2019-2024) & (US$ Million)
- Table 41. Global Raised Floor for Semiconductor Sales Value by Region (2025-2030) & (US$ Million)
- Table 42. Global Raised Floor for Semiconductor Sales Value by Region (2019-2024) & (%)
- Table 43. Global Raised Floor for Semiconductor Sales Value by Region (2025-2030) & (%)
- Table 44. Global Raised Floor for Semiconductor Sales Volume by Region (K Sqm): 2019 VS 2023 VS 2030
- Table 45. Global Raised Floor for Semiconductor Sales Volume by Region (2019-2024) & (K Sqm)
- Table 46. Global Raised Floor for Semiconductor Sales Volume by Region (2025-2030) & (K Sqm)
- Table 47. Global Raised Floor for Semiconductor Sales Volume by Region (2019-2024) & (%)
- Table 48. Global Raised Floor for Semiconductor Sales Volume by Region (2025-2030) & (%)
- Table 49. Global Raised Floor for Semiconductor Average Price by Region (2019-2024) & (US$/Sqm)
- Table 50. Global Raised Floor for Semiconductor Average Price by Region (2025-2030) & (US$/Sqm)
- Table 51. Key Countries/Regions Raised Floor for Semiconductor Sales Value Growth Trends, (US$ Million): 2019 VS 2023 VS 2030
- Table 52. Key Countries/Regions Raised Floor for Semiconductor Sales Value, (2019-2024) & (US$ Million)
- Table 53. Key Countries/Regions Raised Floor for Semiconductor Sales Value, (2025-2030) & (US$ Million)
- Table 54. Key Countries/Regions Raised Floor for Semiconductor Sales Volume, (2019-2024) & (K Sqm)
- Table 55. Key Countries/Regions Raised Floor for Semiconductor Sales Volume, (2025-2030) & (K Sqm)
- Table 56. Kingspan Company Information
- Table 57. Kingspan Introduction and Business Overview
- Table 58. Kingspan Raised Floor for Semiconductor Sales (K Sqm), Revenue (US$ Million), Price (US$/Sqm) and Gross Margin (2019-2024)
- Table 59. Kingspan Raised Floor for Semiconductor Product Offerings
- Table 60. SENQCIA CORPORATION Company Information
- Table 61. SENQCIA CORPORATION Introduction and Business Overview
- Table 62. SENQCIA CORPORATION Raised Floor for Semiconductor Sales (K Sqm), Revenue (US$ Million), Price (US$/Sqm) and Gross Margin (2019-2024)
- Table 63. SENQCIA CORPORATION Raised Floor for Semiconductor Product Offerings
- Table 64. Haekwang Company Information
- Table 65. Haekwang Introduction and Business Overview
- Table 66. Haekwang Raised Floor for Semiconductor Sales (K Sqm), Revenue (US$ Million), Price (US$/Sqm) and Gross Margin (2019-2024)
- Table 67. Haekwang Raised Floor for Semiconductor Product Offerings
- Table 68. SB TECH Company Information
- Table 69. SB TECH Introduction and Business Overview
- Table 70. SB TECH Raised Floor for Semiconductor Sales (K Sqm), Revenue (US$ Million), Price (US$/Sqm) and Gross Margin (2019-2024)
- Table 71. SB TECH Raised Floor for Semiconductor Product Offerings
- Table 72. Polygroup Company Information
- Table 73. Polygroup Introduction and Business Overview
- Table 74. Polygroup Raised Floor for Semiconductor Sales (K Sqm), Revenue (US$ Million), Price (US$/Sqm) and Gross Margin (2019-2024)
- Table 75. Polygroup Raised Floor for Semiconductor Product Offerings
- Table 76. Gamma Industries Company Information
- Table 77. Gamma Industries Introduction and Business Overview
- Table 78. Gamma Industries Raised Floor for Semiconductor Sales (K Sqm), Revenue (US$ Million), Price (US$/Sqm) and Gross Margin (2019-2024)
- Table 79. Gamma Industries Raised Floor for Semiconductor Product Offerings
- Table 80. Astra Group Company Information
- Table 81. Astra Group Introduction and Business Overview
- Table 82. Astra Group Raised Floor for Semiconductor Sales (K Sqm), Revenue (US$ Million), Price (US$/Sqm) and Gross Margin (2019-2024)
- Table 83. Astra Group Raised Floor for Semiconductor Product Offerings
- Table 84. ZIP ENC Company Information
- Table 85. ZIP ENC Introduction and Business Overview
- Table 86. ZIP ENC Raised Floor for Semiconductor Sales (K Sqm), Revenue (US$ Million), Price (US$/Sqm) and Gross Margin (2019-2024)
- Table 87. ZIP ENC Raised Floor for Semiconductor Product Offerings
- Table 88. Hemsco Company Information
- Table 89. Hemsco Introduction and Business Overview
- Table 90. Hemsco Raised Floor for Semiconductor Sales (K Sqm), Revenue (US$ Million), Price (US$/Sqm) and Gross Margin (2019-2024)
- Table 91. Hemsco Raised Floor for Semiconductor Product Offerings
- Table 92. Exyte Technology Company Information
- Table 93. Exyte Technology Introduction and Business Overview
- Table 94. Exyte Technology Raised Floor for Semiconductor Sales (K Sqm), Revenue (US$ Million), Price (US$/Sqm) and Gross Margin (2019-2024)
- Table 95. Exyte Technology Raised Floor for Semiconductor Product Offerings
- Table 96. Seo Ho Company Information
- Table 97. Seo Ho Introduction and Business Overview
- Table 98. Seo Ho Raised Floor for Semiconductor Sales (K Sqm), Revenue (US$ Million), Price (US$/Sqm) and Gross Margin (2019-2024)
- Table 99. Seo Ho Raised Floor for Semiconductor Product Offerings
- Table 100. WONKWANG Technique Flooring System Company Information
- Table 101. WONKWANG Technique Flooring System Introduction and Business Overview
- Table 102. WONKWANG Technique Flooring System Raised Floor for Semiconductor Sales (K Sqm), Revenue (US$ Million), Price (US$/Sqm) and Gross Margin (2019-2024)
- Table 103. WONKWANG Technique Flooring System Raised Floor for Semiconductor Product Offerings
- Table 104. TMC Vibration Control Company Information
- Table 105. TMC Vibration Control Introduction and Business Overview
- Table 106. TMC Vibration Control Raised Floor for Semiconductor Sales (K Sqm), Revenue (US$ Million), Price (US$/Sqm) and Gross Margin (2019-2024)
- Table 107. TMC Vibration Control Raised Floor for Semiconductor Product Offerings
- Table 108. Ahresty Company Information
- Table 109. Ahresty Introduction and Business Overview
- Table 110. Ahresty Raised Floor for Semiconductor Sales (K Sqm), Revenue (US$ Million), Price (US$/Sqm) and Gross Margin (2019-2024)
- Table 111. Ahresty Raised Floor for Semiconductor Product Offerings
- Table 112. NAKA Corporation Company Information
- Table 113. NAKA Corporation Introduction and Business Overview
- Table 114. NAKA Corporation Raised Floor for Semiconductor Sales (K Sqm), Revenue (US$ Million), Price (US$/Sqm) and Gross Margin (2019-2024)
- Table 115. NAKA Corporation Raised Floor for Semiconductor Product Offerings
- Table 116. TitanFlor Company Information
- Table 117. TitanFlor Introduction and Business Overview
- Table 118. TitanFlor Raised Floor for Semiconductor Sales (K Sqm), Revenue (US$ Million), Price (US$/Sqm) and Gross Margin (2019-2024)
- Table 119. TitanFlor Raised Floor for Semiconductor Product Offerings
- Table 120. Jiangsu Tonglu Flooring Company Information
- Table 121. Jiangsu Tonglu Flooring Introduction and Business Overview
- Table 122. Jiangsu Tonglu Flooring Raised Floor for Semiconductor Sales (K Sqm), Revenue (US$ Million), Price (US$/Sqm) and Gross Margin (2019-2024)
- Table 123. Jiangsu Tonglu Flooring Raised Floor for Semiconductor Product Offerings
- Table 124. Changzhou Huatong Company Information
- Table 125. Changzhou Huatong Introduction and Business Overview
- Table 126. Changzhou Huatong Raised Floor for Semiconductor Sales (K Sqm), Revenue (US$ Million), Price (US$/Sqm) and Gross Margin (2019-2024)
- Table 127. Changzhou Huatong Raised Floor for Semiconductor Product Offerings
- Table 128. Huilian Company Information
- Table 129. Huilian Introduction and Business Overview
- Table 130. Huilian Raised Floor for Semiconductor Sales (K Sqm), Revenue (US$ Million), Price (US$/Sqm) and Gross Margin (2019-2024)
- Table 131. Huilian Raised Floor for Semiconductor Product Offerings
- Table 132. Huayi Company Information
- Table 133. Huayi Introduction and Business Overview
- Table 134. Huayi Raised Floor for Semiconductor Sales (K Sqm), Revenue (US$ Million), Price (US$/Sqm) and Gross Margin (2019-2024)
- Table 135. Huayi Raised Floor for Semiconductor Product Offerings
- Table 136. YENI Company Information
- Table 137. YENI Introduction and Business Overview
- Table 138. YENI Raised Floor for Semiconductor Sales (K Sqm), Revenue (US$ Million), Price (US$/Sqm) and Gross Margin (2019-2024)
- Table 139. YENI Raised Floor for Semiconductor Product Offerings
- Table 140. Key Raw Materials Lists
- Table 141. Raw Materials Key Suppliers Lists
- Table 142. Raised Floor for Semiconductor Downstream Customers
- Table 143. Raised Floor for Semiconductor Distributors List
- Table 144. Research Programs/Design for This Report
- Table 145. Key Data Information from Secondary Sources
- Table 146. Key Data Information from Primary Sources
List of Figures
- Figure 1. Raised Floor for Semiconductor Product Picture
- Figure 2. Global Raised Floor for Semiconductor Sales Value, 2019 VS 2023 VS 2030 (US$ Million)
- Figure 3. Global Raised Floor for Semiconductor Sales Value (2019-2030) & (US$ Million)
- Figure 4. Global Raised Floor for Semiconductor Sales Volume (2019-2030) & (K Sqm)
- Figure 5. Global Raised Floor for Semiconductor Sales Price (2019-2030) & (US$/Sqm)
- Figure 6. Raised Floor for Semiconductor Report Years Considered
- Figure 7. Global Raised Floor for Semiconductor Players Revenue Ranking (2023) & (US$ Million)
- Figure 8. Global Raised Floor for Semiconductor Players Sales Volume Ranking (2023) & (K Sqm)
- Figure 9. The 5 and 10 Largest Manufacturers in the World: Market Share by Raised Floor for Semiconductor Revenue in 2023
- Figure 10. Raised Floor for Semiconductor Market Share by Company Type (Tier 1, Tier 2, and Tier 3) in 2023
- Figure 11. Aluminum Alloy Floor Picture
- Figure 12. Stainless Steel Floor Picture
- Figure 13. Global Raised Floor for Semiconductor Sales Value by Type (2019 VS 2023 VS 2030) & (US$ Million)
- Figure 14. Global Raised Floor for Semiconductor Sales Value Market Share by Type, 2023 & 2030
- Figure 15. Global Raised Floor for Semiconductor Sales Volume by Type (2019 VS 2023 VS 2030) & (K Sqm)
- Figure 16. Global Raised Floor for Semiconductor Sales Volume Market Share by Type, 2023 & 2030
- Figure 17. Global Raised Floor for Semiconductor Sales Value by Application (2019 VS 2023 VS 2030) & (US$ Million)
- Figure 18. Global Raised Floor for Semiconductor Sales Value Market Share by Application, 2023 & 2030
- Figure 19. Global Raised Floor for Semiconductor Sales Volume by Application (2019 VS 2023 VS 2030) & (K Sqm)
- Figure 20. Global Raised Floor for Semiconductor Sales Volume Market Share by Application, 2023 & 2030
- Figure 21. North America Raised Floor for Semiconductor Sales Value (2019-2030) & (US$ Million)
- Figure 22. North America Raised Floor for Semiconductor Sales Value by Country (%), 2023 VS 2030
- Figure 23. Europe Raised Floor for Semiconductor Sales Value, (2019-2030) & (US$ Million)
- Figure 24. Europe Raised Floor for Semiconductor Sales Value by Country (%), 2023 VS 2030
- Figure 25. Asia Pacific Raised Floor for Semiconductor Sales Value, (2019-2030) & (US$ Million)
- Figure 26. Asia Pacific Raised Floor for Semiconductor Sales Value by Region (%), 2023 VS 2030
- Figure 27. Latin America Raised Floor for Semiconductor Sales Value, (2019-2030) & (US$ Million)
- Figure 28. Latin America Raised Floor for Semiconductor Sales Value by Country (%), 2023 VS 2030
- Figure 29. Middle East & Africa Raised Floor for Semiconductor Sales Value, (2019-2030) & (US$ Million)
- Figure 30. Middle East & Africa Raised Floor for Semiconductor Sales Value by Country (%), 2023 VS 2030
- Figure 31. United States Raised Floor for Semiconductor Sales Value, (2019-2030) & (US$ Million)
- Figure 32. United States Raised Floor for Semiconductor Sales Value by Type (%), 2023 VS 2030
- Figure 33. United States Raised Floor for Semiconductor Sales Value by Application (%), 2023 VS 2030
- Figure 34. Europe Raised Floor for Semiconductor Sales Value, (2019-2030) & (US$ Million)
- Figure 35. Europe Raised Floor for Semiconductor Sales Value by Type (%), 2023 VS 2030
- Figure 36. Europe Raised Floor for Semiconductor Sales Value by Application (%), 2023 VS 2030
- Figure 37. China Raised Floor for Semiconductor Sales Value, (2019-2030) & (US$ Million)
- Figure 38. China Raised Floor for Semiconductor Sales Value by Type (%), 2023 VS 2030
- Figure 39. China Raised Floor for Semiconductor Sales Value by Application (%), 2023 VS 2030
- Figure 40. Japan Raised Floor for Semiconductor Sales Value, (2019-2030) & (US$ Million)
- Figure 41. Japan Raised Floor for Semiconductor Sales Value by Type (%), 2023 VS 2030
- Figure 42. Japan Raised Floor for Semiconductor Sales Value by Application (%), 2023 VS 2030
- Figure 43. South Korea Raised Floor for Semiconductor Sales Value, (2019-2030) & (US$ Million)
- Figure 44. South Korea Raised Floor for Semiconductor Sales Value by Type (%), 2023 VS 2030
- Figure 45. South Korea Raised Floor for Semiconductor Sales Value by Application (%), 2023 VS 2030
- Figure 46. Southeast Asia Raised Floor for Semiconductor Sales Value, (2019-2030) & (US$ Million)
- Figure 47. Southeast Asia Raised Floor for Semiconductor Sales Value by Type (%), 2023 VS 2030
- Figure 48. Southeast Asia Raised Floor for Semiconductor Sales Value by Application (%), 2023 VS 2030
- Figure 49. India Raised Floor for Semiconductor Sales Value, (2019-2030) & (US$ Million)
- Figure 50. India Raised Floor for Semiconductor Sales Value by Type (%), 2023 VS 2030
- Figure 51. India Raised Floor for Semiconductor Sales Value by Application (%), 2023 VS 2030
- Figure 52. Raised Floor for Semiconductor Industrial Chain
- Figure 53. Raised Floor for Semiconductor Manufacturing Cost Structure in 2023
- Figure 54. Channels of Distribution (Direct Sales, and Distribution)
- Figure 55. Bottom-up and Top-down Approaches for This Report
- Figure 56. Data Triangulation
- Figure 57. Key Executives Interviewed
The global market for Raised Floor for Semiconductor was US$ 566.50 million in 2023 and is forecast to a readjusted size of US$ 1,102.63 million by 2030 with a CAGR of 8.18% during the forecast period 2024-2030.
North American market for Raised Floor for Semiconductor was valued at $ 226.35 million in 2023 and will reach $ 442.72 million by 2030, at a CAGR of 8.09 % during the forecast period of 2024 through 2030.
Asia-Pacific market for Raised Floor for Semiconductor was valued at $ 288.02 million in 2023 and will reach $ 564.76 million by 2030, at a CAGR of 8.39 % during the forecast period of 2024 through 2030.
Europe market for Raised Floor for Semiconductor was valued at $ 45 million in 2023 and will reach $ 82.71 million by 2030, at a CAGR of 7.50 % during the forecast period of 2024 through 2030.
The global key companies of Raised Floor for Semiconductor include Kingspan, SENQCIA CORPORATION, Haekwang, SB TECH, Polygroup, Gamma Industries, Astra Group, etc. In 2023, the global five largest players hold a share approximately 46.45% in terms of revenue.
This report aims to provide a comprehensive presentation of the global market for Raised Floor for Semiconductor, focusing on the total sales volume, sales revenue, price, key companies market share and ranking, together with an analysis of Raised Floor for Semiconductor by region & country, by Type, and by Application.
The Raised Floor for Semiconductor market size, estimations, and forecasts are provided in terms of sales volume (K Sqm) and sales revenue ($ millions), considering 2023 as the base year, with history and forecast data for the period from 2019 to 2030. With both quantitative and qualitative analysis, to help readers develop business/growth strategies, assess the market competitive situation, analyze their position in the current marketplace, and make informed business decisions regarding Raised Floor for Semiconductor.
Market Segmentation
By Company
- Kingspan
- SENQCIA CORPORATION
- Haekwang
- SB TECH
- Polygroup
- Gamma Industries
- Astra Group
- ZIP ENC
- Hemsco
- Exyte Technology
- Seo Ho
- WONKWANG Technique Flooring System
- TMC Vibration Control
- Ahresty
- NAKA Corporation
- TitanFlor
- Jiangsu Tonglu Flooring
- Changzhou Huatong
- Huilian
- Huayi
- YENI
Segment by Type
- Aluminum Alloy Floor
- Stainless Steel Floor
- Others
Segment by Application
- Fab
- OAST
- Others
By Region
- North America
- United States
- Canada
- Asia-Pacific
- China
- Japan
- South Korea
- Southeast Asia
- India
- China Taiwan
- Rest of Asia-Pacific
- Europe
- Germany
- France
- U.K.
- Italy
- Russia
- Rest of Europe
- Latin America
- Mexico
- Brazil
- Argentina
- Rest of Latin America
- Middle East & Africa
- Middle East
- Africa
Table of Contents
1 Market Overview
- 1.1 Raised Floor for Semiconductor Product Introduction
- 1.2 Global Raised Floor for Semiconductor Market Size Forecast
- 1.2.1 Global Raised Floor for Semiconductor Sales Value (2019-2030)
- 1.2.2 Global Raised Floor for Semiconductor Sales Volume (2019-2030)
- 1.2.3 Global Raised Floor for Semiconductor Sales Price (2019-2030)
- 1.3 Raised Floor for Semiconductor Market Trends & Drivers
- 1.3.1 Raised Floor for Semiconductor Industry Trends
- 1.3.2 Raised Floor for Semiconductor Market Drivers & Opportunity
- 1.3.3 Raised Floor for Semiconductor Market Challenges
- 1.3.4 Raised Floor for Semiconductor Market Restraints
- 1.4 Assumptions and Limitations
- 1.5 Study Objectives
- 1.6 Years Considered
2 Competitive Analysis by Company
- 2.1 Global Raised Floor for Semiconductor Players Revenue Ranking (2023)
- 2.2 Global Raised Floor for Semiconductor Revenue by Company (2019-2024)
- 2.3 Global Raised Floor for Semiconductor Players Sales Volume Ranking (2023)
- 2.4 Global Raised Floor for Semiconductor Sales Volume by Company Players (2019-2024)
- 2.5 Global Raised Floor for Semiconductor Average Price by Company (2019-2024)
- 2.6 Key Manufacturers Raised Floor for Semiconductor Manufacturing Base and Headquarters
- 2.7 Key Manufacturers Time to Established
- 2.8 Raised Floor for Semiconductor Market Competitive Analysis
- 2.8.1 Raised Floor for Semiconductor Market Concentration Rate (2019-2024)
- 2.8.2 Global 5 and 10 Largest Manufacturers by Raised Floor for Semiconductor Revenue in 2023
- 2.8.3 Global Top Manufacturers by Company Type (Tier 1, Tier 2, and Tier 3) & (based on the Revenue in Raised Floor for Semiconductor as of 2023)
- 2.9 Mergers & Acquisitions, Expansion
3 Segmentation by Type
- 3.1 Introduction by Type
- 3.1.1 Aluminum Alloy Floor
- 3.1.2 Stainless Steel Floor
- 3.1.3 Others
- 3.2 Global Raised Floor for Semiconductor Sales Value by Type
- 3.2.1 Global Raised Floor for Semiconductor Sales Value by Type (2019 VS 2023 VS 2030)
- 3.2.2 Global Raised Floor for Semiconductor Sales Value, by Type (2019-2030)
- 3.2.3 Global Raised Floor for Semiconductor Sales Value, by Type (%) (2019-2030)
- 3.3 Global Raised Floor for Semiconductor Sales Volume by Type
- 3.3.1 Global Raised Floor for Semiconductor Sales Volume by Type (2019 VS 2023 VS 2030)
- 3.3.2 Global Raised Floor for Semiconductor Sales Volume, by Type (2019-2030)
- 3.3.3 Global Raised Floor for Semiconductor Sales Volume, by Type (%) (2019-2030)
- 3.4 Global Raised Floor for Semiconductor Average Price by Type (2019-2030)
4 Segmentation by Application
- 4.1 Introduction by Application
- 4.1.1 Fab
- 4.1.2 OAST
- 4.2 Global Raised Floor for Semiconductor Sales Value by Application
- 4.2.1 Global Raised Floor for Semiconductor Sales Value by Application (2019 VS 2023 VS 2030)
- 4.2.2 Global Raised Floor for Semiconductor Sales Value, by Application (2019-2030)
- 4.2.3 Global Raised Floor for Semiconductor Sales Value, by Application (%) (2019-2030)
- 4.3 Global Raised Floor for Semiconductor Sales Volume by Application
- 4.3.1 Global Raised Floor for Semiconductor Sales Volume by Application (2019 VS 2023 VS 2030)
- 4.3.2 Global Raised Floor for Semiconductor Sales Volume, by Application (2019-2030)
- 4.3.3 Global Raised Floor for Semiconductor Sales Volume, by Application (%) (2019-2030)
- 4.4 Global Raised Floor for Semiconductor Average Price by Application (2019-2030)
5 Segmentation by Region
- 5.1 Global Raised Floor for Semiconductor Sales Value by Region
- 5.1.1 Global Raised Floor for Semiconductor Sales Value by Region: 2019 VS 2023 VS 2030
- 5.1.2 Global Raised Floor for Semiconductor Sales Value by Region (2019-2024)
- 5.1.3 Global Raised Floor for Semiconductor Sales Value by Region (2025-2030)
- 5.1.4 Global Raised Floor for Semiconductor Sales Value by Region (%), (2019-2030)
- 5.2 Global Raised Floor for Semiconductor Sales Volume by Region
- 5.2.1 Global Raised Floor for Semiconductor Sales Volume by Region: 2019 VS 2023 VS 2030
- 5.2.2 Global Raised Floor for Semiconductor Sales Volume by Region (2019-2024)
- 5.2.3 Global Raised Floor for Semiconductor Sales Volume by Region (2025-2030)
- 5.2.4 Global Raised Floor for Semiconductor Sales Volume by Region (%), (2019-2030)
- 5.3 Global Raised Floor for Semiconductor Average Price by Region (2019-2030)
- 5.4 North America
- 5.4.1 North America Raised Floor for Semiconductor Sales Value, 2019-2030
- 5.4.2 North America Raised Floor for Semiconductor Sales Value by Country (%), 2023 VS 2030
- 5.5 Europe
- 5.5.1 Europe Raised Floor for Semiconductor Sales Value, 2019-2030
- 5.5.2 Europe Raised Floor for Semiconductor Sales Value by Country (%), 2023 VS 2030
- 5.6 Asia Pacific
- 5.6.1 Asia Pacific Raised Floor for Semiconductor Sales Value, 2019-2030
- 5.6.2 Asia Pacific Raised Floor for Semiconductor Sales Value by Region (%), 2023 VS 2030
- 5.7 Latin America
- 5.7.1 Latin America Raised Floor for Semiconductor Sales Value, 2019-2030
- 5.7.2 Latin America Raised Floor for Semiconductor Sales Value by Country (%), 2023 VS 2030
- 5.8 Middle East & Africa
- 5.8.1 Middle East & Africa Raised Floor for Semiconductor Sales Value, 2019-2030
- 5.8.2 Middle East & Africa Raised Floor for Semiconductor Sales Value by Country (%), 2023 VS 2030
6 Segmentation by Key Countries/Regions
- 6.1 Key Countries/Regions Raised Floor for Semiconductor Sales Value Growth Trends, 2019 VS 2023 VS 2030
- 6.2 Key Countries/Regions Raised Floor for Semiconductor Sales Value
- 6.2.1 Key Countries/Regions Raised Floor for Semiconductor Sales Value, 2019-2030
- 6.2.2 Key Countries/Regions Raised Floor for Semiconductor Sales Volume, 2019-2030
- 6.3 United States
- 6.3.1 United States Raised Floor for Semiconductor Sales Value, 2019-2030
- 6.3.2 United States Raised Floor for Semiconductor Sales Value by Type (%), 2023 VS 2030
- 6.3.3 United States Raised Floor for Semiconductor Sales Value by Application, 2023 VS 2030
- 6.4 Europe
- 6.4.1 Europe Raised Floor for Semiconductor Sales Value, 2019-2030
- 6.4.2 Europe Raised Floor for Semiconductor Sales Value by Type (%), 2023 VS 2030
- 6.4.3 Europe Raised Floor for Semiconductor Sales Value by Application, 2023 VS 2030
- 6.5 China
- 6.5.1 China Raised Floor for Semiconductor Sales Value, 2019-2030
- 6.5.2 China Raised Floor for Semiconductor Sales Value by Type (%), 2023 VS 2030
- 6.5.3 China Raised Floor for Semiconductor Sales Value by Application, 2023 VS 2030
- 6.6 Japan
- 6.6.1 Japan Raised Floor for Semiconductor Sales Value, 2019-2030
- 6.6.2 Japan Raised Floor for Semiconductor Sales Value by Type (%), 2023 VS 2030
- 6.6.3 Japan Raised Floor for Semiconductor Sales Value by Application, 2023 VS 2030
- 6.7 South Korea
- 6.7.1 South Korea Raised Floor for Semiconductor Sales Value, 2019-2030
- 6.7.2 South Korea Raised Floor for Semiconductor Sales Value by Type (%), 2023 VS 2030
- 6.7.3 South Korea Raised Floor for Semiconductor Sales Value by Application, 2023 VS 2030
- 6.8 Southeast Asia
- 6.8.1 Southeast Asia Raised Floor for Semiconductor Sales Value, 2019-2030
- 6.8.2 Southeast Asia Raised Floor for Semiconductor Sales Value by Type (%), 2023 VS 2030
- 6.8.3 Southeast Asia Raised Floor for Semiconductor Sales Value by Application, 2023 VS 2030
- 6.9 India
- 6.9.1 India Raised Floor for Semiconductor Sales Value, 2019-2030
- 6.9.2 India Raised Floor for Semiconductor Sales Value by Type (%), 2023 VS 2030
- 6.9.3 India Raised Floor for Semiconductor Sales Value by Application, 2023 VS 2030
7 Company Profiles
- 7.1 Kingspan
- 7.1.1 Kingspan Company Information
- 7.1.2 Kingspan Introduction and Business Overview
- 7.1.3 Kingspan Raised Floor for Semiconductor Sales, Revenue, Price and Gross Margin (2019-2024)
- 7.1.4 Kingspan Raised Floor for Semiconductor Product Offerings
- 7.2 SENQCIA CORPORATION
- 7.2.1 SENQCIA CORPORATION Company Information
- 7.2.2 SENQCIA CORPORATION Introduction and Business Overview
- 7.2.3 SENQCIA CORPORATION Raised Floor for Semiconductor Sales, Revenue, Price and Gross Margin (2019-2024)
- 7.2.4 SENQCIA CORPORATION Raised Floor for Semiconductor Product Offerings
- 7.3 Haekwang
- 7.3.1 Haekwang Company Information
- 7.3.2 Haekwang Introduction and Business Overview
- 7.3.3 Haekwang Raised Floor for Semiconductor Sales, Revenue, Price and Gross Margin (2019-2024)
- 7.3.4 Haekwang Raised Floor for Semiconductor Product Offerings
- 7.4 SB TECH
- 7.4.1 SB TECH Company Information
- 7.4.2 SB TECH Introduction and Business Overview
- 7.4.3 SB TECH Raised Floor for Semiconductor Sales, Revenue, Price and Gross Margin (2019-2024)
- 7.4.4 SB TECH Raised Floor for Semiconductor Product Offerings
- 7.5 Polygroup
- 7.5.1 Polygroup Company Information
- 7.5.2 Polygroup Introduction and Business Overview
- 7.5.3 Polygroup Raised Floor for Semiconductor Sales, Revenue, Price and Gross Margin (2019-2024)
- 7.5.4 Polygroup Raised Floor for Semiconductor Product Offerings
- 7.6 Gamma Industries
- 7.6.1 Gamma Industries Company Information
- 7.6.2 Gamma Industries Introduction and Business Overview
- 7.6.3 Gamma Industries Raised Floor for Semiconductor Sales, Revenue, Price and Gross Margin (2019-2024)
- 7.6.4 Gamma Industries Raised Floor for Semiconductor Product Offerings
- 7.7 Astra Group
- 7.7.1 Astra Group Company Information
- 7.7.2 Astra Group Introduction and Business Overview
- 7.7.3 Astra Group Raised Floor for Semiconductor Sales, Revenue, Price and Gross Margin (2019-2024)
- 7.7.4 Astra Group Raised Floor for Semiconductor Product Offerings
- 7.8 ZIP ENC
- 7.8.1 ZIP ENC Company Information
- 7.8.2 ZIP ENC Introduction and Business Overview
- 7.8.3 ZIP ENC Raised Floor for Semiconductor Sales, Revenue, Price and Gross Margin (2019-2024)
- 7.8.4 ZIP ENC Raised Floor for Semiconductor Product Offerings
- 7.9 Hemsco
- 7.9.1 Hemsco Company Information
- 7.9.2 Hemsco Introduction and Business Overview
- 7.9.3 Hemsco Raised Floor for Semiconductor Sales, Revenue, Price and Gross Margin (2019-2024)
- 7.9.4 Hemsco Raised Floor for Semiconductor Product Offerings
- 7.10 Exyte Technology
- 7.10.1 Exyte Technology Company Information
- 7.10.2 Exyte Technology Introduction and Business Overview
- 7.10.3 Exyte Technology Raised Floor for Semiconductor Sales, Revenue, Price and Gross Margin (2019-2024)
- 7.10.4 Exyte Technology Raised Floor for Semiconductor Product Offerings
- 7.11 Seo Ho
- 7.11.1 Seo Ho Company Information
- 7.11.2 Seo Ho Introduction and Business Overview
- 7.11.3 Seo Ho Raised Floor for Semiconductor Sales, Revenue, Price and Gross Margin (2019-2024)
- 7.11.4 Seo Ho Raised Floor for Semiconductor Product Offerings
- 7.12 WONKWANG Technique Flooring System
- 7.12.1 WONKWANG Technique Flooring System Company Information
- 7.12.2 WONKWANG Technique Flooring System Introduction and Business Overview
- 7.12.3 WONKWANG Technique Flooring System Raised Floor for Semiconductor Sales, Revenue, Price and Gross Margin (2019-2024)
- 7.12.4 WONKWANG Technique Flooring System Raised Floor for Semiconductor Product Offerings
- 7.13 TMC Vibration Control
- 7.13.1 TMC Vibration Control Company Information
- 7.13.2 TMC Vibration Control Introduction and Business Overview
- 7.13.3 TMC Vibration Control Raised Floor for Semiconductor Sales, Revenue, Price and Gross Margin (2019-2024)
- 7.13.4 TMC Vibration Control Raised Floor for Semiconductor Product Offerings
- 7.14 Ahresty
- 7.14.1 Ahresty Company Information
- 7.14.2 Ahresty Introduction and Business Overview
- 7.14.3 Ahresty Raised Floor for Semiconductor Sales, Revenue, Price and Gross Margin (2019-2024)
- 7.14.4 Ahresty Raised Floor for Semiconductor Product Offerings
- 7.15 NAKA Corporation
- 7.15.1 NAKA Corporation Company Information
- 7.15.2 NAKA Corporation Introduction and Business Overview
- 7.15.3 NAKA Corporation Raised Floor for Semiconductor Sales, Revenue, Price and Gross Margin (2019-2024)
- 7.15.4 NAKA Corporation Raised Floor for Semiconductor Product Offerings
- 7.16 TitanFlor
- 7.16.1 TitanFlor Company Information
- 7.16.2 TitanFlor Introduction and Business Overview
- 7.16.3 TitanFlor Raised Floor for Semiconductor Sales, Revenue, Price and Gross Margin (2019-2024)
- 7.16.4 TitanFlor Raised Floor for Semiconductor Product Offerings
- 7.17 Jiangsu Tonglu Flooring
- 7.17.1 Jiangsu Tonglu Flooring Company Information
- 7.17.2 Jiangsu Tonglu Flooring Introduction and Business Overview
- 7.17.3 Jiangsu Tonglu Flooring Raised Floor for Semiconductor Sales, Revenue, Price and Gross Margin (2019-2024)
- 7.17.4 Jiangsu Tonglu Flooring Raised Floor for Semiconductor Product Offerings
- 7.18 Changzhou Huatong
- 7.18.1 Changzhou Huatong Company Information
- 7.18.2 Changzhou Huatong Introduction and Business Overview
- 7.18.3 Changzhou Huatong Raised Floor for Semiconductor Sales, Revenue, Price and Gross Margin (2019-2024)
- 7.18.4 Changzhou Huatong Raised Floor for Semiconductor Product Offerings
- 7.19 Huilian
- 7.19.1 Huilian Company Information
- 7.19.2 Huilian Introduction and Business Overview
- 7.19.3 Huilian Raised Floor for Semiconductor Sales, Revenue, Price and Gross Margin (2019-2024)
- 7.19.4 Huilian Raised Floor for Semiconductor Product Offerings
- 7.20 Huayi
- 7.20.1 Huayi Company Information
- 7.20.2 Huayi Introduction and Business Overview
- 7.20.3 Huayi Raised Floor for Semiconductor Sales, Revenue, Price and Gross Margin (2019-2024)
- 7.20.4 Huayi Raised Floor for Semiconductor Product Offerings
- 7.21 YENI
- 7.21.1 YENI Company Information
- 7.21.2 YENI Introduction and Business Overview
- 7.21.3 YENI Raised Floor for Semiconductor Sales, Revenue, Price and Gross Margin (2019-2024)
- 7.21.4 YENI Raised Floor for Semiconductor Product Offerings
8 Industry Chain Analysis
- 8.1 Raised Floor for Semiconductor Industrial Chain
- 8.2 Raised Floor for Semiconductor Upstream Analysis
- 8.2.1 Key Raw Materials
- 8.2.2 Raw Materials Key Suppliers
- 8.2.3 Manufacturing Cost Structure
- 8.3 Midstream Analysis
- 8.4 Downstream Analysis (Customers Analysis)
- 8.5 Sales Model and Sales Channels
- 8.5.1 Raised Floor for Semiconductor Sales Model
- 8.5.2 Sales Channel
- 8.5.3 Raised Floor for Semiconductor Distributors
9 Research Findings and Conclusion
10 Appendix
- 10.1 Research Methodology
- 10.1.1 Methodology/Research Approach
- 10.1.2 Data Source
- 10.2 Author Details
- 10.3 Disclaimer
