|
|
市場調査レポート
商品コード
1609534
ペンタンジアミンの世界市場:2024年Global Pentanediamine Market Research Report 2024 |
||||||
|
|||||||
カスタマイズ可能
適宜更新あり
|
|||||||

| ペンタンジアミンの世界市場:2024年 |
|
出版日: 2024年12月11日
発行: QYResearch
ページ情報: 英文 99 Pages
納期: 2~3営業日
|

全表示
- 概要
- 図表
- 目次
世界のペンタンジアミンの市場規模は、2023年に1,282万米ドルとなりました。
同市場は、2024年~2030年の予測期間中に32.85%のCAGRで拡大し、2030年までに8,413万米ドルに達すると予測されています。
ペンタンジアミンの世界の主要メーカーには、Cathay Biotech IncとNing Xia Eppen Biotechが含まれ、2023年には世界の上位2ベンダーが収益の約100%を占めています。
当レポートでは、世界のペンタンジアミン市場について調査し、市場の概要とともに、タイプ別、用途別、地域別の動向、および市場に参入する企業のプロファイルなどを提供しています。
目次
第1章 ペンタンジアミン市場概要
- 製品定義
- ペンタンジアミン、タイプ別
- ペンタンジアミン、用途別
- 世界市場の成長見通し
- 前提と制限
第2章 メーカーによる市場競争
第3章 ペンタンジアミンの生産、地域別
- 世界のペンタンジアミンの生産額予測:2019年対2024年対2030年、地域別
- 世界のペンタンジアミンの生産額:2019年~2030年、地域別
- 世界のペンタンジアミンの生産量予測:2019年対2024年対2030年、地域別
- 世界のペンタンジアミンの生産量:2019年~2030年、地域別
- 世界のペンタンジアミンの市場価格分析:2019年~2024年、地域別
- 世界のペンタンジアミンの生産量と価値、前年比成長率
第4章 ペンタンジアミンの消費量、地域別
- 世界のペンタンジアミンの消費量予測:2019年対2024年対2030年、地域別
- 世界のペンタンジアミンの消費量:2019年~2030年、地域別
- 北米
- 欧州
- アジア太平洋
第5章 用途別セグメント
- ペンタンジアミンの生産量(2019年~2030年)、用途別
- ペンタンジアミンの生産額(2019年~2030年)、用途別
- ペンタンジアミンの価格(2019年~2030年)、用途別
第6章 主要企業のプロファイル
- Cathay Biotech Inc
- Ning Xia Eppen Biotech
- CJ BIO
- Toray Industries
第7章 L-リジン等の直接発酵と酵素変換技術の将来動向
第8章 産業チェーンと販売チャネルの分析
第9章 ペンタンジアミン市場力学
第10章 調査結果と結論
第11章 調査手法とデータソース
List of Tables
- Table 1. Global Pentanediamine Market Value by Application, (US$ Million) & (2023 VS 2030)
- Table 2. Global Pentanediamine Production Capacity (MT) by Manufacturers in 2023
- Table 3. Global Pentanediamine Production by Manufacturers (2019-2024) & (MT)
- Table 4. Global Pentanediamine Production Market Share by Manufacturers (2019-2024)
- Table 5. Global Pentanediamine Production Value by Manufacturers (2019-2024) & (US$ Million)
- Table 6. Global Pentanediamine Production Value Share by Manufacturers (2019-2024)
- Table 7. Global Market Pentanediamine Average Price by Manufacturers (USD/MT) & (2019-2024)
- Table 8. Global Key Manufacturers of Pentanediamine, Manufacturing Base Distribution and Headquarters
- Table 9. Global Key Manufacturers of Pentanediamine, Product Offered and Application
- Table 10. Global Key Manufacturers of Pentanediamine, Date of Enter into This Industry
- Table 11. Mergers & Acquisitions, Expansion Plans
- Table 12. Global Pentanediamine Production Value by Region: 2019 VS 2024 VS 2030 (US$ Million)
- Table 13. Global Pentanediamine Production Value (US$ Million) by Region (2019-2024)
- Table 14. Global Pentanediamine Production Value Market Share by Region (2019-2024)
- Table 15. Global Pentanediamine Production Value (US$ Million) Forecast by Region (2025-2030)
- Table 16. Global Pentanediamine Production Value Market Share Forecast by Region (2025-2030)
- Table 17. Global Pentanediamine Production Comparison by Region: 2019 VS 2024 VS 2030 (MT)
- Table 18. Global Pentanediamine Production (MT) by Region (2019-2024)
- Table 19. Global Pentanediamine Production Market Share by Region (2019-2024)
- Table 20. Global Pentanediamine Production (MT) Forecast by Region (2025-2030)
- Table 21. Global Pentanediamine Production Market Share Forecast by Region (2025-2030)
- Table 22. Global Pentanediamine Market Average Price (USD/MT) by Region (2019-2024)
- Table 23. Global Pentanediamine Market Average Price (USD/MT) by Region (2025-2030)
- Table 24. Global Pentanediamine Consumption Growth Rate by Region: 2019 VS 2024 VS 2030 (MT)
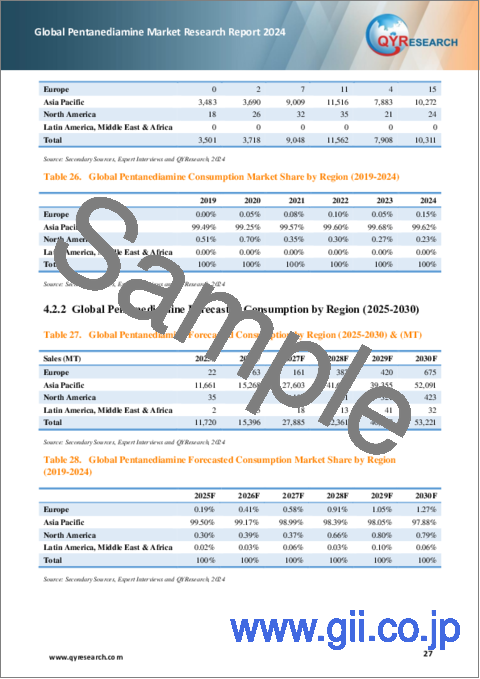
- Table 25. Global Pentanediamine Consumption by Region (2019-2024) & (MT)
- Table 26. Global Pentanediamine Consumption Market Share by Region (2019-2024)
- Table 27. Global Pentanediamine Forecasted Consumption by Region (2025-2030) & (MT)
- Table 28. Global Pentanediamine Forecasted Consumption Market Share by Region (2019-2024)
- Table 29. North America Pentanediamine Consumption Growth Rate by Country: 2019 VS 2024 VS 2030 (MT)
- Table 30. North America Pentanediamine Consumption by Country (2019-2024) & (MT)
- Table 31. North America Pentanediamine Consumption by Country (2025-2030) & (MT)
- Table 32. Europe Pentanediamine Consumption Growth Rate by Country: 2019 VS 2024 VS 2030 (MT)
- Table 33. Europe Pentanediamine Consumption by Country (2019-2024) & (MT)
- Table 34. Europe Pentanediamine Consumption by Country (2025-2030) & (MT)
- Table 35. Asia Pacific Pentanediamine Consumption Growth Rate by Country: 2019 VS 2024 VS 2030 (MT)
- Table 36. Asia Pacific Pentanediamine Consumption by Region (2019-2024) & (MT)
- Table 37. Asia Pacific Pentanediamine Consumption by Region (2025-2030) & (MT)
- Table 38. Global Pentanediamine Production (MT) by Application (2019-2024)
- Table 39. Global Pentanediamine Production (MT) by Application (2025-2030)
- Table 40. Global Pentanediamine Production Market Share by Application (2019-2024)
- Table 41. Global Pentanediamine Production Market Share by Application (2025-2030)
- Table 42. Global Pentanediamine Production Value (US$ Million) by Application (2019-2024)
- Table 43. Global Pentanediamine Production Value (US$ Million) by Application (2025-2030)
- Table 44. Global Pentanediamine Production Value Market Share by Application (2019-2024)
- Table 45. Global Pentanediamine Production Value Market Share by Application (2025-2030)
- Table 46. Global Pentanediamine Price (USD/MT) by Application (2019-2024)
- Table 47. Global Pentanediamine Price (USD/MT) by Application (2025-2030)
- Table 48. Cathay Biotech Inc Pentanediamine Company Information
- Table 49. Cathay Biotech Inc Pentanediamine Specification and Application
- Table 50. Cathay Biotech Inc Pentanediamine Production (MT), Value (US$ Million), Price (USD/MT) and Gross Margin (2019-2024)
- Table 51. Cathay Biotech Inc Main Business and Markets Served
- Table 52. Ning Xia Eppen Biotech Pentanediamine Company Information
- Table 53. Ning Xia Eppen Biotech Pentanediamine Specification and Application
- Table 54. Ning Xia Eppen Biotech Pentanediamine Production (MT), Value (US$ Million), Price (USD/MT) and Gross Margin (2019-2024)
- Table 55. Ning Xia Eppen Biotech Main Business and Markets Served
- Table 56. CJ BIO Pentanediamine Company Information
- Table 57. CJ BIO Pentanediamine Specification and Application
- Table 58. CJ BIO Main Business and Markets Served
- Table 59. Toray Industries Pentanediamine Company Information
- Table 60. Toray Industries Pentanediamine Specification and Application
- Table 61. Toray Industries Main Business and Markets Served
- Table 62. Enzymatic Conversion of L-Lysine Technology Trends
- Table 63. Key Raw Materials Lists
- Table 64. Raw Materials Key Suppliers Lists
- Table 65. Pentanediamine Distributors List
- Table 66. Pentanediamine Customers List
- Table 67. Pentanediamine Market Trends
- Table 68. Pentanediamine Market Drivers
- Table 69. Pentanediamine Market Challenges
- Table 70. Pentanediamine Market Restraints
- Table 71. Research Programs/Design for This Report
- Table 72. Key Data Information from Secondary Sources
- Table 73. Key Data Information from Primary Sources
- Table 74. Authors List of This Report
List of Figures
- Figure 1. Product Picture of Pentanediamine
- Figure 2. Global Pentanediamine Market Value by Application, (US$ Million) & (2023 VS 2030)
- Figure 3. Global Pentanediamine Market Share by Application: 2023 VS 2030
- Figure 4. Bio-based Polyamide
- Figure 5. Chemical Intermediates
- Figure 6. Global Pentanediamine Production Value (US$ Million), 2019 VS 2024 VS 2030
- Figure 7. Global Pentanediamine Production Value (US$ Million) & (2019-2030)
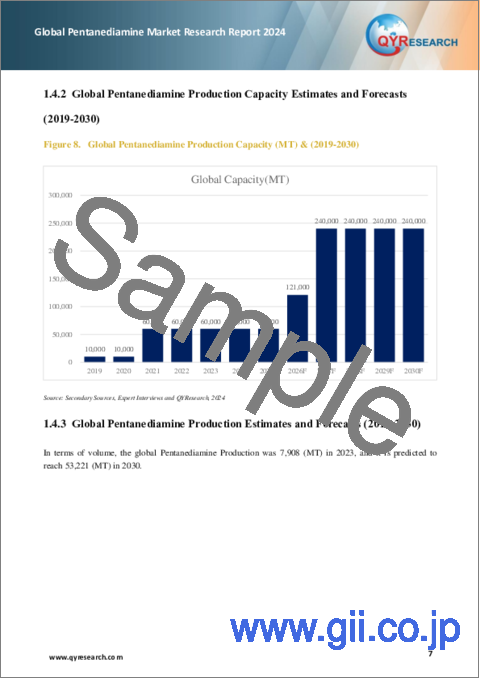
- Figure 8. Global Pentanediamine Production Capacity (MT) & (2019-2030)
- Figure 9. Global Pentanediamine Production (MT) & (2019-2030)
- Figure 10. Global Pentanediamine Average Price (USD/MT) & (2019-2030)
- Figure 11. Pentanediamine Report Years Considered
- Figure 12. Pentanediamine Production Share by Manufacturers in 2023
- Figure 13. Global Pentanediamine Production Value Share by Manufacturers (2023)
- Figure 14. Global Pentanediamine Production Value by Region: 2019 VS 2024 VS 2030 (US$ Million)
- Figure 15. China Pentanediamine Production Value (US$ Million) Growth Rate (2019-2030)
- Figure 16. Global Other Pentanediamine Production Value (US$ Million) Growth Rate (2019-2030)
- Figure 17. North America Pentanediamine Consumption and Growth Rate (2019-2030) & (MT)
- Figure 18. North America Pentanediamine Consumption Market Share by Country (2019-2030)
- Figure 19. U.S. Pentanediamine Consumption and Growth Rate (2019-2030) & (MT)
- Figure 20. Canada Pentanediamine Consumption and Growth Rate (2019-2030) & (MT)
- Figure 21. Mexico Pentanediamine Consumption and Growth Rate (2019-2030) & (MT)
- Figure 22. Europe Pentanediamine Consumption and Growth Rate (2019-2030) & (MT)
- Figure 23. Europe Pentanediamine Consumption Market Share by Country (2019-2030)
- Figure 24. Germany Pentanediamine Consumption and Growth Rate (2019-2030) & (MT)
- Figure 25. France Pentanediamine Consumption and Growth Rate (2019-2030) & (MT)
- Figure 26. U.K. Pentanediamine Consumption and Growth Rate (2019-2030) & (MT)
- Figure 27. Italy Pentanediamine Consumption and Growth Rate (2019-2030) & (MT)
- Figure 28. Spain Pentanediamine Consumption and Growth Rate (2019-2030) & (MT)
- Figure 29. Asia Pacific Pentanediamine Consumption and Growth Rate (2019-2030) & (MT)
- Figure 30. Asia Pacific Pentanediamine Consumption Market Share by Region (2025-2030)
- Figure 31. China Pentanediamine Consumption and Growth Rate (2019-2030) & (MT)
- Figure 32. Japan Pentanediamine Consumption and Growth Rate (2019-2030) & (MT)
- Figure 33. South Korea Pentanediamine Consumption and Growth Rate (2019-2030) & (MT)
- Figure 34. Southeast Asia Pentanediamine Consumption and Growth Rate (2019-2030) & (MT)
- Figure 35. India Pentanediamine Consumption and Growth Rate (2019-2030) & (MT)
- Figure 36. Global Production Market Share of Pentanediamine by Application (2019-2030)
- Figure 37. Global Production Value Market Share of Pentanediamine by Application (2019-2030)
- Figure 38. Pentanediamine Value Chain
- Figure 39. Global Production Capacities of Bioplastics 2022-2028
- Figure 40. Global Production Capacities of Bioplastics 2023 (by material type)
- Figure 41. World Carbon Dioxide Emissions from 1962 to 2023 by region (in million metric tons of carbon dioxide)*
- Figure 42. Bottom-up and Top-down Approaches for This Report
- Figure 43. Data Triangulation
The global Pentanediamine market was valued at US$ 12.82 million in 2023 and is anticipated to reach US$ 84.13 million by 2030, witnessing a CAGR of 32.85% during the forecast period 2024-2030.
The major global manufacturers of Pentanediamine include Cathay Biotech Inc and Ning Xia Eppen Biotech, in 2023, the world's top two vendors accounted for approximately 100 % of the revenue.
This report aims to provide a comprehensive presentation of the global market for Pentanediamine, with both quantitative and qualitative analysis, to help readers develop business/growth strategies, assess the market competitive situation, analyze their position in the current marketplace, and make informed business decisions regarding Pentanediamine.
The Pentanediamine market size, estimations, and forecasts are provided in terms of output/shipments (MT) and revenue ($ millions), considering 2023 as the base year, with history and forecast data for the period from 2019 to 2030. This report segments the global Pentanediamine market comprehensively. Regional market sizes, concerning products by Type, by Application, and by players, are also provided.
For a more in-depth understanding of the market, the report provides profiles of the competitive landscape, key competitors, and their respective market ranks. The report also discusses technological trends and new product developments.
The report will help the Pentanediamine manufacturers, new entrants, and industry chain related companies in this market with information on the revenues, production, and average price for the overall market and the sub-segments across the different segments, by company, by Type, by Application, and by regions.
Market Segmentation
By Company
- Cathay Biotech Inc
- Ning Xia Eppen Biotech
- CJ BIO
- Toray Industries
Segment by Application
- Bio-based Polyamide
- Chemical Intermediates
- Others
Production by Region
- China
- Global Other
Consumption by Region
- North America
- U.S.
- Canada
- Mexico
- Asia-Pacific
- China
- Japan
- Korea
- India
- SEA
- Australia
- Europe
- Germany
- UK
- France
- Italy
- Spain
- Rest of Europe
- Latin America, Middle East & Africa
Table of Contents
1 Pentanediamine Market Overview
- 1.1 Product Definition
- 1.2 Pentanediamine Segment by Type
- 1.3 Pentanediamine by Application
- 1.3.1 Global Pentanediamine Market Value Growth Rate Analysis by Application: 2023 VS 2030
- 1.3.2 Bio-based Polyamide
- 1.3.3 Chemical Intermediates
- 1.4 Global Market Growth Prospects
- 1.4.1 Global Pentanediamine Production Value Estimates and Forecasts (2019-2030)
- 1.4.2 Global Pentanediamine Production Capacity Estimates and Forecasts (2019-2030)
- 1.4.3 Global Pentanediamine Production Estimates and Forecasts (2019-2030)
- 1.4.4 Global Pentanediamine Market Average Price Estimates and Forecasts (2019-2030)
- 1.5 Assumptions and Limitations
2 Market Competition by Manufacturers
- 2.1 Global Pentanediamine Production Market Share by Manufacturers (2019-2024)
- 2.2 Global Pentanediamine Production Value Market Share by Manufacturers (2019-2024)
- 2.3 Global Pentanediamine Market Concentration
- 2.4 Global Pentanediamine Average Price by Manufacturers (2019-2024)
- 2.5 Global Key Manufacturers of Pentanediamine, Manufacturing Base Distribution and Headquarters
- 2.6 Global Key Manufacturers of Pentanediamine, Product Offered and Application
- 2.7 Global Key Manufacturers of Pentanediamine, Date of Enter into This Industry
- 2.8 Mergers & Acquisitions, Expansion
3 Pentanediamine Production by Region
- 3.1 Global Pentanediamine Production Value Estimates and Forecasts by Region: 2019 VS 2024 VS 2030
- 3.2 Global Pentanediamine Production Value by Region (2019-2030)
- 3.2.1 Global Pentanediamine Production Value Market Share by Region (2019-2024)
- 3.2.2 Global Forecasted Production Value of Pentanediamine by Region (2025-2030)
- 3.3 Global Pentanediamine Production Estimates and Forecasts by Region: 2019 VS 2024 VS 2030
- 3.4 Global Pentanediamine Production by Region (2019-2030)
- 3.4.1 Global Pentanediamine Production Market Share by Region (2019-2024)
- 3.4.2 Global Forecasted Production of Pentanediamine by Region (2025-2030)
- 3.5 Global Pentanediamine Market Price Analysis by Region (2019-2024)
- 3.6 Global Pentanediamine Production and Value, Year-over-Year Growth
- 3.6.1 China Pentanediamine Production Value Estimates and Forecasts (2019-2030)
- 3.6.2 Global Other Pentanediamine Production Value Estimates and Forecasts (2019-2030)
4 Pentanediamine Consumption by Region
- 4.1 Global Pentanediamine Consumption Estimates and Forecasts by Region: 2019 VS 2024 VS 2030
- 4.2 Global Pentanediamine Consumption by Region (2019-2030)
- 4.2.1 Global Pentanediamine Consumption by Region (2019-2030)
- 4.2.2 Global Pentanediamine Forecasted Consumption by Region (2025-2030)
- 4.3 North America
- 4.3.1 North America Pentanediamine Consumption Growth Rate by Country: 2019 VS 2024 VS 2030
- 4.3.2 North America Pentanediamine Consumption by Country (2019-2030)
- 4.3.3 U.S.
- 4.3.4 Canada
- 4.3.5 Mexico
- 4.4 Europe
- 4.4.1 Europe Pentanediamine Consumption Growth Rate by Country: 2019 VS 2024 VS 2030
- 4.4.2 Europe Pentanediamine Consumption by Country (2019-2030)
- 4.4.3 Germany
- 4.4.4 France
- 4.4.5 U.K.
- 4.4.6 Italy
- 4.4.7 Spain
- 4.5 Asia Pacific
- 4.5.1 Asia Pacific Pentanediamine Consumption Growth Rate by Country: 2019 VS 2024 VS 2030
- 4.5.2 Asia Pacific Pentanediamine Consumption by Region (2019-2030)
- 4.5.3 China
- 4.5.4 Japan
- 4.5.5 South Korea
- 4.5.6 Southeast Asia
- 4.5.7 India
5 Segment by Application
- 5.1 Global Pentanediamine Production by Application (2019-2030)
- 5.1.1 Global Pentanediamine Production by Application (2019-2024)
- 5.1.2 Global Pentanediamine Production by Application (2025-2030)
- 5.1.3 Global Pentanediamine Production Market Share by Application (2019-2030)
- 5.2 Global Pentanediamine Production Value by Application (2019-2030)
- 5.2.1 Global Pentanediamine Production Value by Application (2019-2024)
- 5.2.2 Global Pentanediamine Production Value by Application (2025-2030)
- 5.2.3 Global Pentanediamine Production Value Market Share by Application (2019-2030)
- 5.3 Global Pentanediamine Price by Application (2019-2030)
6 Key Companies Profiled
- 6.1 Cathay Biotech Inc
- 6.1.1 Cathay Biotech Inc Pentanediamine Company Information
- 6.1.2 Cathay Biotech Inc Pentanediamine Product Portfolio
- 6.1.3 Cathay Biotech Inc Pentanediamine Production, Value, Price and Gross Margin (2019-2024)
- 6.1.4 Cathay Biotech Inc Main Business and Markets Served
- 6.2 Ning Xia Eppen Biotech
- 6.2.1 Ning Xia Eppen Biotech Pentanediamine Company Information
- 6.2.2 Ning Xia Eppen Biotech Pentanediamine Product Portfolio
- 6.2.3 Ning Xia Eppen Biotech Pentanediamine Production, Value, Price and Gross Margin (2019-2024)
- 6.2.4 Ning Xia Eppen Biotech Main Business and Markets Served
- 6.3 CJ BIO
- 6.3.1 CJ BIO Pentanediamine Company Information
- 6.3.2 CJ BIO Pentanediamine Product Portfolio
- 6.3.3 CJ BIO Main Business and Markets Served
- 6.3.4 R&D and Patent Status
- 6.4 Toray Industries
- 6.4.1 Toray Industries Pentanediamine Company Information
- 6.4.2 Toray Industries Pentanediamine Product Portfolio
- 6.4.3 Toray Industries Main Business and Markets Served
- 6.4.4 Toray Industries R&D and Patent Status
7 Direct Fermentation and Enzymatic Conversion of L-Lysine Etc. Technology Future Trends
- 7.1 Direct Fermentation Technology
- 7.2 Enzymatic Conversion of L-Lysine Technology
8 Industry Chain and Sales Channels Analysis
- 8.1 Pentanediamine Industry Chain Analysis
- 8.2 Pentanediamine Key Raw Materials
- 8.2.1 Key Raw Materials
- 8.2.2 Raw Materials Key Suppliers
- 8.3 Pentanediamine Production Mode & Process
- 8.4 Pentanediamine Sales and Marketing
- 8.4.1 Pentanediamine Sales Channels
- 8.4.2 Pentanediamine Distributors
- 8.5 Pentanediamine Customers
9 Pentanediamine Market Dynamics
- 9.1 Pentanediamine Industry Trends
- 9.2 Pentanediamine Market Drivers
- 9.3 Pentanediamine Market Challenges
- 9.4 Pentanediamine Market Restraints
10 Research Findings and Conclusion
11 Methodology and Data Source
- 11.1 Methodology/Research Approach
- 11.1.1 Research Programs/Design
- 11.1.2 Market Size Estimation
- 11.1.3 Market Breakdown and Data Triangulation
- 11.2 Data Source
- 11.2.1 Secondary Sources
- 11.2.2 Primary Sources
- 11.3 Author List
- 11.4 Disclaimer

