|
|
市場調査レポート
商品コード
1507729
重希土類の世界市場:市場シェアおよびランキング・全体の売上および需要予測 (2024-2030年)Heavy Rare Earth Elements- Global Market Share and Ranking, Overall Sales and Demand Forecast 2024-2030 |
||||||
|
|||||||
カスタマイズ可能
適宜更新あり
|
|||||||

| 重希土類の世界市場:市場シェアおよびランキング・全体の売上および需要予測 (2024-2030年) |
|
出版日: 2024年07月05日
発行: QYResearch
ページ情報: 英文 138 Pages
納期: 2~3営業日
|

全表示
- 概要
- 図表
- 目次
世界の重希土類の市場規模は、2023年の15億6,454万米ドルから、予測期間中は6.43%のCAGRで推移し、2030年には23億3,337万米ドルの規模に成長すると予測されています。
北米市場は、2023年の3億3,273万米ドルから、CAGR 6.35%で推移し、2030年には4億8,921万米ドルに達すると予測されています。アジア太平洋市場は、2023年の9億7,957万米ドルから、CAGR 6.79%で推移し、2030年には14億9,804万米ドルに達すると予測されています。欧州市場は、2023年の2億2,612万米ドルから、CAGR 5.09%で推移し、2030年には3億1,160万米ドルに達すると予測されています。
重希土類の世界の主要企業3社は2023年に約72.80%の収益シェアを示しました。
当レポートでは、世界の重希土類の市場を調査し、市場および製品の概要、市場成長への各種影響因子の分析、市場規模の推移・予測、タイプ・用途、地域・主要国など各種区分別の詳細分析、競合環境、市場シェア、ランキング、主要企業のプロファイルなどをまとめています。
目次
第1章 市場概要
- 重希土類:製品概要
- 世界市場の予測
- 販売額の推移・予測
- 販売量の推移・予測
- 販売価格の推移・予測
- 市場動向と促進要因
- 産業の動向
- 市場促進要因と機会
- 市場の課題
- 市場抑制要因
- 前提と制限
- 調査目的
- 調査年数
第2章 競合分析:企業別
- 企業の収益ランキング
- 収益:企業別
- 企業の販売量ランキング
- 販売量:企業別
- 平均価格:企業別
- 主要製造業者:製造拠点・本社
- 主要製造業者:提供製品
- 主要製造業者:設立日
- 競合分析
- M&A合併と買収、拡大
- 業界の最新ニュース
第3章 タイプ別の分類
- イントロダクション:タイプ別
- ガドリニウム
- イットリウム
- テルビウム
- ジスプロシウム
- ホルミウム
- エルビウム
- ツリウム
- イッテルビウム
- ルテチウム
- 世界の販売額
- 販売額:2019年 vs 2023年 vs 2030年
- 販売額の推移・予測
- 販売額の推移・予測 (%)
- 世界の販売量
- 販売量:2019年 vs 2023年 vs 2030年
- 販売量の推移・予測
- 販売量の推移・予測 (%)
- 平均価格の推移・予測
第4章 用途別の分類
- イントロダクション:用途別
- 磁石
- 触媒
- 冶金
- 研磨
- ガラス
- 蛍光体
- セラミックス
- 世界の販売額
- 販売額:2019年 vs 2023年 vs 2030年
- 販売額の推移・予測
- 販売額の推移・予測 (%)
- 世界の販売量
- 販売量:2019年 vs 2023年 vs 2030年
- 販売量の推移・予測
- 販売量の推移・予測 (%)
- 平均価格の推移・予測
第5章 地域別の分類
- 世界の販売額
- 販売額:2019年 vs 2023年 vs 2030年
- 販売額の推移・予測
- 販売額の推移・予測 (%)
- 世界の販売量
- 販売量:2019年 vs 2023年 vs 2030年
- 販売量の推移・予測
- 販売量の推移・予測 (%)
- 平均価格の推移・予測
- 北米
- 欧州
- アジア太平洋
- 南米
- 中東・アフリカ
第6章 主要国/地域別の分類
- 主販売額の成長動向:2019年 vs 2023年 vs 2030年
- 販売額・販売量の推移・予測
- 米国
- 欧州
- 中国
- 日本
- 韓国
- 東南アジア
- インド
第7章 企業プロファイル
- China Rare Earth Group
- Shenghe Resources Holdings
- Xiamen Tungsten Industry
- Northern Minerals
第8章 産業チェーン分析
- 産業分析
- 上流分析
- 中流分析
- 下流分析(顧客分析)
第9章 調査結果・総論
第10章 付録
List of Tables
- Table 1. Heavy Rare Earth Elements Market Trends
- Table 2. Heavy Rare Earth Elements Market Drivers & Opportunity
- Table 3. Heavy Rare Earth Elements Market Challenges
- Table 4. Heavy Rare Earth Elements Market Restraints
- Table 5. Global Heavy Rare Earth Elements Revenue by Company (2019-2024) & (US$ Million)
- Table 6. Global Heavy Rare Earth Elements Revenue Market Share by Company (2019-2024)
- Table 7. Global Heavy Rare Earth Elements Sales Volume by Company (2019-2024) & (MT)
- Table 8. Global Heavy Rare Earth Elements Sales Volume Market Share by Company (2019-2024)
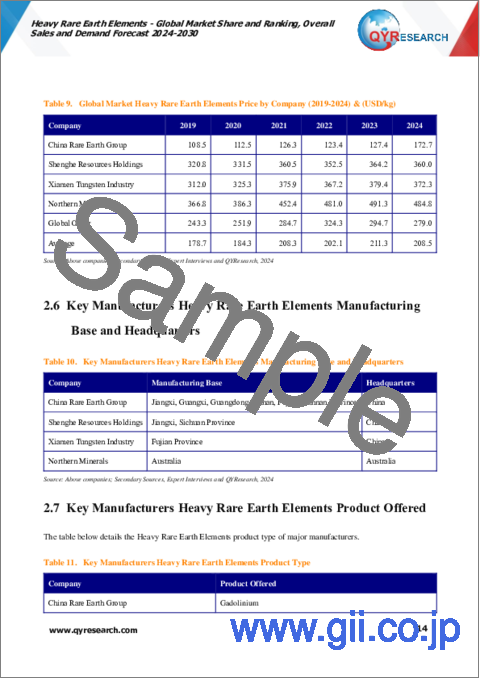
- Table 9. Global Market Heavy Rare Earth Elements Price by Company (2019-2024) & (USD/kg)
- Table 10. Key Manufacturers Heavy Rare Earth Elements Manufacturing Base and Headquarters
- Table 11. Key Manufacturers Heavy Rare Earth Elements Product Type
- Table 12. Key Manufacturers Time to Established
- Table 13. Global Heavy Rare Earth Elements Manufacturers Market Concentration Ratio (CR5)
- Table 14. Global Top Manufacturers Market Share by Company Type (Tier 1, Tier 2, and Tier 3) & (based on the Revenue in Heavy Rare Earth Elements as of 2023)
- Table 15. Mergers & Acquisitions, Expansion Plans
- Table 16. Mergers & Acquisitions, Expansion Plans
- Table 17. Gadolinium Applications
- Table 18. Global Heavy Rare Earth Elements Sales Value by Type: 2019 VS 2023 VS 2030 (US$ Million)
- Table 19. Global Heavy Rare Earth Elements Sales Value by Type (2019-2024) & (US$ Million)
- Table 20. Global Heavy Rare Earth Elements Sales Value by Type (2025-2030) & (US$ Million)
- Table 21. Global Heavy Rare Earth Elements Sales Market Share in Value by Type (2019-2024)
- Table 22. Global Heavy Rare Earth Elements Sales Market Share in Value by Type (2025-2030)
- Table 23. Global Heavy Rare Earth Elements Sales Volume by Type: 2019 VS 2023 VS 2030 (MT)
- Table 24. Global Heavy Rare Earth Elements Sales Volume by Type (2019-2024) & (MT)
- Table 25. Global Heavy Rare Earth Elements Sales Volume by Type (2025-2030) & (MT)
- Table 26. Global Heavy Rare Earth Elements Sales Market Share in Volume by Type (2019-2024)
- Table 27. Global Heavy Rare Earth Elements Sales Market Share in Volume by Type (2025-2030)
- Table 28. Global Heavy Rare Earth Elements Price by Type (2019-2024) & (USD/kg)
- Table 29. Global Heavy Rare Earth Elements Price by Type (2025-2030) & (USD/kg)
- Table 30. Global Heavy Rare Earth Elements Sales Value by Application: 2019 VS 2023 VS 2030 (US$ Million)
- Table 31. Global Heavy Rare Earth Elements Sales Value by Application (2019-2024) & (US$ Million)
- Table 32. Global Heavy Rare Earth Elements Sales Value by Application (2025-2030) & (US$ Million)
- Table 33. Global Heavy Rare Earth Elements Sales Market Share in Value by Application (2019-2024)
- Table 34. Global Heavy Rare Earth Elements Sales Market Share in Value by Application (2025-2030)
- Table 35. Global Heavy Rare Earth Elements Sales Volume by Application: 2019 VS 2023 VS 2030 (MT)
- Table 36. Global Heavy Rare Earth Elements Sales Volume by Application (2019-2024) & (MT)
- Table 37. Global Heavy Rare Earth Elements Sales Volume by Application (2025-2030) & (MT)
- Table 38. Global Heavy Rare Earth Elements Sales Market Share in Volume by Application (2019-2024)
- Table 39. Global Heavy Rare Earth Elements Sales Market Share in Volume by Application (2025-2030)
- Table 40. Global Heavy Rare Earth Elements Price by Application (2019-2024) & (USD/kg)
- Table 41. Global Heavy Rare Earth Elements Price by Application (2025-2030) & (USD/kg)
- Table 42. Global Heavy Rare Earth Elements Sales Value by Region, (2019 VS 2023 VS 2030) & (US$ Million)
- Table 43. Global Heavy Rare Earth Elements Sales Value by Region (2019-2024) & (US$ Million)
- Table 44. Global Heavy Rare Earth Elements Sales Value by Region (2025-2030) & (US$ Million)
- Table 45. Global Heavy Rare Earth Elements Sales Value by Region (2019-2024) & (%)
- Table 46. Global Heavy Rare Earth Elements Sales Value by Region (2025-2030) & (%)
- Table 47. Global Heavy Rare Earth Elements Sales Volume by Region (MT): 2019 VS 2023 VS 2030
- Table 48. Global Heavy Rare Earth Elements Sales Volume by Region (2019-2024) & (MT)
- Table 49. Global Heavy Rare Earth Elements Sales Volume by Region (2025-2030) & (MT)
- Table 50. Global Heavy Rare Earth Elements Sales Volume by Region (2019-2024) & (%)
- Table 51. Global Heavy Rare Earth Elements Sales Volume by Region (2025-2030) & (%)
- Table 52. Global Heavy Rare Earth Elements Average Price by Region (2019-2024) & (USD/kg)
- Table 53. Global Heavy Rare Earth Elements Average Price by Region (2025-2030) & (USD/kg)
- Table 54. Key Countries/Regions Heavy Rare Earth Elements Sales Value Growth Trends, (US$ Million): 2019 VS 2023 VS 2030
- Table 55. Key Countries/Regions Heavy Rare Earth Elements Sales Value, (2019-2024) & (US$ Million)
- Table 56. Key Countries/Regions Heavy Rare Earth Elements Sales Value, (2025-2030) & (US$ Million)
- Table 57. Key Countries/Regions Heavy Rare Earth Elements Sales Volume, (2019-2024) & (MT)
- Table 58. Key Countries/Regions Heavy Rare Earth Elements Sales Volume, (2025-2030) & (MT)
- Table 59. China Rare Earth Group Company Information
- Table 60. China Rare Earth Group Introduction and Business Overview
- Table 61. China Rare Earth Group Heavy Rare Earth Elements Sales (MT), Revenue (US$ Million), Price (USD/kg) and Gross Margin (2019-2024)
- Table 62. China Rare Earth Group Heavy Rare Earth Elements Product Offerings
- Table 63. Shenghe Resources Holdings Company Information
- Table 64. Shenghe Resources Holdings Introduction and Business Overview
- Table 65. Shenghe Resources Holdings Heavy Rare Earth Elements Sales (MT), Revenue (US$ Million), Price (USD/kg) and Gross Margin (2019-2024)
- Table 66. Shenghe Resources Holdings Heavy Rare Earth Elements Product Offerings
- Table 67. Xiamen Tungsten Industry Company Information
- Table 68. Xiamen Tungsten Industry Introduction and Business Overview
- Table 69. Xiamen Tungsten Industry Heavy Rare Earth Elements Sales (MT), Revenue (US$ Million), Price (USD/kg) and Gross Margin (2019-2024)
- Table 70. Xiamen Tungsten Industry Heavy Rare Earth Elements Product Offerings
- Table 71. Northern Minerals Company Information
- Table 72. Northern Minerals Introduction and Business Overview
- Table 73. Northern Minerals Heavy Rare Earth Elements Sales (MT), Revenue (US$ Million), Price (USD/kg) and Gross Margin (2019-2024)
- Table 74. Northern Minerals Heavy Rare Earth Elements Product Offerings
- Table 75. Key Raw Materials Lists
- Table 76. Raw Materials Key Suppliers Lists
- Table 77. Heavy Rare Earth Elements Downstream Customers
- Table 78. Research Programs/Design for This Report
- Table 79. Key Data Information from Secondary Sources
- Table 80. Key Data Information from Primary Sources
List of Figures
- Figure 1. Heavy Rare Earth Elements Product Picture
- Figure 2. Global Heavy Rare Earth Elements Sales Value, 2019 VS 2024 VS 2030 (US$ Million)
- Figure 3. Global Heavy Rare Earth Elements Sales Value (2019-2030) & (US$ Million)
- Figure 4. Global Heavy Rare Earth Elements Sales Volume (2019-2030) & (MT)
- Figure 5. Global Heavy Rare Earth Elements Sales Price (2019-2030) & (USD/kg)
- Figure 6. Heavy Rare Earth Elements Report Years Considered
- Figure 7. Global Heavy Rare Earth Elements Players Revenue Ranking (2023) & (US$ Million)
- Figure 8. Global Heavy Rare Earth Elements Players Sales Volume Ranking (2023) & (MT)
- Figure 9. The 3 Largest Manufacturers in the World: Market Share by Heavy Rare Earth Elements Revenue in 2023
- Figure 10. Gadolinium Picture
- Figure 11. Yttrium Picture
- Figure 12. Terbium Picture
- Figure 13. Dysprosium Picture
- Figure 14. Holmium Picture
- Figure 15. Erbium Picture
- Figure 16. Thulium Picture
- Figure 17. Ytterbium Picture
- Figure 18. Lutetium Picture
- Figure 19. Global Heavy Rare Earth Elements Sales Value by Type (2019 VS 2023 VS 2030) & (US$ Million)
- Figure 20. Global Heavy Rare Earth Elements Sales Value Market Share by Type, 2023 & 2030
- Figure 21. Global Heavy Rare Earth Elements Sales Volume by Type (2019 VS 2023 VS 2030) & (MT)
- Figure 22. Global Heavy Rare Earth Elements Sales Volume Market Share by Type, 2023 & 2030
- Figure 23. Global Heavy Rare Earth Elements Sales Value by Application (2019 VS 2023 VS 2030) & (US$ Million)
- Figure 24. Global Heavy Rare Earth Elements Sales Value Market Share by Application, 2023 & 2030
- Figure 25. Global Heavy Rare Earth Elements Sales Volume by Application (2019 VS 2023 VS 2030) & (MT)
- Figure 26. Global Heavy Rare Earth Elements Sales Volume Market Share by Application, 2023 & 2030
- Figure 27. North America Heavy Rare Earth Elements Sales Value (2019-2030) & (US$ Million)
- Figure 28. North America Heavy Rare Earth Elements Sales Value by Country (%), 2023 VS 2030
- Figure 29. Europe Heavy Rare Earth Elements Sales Value, (2019-2030) & (US$ Million)
- Figure 30. Europe Heavy Rare Earth Elements Sales Value by Country (%), 2023 VS 2030
- Figure 31. Asia Pacific Heavy Rare Earth Elements Sales Value, (2019-2030) & (US$ Million)
- Figure 32. Asia Pacific Heavy Rare Earth Elements Sales Value by Region (%), 2023 VS 2030
- Figure 33. South America Heavy Rare Earth Elements Sales Value, (2019-2030) & (US$ Million)
- Figure 34. South America Heavy Rare Earth Elements Sales Value by Country (%), 2023 VS 2030
- Figure 35. Middle East & Africa Heavy Rare Earth Elements Sales Value, (2019-2030) & (US$ Million)
- Figure 36. Middle East & Africa Heavy Rare Earth Elements Sales Value by Country (%), 2023 VS 2030
- Figure 37. United States Heavy Rare Earth Elements Sales Value, (2019-2030) & (US$ Million)
- Figure 38. United States Heavy Rare Earth Elements Sales Value by Type (%), 2023 VS 2030
- Figure 39. United States Heavy Rare Earth Elements Sales Value by Application (%), 2023 VS 2030
- Figure 40. Europe Heavy Rare Earth Elements Sales Value, (2019-2030) & (US$ Million)
- Figure 41. Europe Heavy Rare Earth Elements Sales Value by Type (%), 2023 VS 2030
- Figure 42. Europe Heavy Rare Earth Elements Sales Value by Application (%), 2023 VS 2030
- Figure 43. China Heavy Rare Earth Elements Sales Value, (2019-2030) & (US$ Million)
- Figure 44. China Heavy Rare Earth Elements Sales Value by Type (%), 2023 VS 2030
- Figure 45. China Heavy Rare Earth Elements Sales Value by Application (%), 2023 VS 2030
- Figure 46. Japan Heavy Rare Earth Elements Sales Value, (2019-2030) & (US$ Million)
- Figure 47. Japan Heavy Rare Earth Elements Sales Value by Type (%), 2023 VS 2030
- Figure 48. Japan Heavy Rare Earth Elements Sales Value by Application (%), 2023 VS 2030
- Figure 49. South Korea Heavy Rare Earth Elements Sales Value, (2019-2030) & (US$ Million)
- Figure 50. South Korea Heavy Rare Earth Elements Sales Value by Type (%), 2023 VS 2030
- Figure 51. South Korea Heavy Rare Earth Elements Sales Value by Application (%), 2023 VS 2030
- Figure 52. Southeast Asia Heavy Rare Earth Elements Sales Value, (2019-2030) & (US$ Million)
- Figure 53. Southeast Asia Heavy Rare Earth Elements Sales Value by Type (%), 2023 VS 2030
- Figure 54. Southeast Asia Heavy Rare Earth Elements Sales Value by Application (%), 2023 VS 2030
- Figure 55. India Heavy Rare Earth Elements Sales Value, (2019-2030) & (US$ Million)
- Figure 56. India Heavy Rare Earth Elements Sales Value by Type (%), 2023 VS 2030
- Figure 57. India Heavy Rare Earth Elements Sales Value by Application (%), 2023 VS 2030
- Figure 58. Estimated Rare-earth Reserves
- Figure 59. Heavy Rare Earth Elements Manufacturing Cost Structure in 2023
- Figure 60. Bottom-up and Top-down Approaches for This Report
- Figure 61. Data Triangulation
- Figure 62. Key Executives Interviewed
The global market for Heavy Rare Earth Elements was worth US$ 1,564.54 million in 2023 and is forecast to a readjusted size of US$ 2,333.37 million by 2030 with a CAGR of 6.43% during the forecast period 2024-2030.
North American market for Heavy Rare Earth Elements was valued at $ 332.73 million in 2023 and will reach $ 489.21 million by 2030, at a CAGR of 6.35% during the forecast period of 2024 through 2030.
Asia-Pacific market for Heavy Rare Earth Elements was valued at $ 979.57 million in 2023 and will reach $ 1,498.04 million by 2030, at a CAGR of 6.79% during the forecast period of 2024 through 2030.
Europe market for Heavy Rare Earth Elements was valued at $ 226.12 million in 2023 and will reach $ 311.60 million by 2030, at a CAGR of 5.09% during the forecast period of 2024 through 2030.
The global key companies of Heavy Rare Earth Elements include China Rare Earth Group, Shenghe Resources Holdings, Xiamen Tungsten Industry, Northern Minerals, etc. In 2023, the global three largest players hold a share approximately 72.80% in terms of revenue.
This report aims to provide a comprehensive presentation of the global market for Heavy Rare Earth Elements, focusing on the total sales volume, sales revenue, price, key companies market share and ranking, together with an analysis of Heavy Rare Earth Elements by region & country, by Type, and by Application.
The Heavy Rare Earth Elements market size, estimations, and forecasts are provided in terms of sales volume (MT) and sales revenue ($ millions), considering 2023 as the base year, with history and forecast data for the period from 2019 to 2030. With both quantitative and qualitative analysis, to help readers develop business/growth strategies, assess the market competitive situation, analyse their position in the current marketplace, and make informed business decisions regarding Heavy Rare Earth Elements.
Market Segmentation
By Company
- China Rare Earth Group
- Shenghe Resources Holdings
- Xiamen Tungsten Industry
- Northern Minerals
Segment by Type
- Gadolinium
- Yttrium
- Terbium
- Dysprosium
- Holmium
- Erbium
- Thulium
- Ytterbium
- Lutetium
Segment by Application
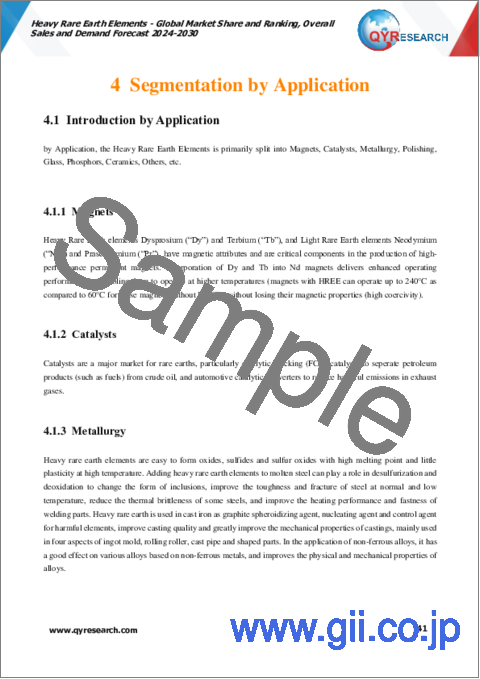
- Magnets
- Catalysts
- Metallurgy
- Polishing
- Glass
- Phosphors
- Ceramics
- Others
By Region
- North America
- United States
- Canada
- Asia-Pacific
- China
- Japan
- South Korea
- Southeast Asia
- India
- Australia
- Rest of Asia-Pacific
- Europe
- Germany
- France
- U.K.
- Italy
- Russia
- Rest of Europe
- Latin America
- Mexico
- Brazil
- Rest of Latin America
- Middle East & Africa
- Middle East
- Africa
Table of Contents
1 Market Overview
- 1.1 Heavy Rare Earth Elements Product Introduction
- 1.2 Global Heavy Rare Earth Elements Market Size Forecast
- 1.2.1 Global Heavy Rare Earth Elements Sales Value (2019-2030)
- 1.2.2 Global Heavy Rare Earth Elements Sales Volume (2019-2030)
- 1.2.3 Global Heavy Rare Earth Elements Sales Price (2019-2030)
- 1.3 Heavy Rare Earth Elements Market Trends & Drivers
- 1.3.1 Heavy Rare Earth Elements Industry Trends
- 1.3.2 Heavy Rare Earth Elements Market Drivers & Opportunity
- 1.3.3 Heavy Rare Earth Elements Market Challenges
- 1.3.4 Heavy Rare Earth Elements Market Restraints
- 1.4 Assumptions and Limitations
- 1.5 Study Objectives
- 1.6 Years Considered
2 Competitive Analysis by Company
- 2.1 Global Heavy Rare Earth Elements Players Revenue Ranking (2023)
- 2.2 Global Heavy Rare Earth Elements Revenue by Company (2019-2024)
- 2.3 Global Heavy Rare Earth Elements Players Sales Volume Ranking (2023)
- 2.4 Global Heavy Rare Earth Elements Sales Volume by Company Players (2019-2024)
- 2.5 Global Heavy Rare Earth Elements Average Price by Company (2019-2024)
- 2.6 Key Manufacturers Heavy Rare Earth Elements Manufacturing Base and Headquarters
- 2.7 Key Manufacturers Heavy Rare Earth Elements Product Offered
- 2.8 Key Manufacturers Time to Established
- 2.9 Heavy Rare Earth Elements Market Competitive Analysis
- 2.9.1 Heavy Rare Earth Elements Market Concentration Rate (2019-2024)
- 2.9.2 Global 3 Largest Manufacturers by Heavy Rare Earth Elements Revenue in 2023
- 2.9.3 Global Top Manufacturers by Company Type (Tier 1, Tier 2, and Tier 3) & (based on the Revenue in Heavy Rare Earth Elements as of 2023)
- 2.10 Mergers & Acquisitions, Expansion
- 2.11 Industry Recent News
3 Segmentation by Type
- 3.1 Introduction by Type
- 3.1.1 Gadolinium
- 3.1.2 Yttrium
- 3.1.3 Terbium
- 3.1.4 Dysprosium
- 3.1.5 Holmium
- 3.1.6 Erbium
- 3.1.7 Thulium
- 3.1.8 Ytterbium
- 3.1.9 Lutetium
- 3.2 Global Heavy Rare Earth Elements Sales Value by Type
- 3.2.1 Global Heavy Rare Earth Elements Sales Value by Type (2019 VS 2023 VS 2030)
- 3.2.2 Global Heavy Rare Earth Elements Sales Value, by Type (2019-2030)
- 3.2.3 Global Heavy Rare Earth Elements Sales Value, by Type (%) (2019-2030)
- 3.3 Global Heavy Rare Earth Elements Sales Volume by Type
- 3.3.1 Global Heavy Rare Earth Elements Sales Volume by Type (2019 VS 2023 VS 2030)
- 3.3.2 Global Heavy Rare Earth Elements Sales Volume, by Type (2019-2030)
- 3.3.3 Global Heavy Rare Earth Elements Sales Volume, by Type (%) (2019-2030)
- 3.4 Global Heavy Rare Earth Elements Average Price by Type (2019-2030)
4 Segmentation by Application
- 4.1 Introduction by Application
- 4.1.1 Magnets
- 4.1.2 Catalysts
- 4.1.3 Metallurgy
- 4.1.4 Polishing
- 4.1.5 Glass
- 4.1.6 Phosphors
- 4.1.7 Ceramics
- 4.2 Global Heavy Rare Earth Elements Sales Value by Application
- 4.2.1 Global Heavy Rare Earth Elements Sales Value by Application (2019 VS 2023 VS 2030)
- 4.2.2 Global Heavy Rare Earth Elements Sales Value, by Application (2019-2030)
- 4.2.3 Global Heavy Rare Earth Elements Sales Value, by Application (%) (2019-2030)
- 4.3 Global Heavy Rare Earth Elements Sales Volume by Application
- 4.3.1 Global Heavy Rare Earth Elements Sales Volume by Application (2019 VS 2023 VS 2030)
- 4.3.2 Global Heavy Rare Earth Elements Sales Volume, by Application (2019-2030)
- 4.3.3 Global Heavy Rare Earth Elements Sales Volume, by Application (%) (2019-2030)
- 4.4 Global Heavy Rare Earth Elements Average Price by Application (2019-2030)
5 Segmentation by Region
- 5.1 Global Heavy Rare Earth Elements Sales Value by Region
- 5.1.1 Global Heavy Rare Earth Elements Sales Value by Region: 2019 VS 2023 VS 2030
- 5.1.2 Global Heavy Rare Earth Elements Sales Value by Region (2019-2024)
- 5.1.3 Global Heavy Rare Earth Elements Sales Value by Region (2025-2030)
- 5.1.4 Global Heavy Rare Earth Elements Sales Value by Region (%), (2019-2030)
- 5.2 Global Heavy Rare Earth Elements Sales Volume by Region
- 5.2.1 Global Heavy Rare Earth Elements Sales Volume by Region: 2019 VS 2023 VS 2030
- 5.2.2 Global Heavy Rare Earth Elements Sales Volume by Region (2019-2024)
- 5.2.3 Global Heavy Rare Earth Elements Sales Volume by Region (2025-2030)
- 5.2.4 Global Heavy Rare Earth Elements Sales Volume by Region (%), (2019-2030)
- 5.3 Global Heavy Rare Earth Elements Average Price by Region (2019-2030)
- 5.4 North America
- 5.4.1 North America Heavy Rare Earth Elements Sales Value, 2019-2030
- 5.4.2 North America Heavy Rare Earth Elements Sales Value by Country (%), 2023 VS 2030
- 5.5 Europe
- 5.5.1 Europe Heavy Rare Earth Elements Sales Value, 2019-2030
- 5.5.2 Europe Heavy Rare Earth Elements Sales Value by Country (%), 2023 VS 2030
- 5.6 Asia Pacific
- 5.6.1 Asia Pacific Heavy Rare Earth Elements Sales Value, 2019-2030
- 5.6.2 Asia Pacific Heavy Rare Earth Elements Sales Value by Region (%), 2023 VS 2030
- 5.7 South America
- 5.7.1 South America Heavy Rare Earth Elements Sales Value, 2019-2030
- 5.7.2 South America Heavy Rare Earth Elements Sales Value by Country (%), 2023 VS 2030
- 5.8 Middle East & Africa
- 5.8.1 Middle East & Africa Heavy Rare Earth Elements Sales Value, 2019-2030
- 5.8.2 Middle East & Africa Heavy Rare Earth Elements Sales Value by Country (%), 2023 VS 2030
6 Segmentation by Key Countries/Regions
- 6.1 Key Countries/Regions Heavy Rare Earth Elements Sales Value Growth Trends, 2019 VS 2023 VS 2030
- 6.2 Key Countries/Regions Heavy Rare Earth Elements Sales Value
- 6.2.1 Key Countries/Regions Heavy Rare Earth Elements Sales Value, 2019-2030
- 6.2.2 Key Countries/Regions Heavy Rare Earth Elements Sales Volume, 2019-2030
- 6.3 United States
- 6.3.1 United States Heavy Rare Earth Elements Sales Value, 2019-2030
- 6.3.2 United States Heavy Rare Earth Elements Sales Value by Type (%), 2023 VS 2030
- 6.3.3 United States Heavy Rare Earth Elements Sales Value by Application, 2023 VS 2030
- 6.4 Europe
- 6.4.1 Europe Heavy Rare Earth Elements Sales Value, 2019-2030
- 6.4.2 Europe Heavy Rare Earth Elements Sales Value by Type (%), 2023 VS 2030
- 6.4.3 Europe Heavy Rare Earth Elements Sales Value by Application, 2023 VS 2030
- 6.5 China
- 6.5.1 China Heavy Rare Earth Elements Sales Value, 2019-2030
- 6.5.2 China Heavy Rare Earth Elements Sales Value by Type (%), 2023 VS 2030
- 6.5.3 China Heavy Rare Earth Elements Sales Value by Application, 2023 VS 2030
- 6.6 Japan
- 6.6.1 Japan Heavy Rare Earth Elements Sales Value, 2019-2030
- 6.6.2 Japan Heavy Rare Earth Elements Sales Value by Type (%), 2023 VS 2030
- 6.6.3 Japan Heavy Rare Earth Elements Sales Value by Application, 2023 VS 2030
- 6.7 South Korea
- 6.7.1 South Korea Heavy Rare Earth Elements Sales Value, 2019-2030
- 6.7.2 South Korea Heavy Rare Earth Elements Sales Value by Type (%), 2023 VS 2030
- 6.7.3 South Korea Heavy Rare Earth Elements Sales Value by Application, 2023 VS 2030
- 6.8 Southeast Asia
- 6.8.1 Southeast Asia Heavy Rare Earth Elements Sales Value, 2019-2030
- 6.8.2 Southeast Asia Heavy Rare Earth Elements Sales Value by Type (%), 2023 VS 2030
- 6.8.3 Southeast Asia Heavy Rare Earth Elements Sales Value by Application, 2023 VS 2030
- 6.9 India
- 6.9.1 India Heavy Rare Earth Elements Sales Value, 2019-2030
- 6.9.2 India Heavy Rare Earth Elements Sales Value by Type (%), 2023 VS 2030
- 6.9.3 India Heavy Rare Earth Elements Sales Value by Application, 2023 VS 2030
7 Company Profiles
- 7.1 China Rare Earth Group
- 7.1.1 China Rare Earth Group Company Information
- 7.1.2 China Rare Earth Group Introduction and Business Overview
- 7.1.3 China Rare Earth Group Heavy Rare Earth Elements Sales, Revenue, Price and Gross Margin (2019-2024)
- 7.1.4 China Rare Earth Group Heavy Rare Earth Elements Product Offerings
- 7.2 Shenghe Resources Holdings
- 7.2.1 Shenghe Resources Holdings Company Information
- 7.2.2 Shenghe Resources Holdings Introduction and Business Overview
- 7.2.3 Shenghe Resources Holdings Heavy Rare Earth Elements Sales, Revenue, Price and Gross Margin (2019-2024)
- 7.2.4 Shenghe Resources Holdings Heavy Rare Earth Elements Product Offerings
- 7.3 Xiamen Tungsten Industry
- 7.3.1 Xiamen Tungsten Industry Company Information
- 7.3.2 Xiamen Tungsten Industry Introduction and Business Overview
- 7.3.3 Xiamen Tungsten Industry Heavy Rare Earth Elements Sales, Revenue, Price and Gross Margin (2019-2024)
- 7.3.4 Xiamen Tungsten Industry Heavy Rare Earth Elements Product Offerings
- 7.4 Northern Minerals
- 7.4.1 Northern Minerals Company Information
- 7.4.2 Northern Minerals Introduction and Business Overview
- 7.4.3 Northern Minerals Heavy Rare Earth Elements Sales, Revenue, Price and Gross Margin (2019-2024)
- 7.4.4 Northern Minerals Heavy Rare Earth Elements Product Offerings
8 Industry Chain Analysis
- 8.1 Rare Earth Mineral Industry Analysis
- 8.2 Heavy Rare Earth Elements Upstream Analysis
- 8.2.1 Key Raw Materials
- 8.2.2 Raw Materials Key Suppliers
- 8.2.3 Manufacturing Cost Structure
- 8.3 Midstream Analysis
- 8.4 Downstream Analysis (Customers Analysis)
9 Research Findings and Conclusion
10 Appendix
- 10.1 Research Methodology
- 10.1.1 Methodology/Research Approach
- 10.1.2 Data Source
- 10.2 Author Details
- 10.3 Disclaimer
