|
|
市場調査レポート
商品コード
1462819
非住宅用IPインターホンの世界市場:2024年Global Non-residential IP Intercom Market Research Report 2024 |
||||||
|
|||||||
カスタマイズ可能
適宜更新あり
|
|||||||

| 非住宅用IPインターホンの世界市場:2024年 |
|
出版日: 2024年04月13日
発行: QYResearch
ページ情報: 英文 114 Pages
納期: 2~3営業日
|

全表示
- 概要
- 図表
- 目次
世界の非住宅用IPインターホンの市場規模は、2023年の9億9,950万米ドルから、予測期間中は8.93%のCAGRで推移し、2030年には18億2,090万米ドルに達すると予測されています。
当レポートでは、世界の非住宅用IPインターホンの市場を調査し、市場および製品の概要、競合情勢、市場規模の推移・予測、各種区分・地域/主要国別の詳細分析、価格動向、市場成長への各種影響因子の分析、主要企業の分析などをまとめています。
目次
第1章 非住宅用IPインターホン:市場概要
- 製品の定義
- 非住宅用IPインターホン:タイプ別
- 非住宅用IPインターホン:用途別
- 成長率分析:用途別:2023年 vs 2030年
- 商用
- 政府
- 産業
- その他のセキュリティエリア
- 世界市場の成長見通し
- 製造額の推移・予測
- 製造数の推移・予測
- 平均価格推定・予測
- 前提と制限
第2章 市場競争:製造業者別
- 製造数の市場シェア:製造業者別
- 製造額の市場シェア:製造業者別
- 世界の主要企業:業界ランキング
- 市場シェア:企業タイプ別
- 平均価格:製造業者別
- 世界の主要製造業者:サービスエリア・本社
- 世界市場の競合情勢・動向
- M&A・拡大
第3章 非住宅用IPインターホンの製造動向:地域別
- 製造額の推定・予測:2019年 vs 2023年 vs 2030年
- 製造額の推移・予測・市場シェア
- 製造数の推定・予測:2019年 vs 2023年 vs 2030年
- 製造数の推移・予測・市場シェア
- 市場価格分析
- 製造額・製造数・前年比成長率
- 北米
- 欧州
- 中国
- 日本
第4章 非住宅用IPインターホンの消費動向:地域別
- 消費数の推移・予測:2019年 vs 2023年 vs 2030年
- 消費数の推移・予測:地域別
- 北米
- 欧州
- アジア太平洋
- ラテンアメリカ
第5章 タイプ別セグメント
- 世界の製造数の推移・予測・市場シェア
- 世界の製造額の推移・予測・市場シェア
- 世界の価格の推移・予測
第6章 用途別セグメント
- 世界の製造数の推移・予測・市場シェア
- 世界の製造額の推移・予測・市場シェア
- 世界の価格の推移・予測
第7章 主要企業の概要
- Axis Communications
- Barix
- TCS AG
- Legrand
- Commend
- TOA Electronics
- Zenitel
- Koontech
- GAI-Tronics
- Satec
第8章 産業チェーンと販売チャネルの分析
- 業界チェーン分析
- 主要原材料
- 販売およびマーケティング
- 顧客
第9章 非住宅用IPインターホン:市場力学
- 産業動向
- 市場促進要因
- 市場課題・制約
第10章 調査結果・総論
第11章 調査手法・データソース
List of Tables
- Table 1. Global Non-residential IP Intercom Market Value by Type, (US$ Million) & (2023 VS 2030)
- Table 2. Global Non-residential IP Intercom Market Value by Application, (US$ Million) & (2023 VS 2030)
- Table 3. Global Non-residential IP Intercom Production by Manufacturers (2020-2024) & (K Units)
- Table 4. Global Non-residential IP Intercom Production Market Share by Manufacturers (2020-2024)
- Table 5. Global Non-residential IP Intercom Production Value by Manufacturers (2020-2024) & (US$ Million)
- Table 6. Global Non-residential IP Intercom Production Value Share by Manufacturers (2020-2024)
- Table 7. Global Key Players of Non-residential IP Intercom, Industry Ranking in 2023
- Table 8. Global Company Type (Tier 1, Tier 2, and Tier 3) & (based on the Production Value in Non-residential IP Intercom as of 2023)
- Table 9. Global Market Non-residential IP Intercom Average Price by Manufacturers (US$/Unit) & (2019-2024)
- Table 10. Global Key Manufacturers of Non-residential IP Intercom, Area Served & Headquarters
- Table 11. Global Non-residential IP Intercom Manufacturers Market Concentration Ratio (CR5)
- Table 12. Mergers & Acquisitions, Expansion Plans
- Table 13. Global Non-residential IP Intercom Production Value Growth Rate by Region: 2019 VS 2023 VS 2030 (US$ Million)
- Table 14. Global Non-residential IP Intercom Production Value (US$ Million) by Region (2019-2024)
- Table 15. Global Non-residential IP Intercom Production Value Market Share by Region (2019-2024)
- Table 16. Global Non-residential IP Intercom Production Value (US$ Million) Forecast by Region (2025-2030)
- Table 17. Global Non-residential IP Intercom Production Value Market Share Forecast by Region (2025-2030)
- Table 18. Global Non-residential IP Intercom Production Comparison by Region: 2019 VS 2023 VS 2030 (K Units)
- Table 19. Global Non-residential IP Intercom Production (K Units) by Region (2019-2024)
- Table 20. Global Non-residential IP Intercom Production Market Share by Region (2019-2024)
- Table 21. Global Non-residential IP Intercom Production (K Units) Forecast by Region (2025-2030)
- Table 22. Global Non-residential IP Intercom Production Market Share Forecast by Region (2025-2030)
- Table 23. Global Non-residential IP Intercom Market Average Price (US$/Unit) by Region (2019-2024)
- Table 24. Global Non-residential IP Intercom Market Average Price (US$/Unit) by Region (2025-2030)
- Table 25. Global Non-residential IP Intercom Consumption Growth Rate by Region: 2019 VS 2023 VS 2030 (K Units)
- Table 26. Global Non-residential IP Intercom Consumption by Region (2019-2024) & (K Units)
- Table 27. Global Non-residential IP Intercom Consumption Market Share by Region (2019-2024)
- Table 28. Global Non-residential IP Intercom Forecasted Consumption by Region (2025-2030) & (K Units)
- Table 29. Global Non-residential IP Intercom Forecasted Consumption Market Share by Region (2019-2024)
- Table 30. North America Non-residential IP Intercom Consumption Growth Rate by Country: 2019 VS 2023 VS 2030 (K Units)
- Table 31. North America Non-residential IP Intercom Consumption by Country (2019-2024) & (K Units)
- Table 32. North America Non-residential IP Intercom Consumption by Country (2025-2030) & (K Units)
- Table 33. Europe Non-residential IP Intercom Consumption Growth Rate by Country: 2019 VS 2023 VS 2030 (K Units)
- Table 34. Europe Non-residential IP Intercom Consumption by Country (2019-2024) & (K Units)
- Table 35. Europe Non-residential IP Intercom Consumption by Country (2025-2030) & (K Units)
- Table 36. Asia Pacific Non-residential IP Intercom Consumption Growth Rate by Country: 2019 VS 2023 VS 2030 (K Units)
- Table 37. Asia Pacific Non-residential IP Intercom Consumption by Region (2019-2024) & (K Units)
- Table 38. Asia Pacific Non-residential IP Intercom Consumption by Region (2025-2030) & (K Units)
- Table 39. Latin America Non-residential IP Intercom Consumption Growth Rate by Country: 2019 VS 2023 VS 2030 (K Units)
- Table 40. Latin America Non-residential IP Intercom Consumption by Country (2019-2024) & (K Units)
- Table 41. Latin America Non-residential IP Intercom Consumption by Country (2025-2030) & (K Units)
- Table 42. Global Non-residential IP Intercom Production (K Units) by Type (2019-2024)
- Table 43. Global Non-residential IP Intercom Production (K Units) by Type (2025-2030)
- Table 44. Global Non-residential IP Intercom Production Market Share by Type (2019-2024)
- Table 45. Global Non-residential IP Intercom Production Market Share by Type (2025-2030)
- Table 46. Global Non-residential IP Intercom Production Value (US$ Million) by Type (2019-2024)
- Table 47. Global Non-residential IP Intercom Production Value (US$ Million) by Type (2025-2030)
- Table 48. Global Non-residential IP Intercom Production Value Market Share by Type (2019-2024)
- Table 49. Global Non-residential IP Intercom Production Value Market Share by Type (2025-2030)
- Table 50. Global Non-residential IP Intercom Price (US$/Unit) by Type (2019-2024)
- Table 51. Global Non-residential IP Intercom Price (US$/Unit) by Type (2025-2030)
- Table 52. Global Non-residential IP Intercom Production (K Units) by Application (2019-2024)
- Table 53. Global Non-residential IP Intercom Production (K Units) by Application (2025-2030)
- Table 54. Global Non-residential IP Intercom Production Market Share by Application (2019-2024)
- Table 55. Global Non-residential IP Intercom Production Market Share by Application (2025-2030)
- Table 56. Global Non-residential IP Intercom Production Value (US$ Million) by Application (2019-2024)
- Table 57. Global Non-residential IP Intercom Production Value (US$ Million) by Application (2025-2030)
- Table 58. Global Non-residential IP Intercom Production Value Market Share by Application (2019-2024)
- Table 59. Global Non-residential IP Intercom Production Value Market Share by Application (2025-2030)
- Table 60. Global Non-residential IP Intercom Price (US$/Unit) by Application (2019-2024)
- Table 61. Global Non-residential IP Intercom Price (US$/Unit) by Application (2025-2030)
- Table 62. Axis Communications Non-residential IP Intercom Corporation Information
- Table 63. Axis Communications Non-residential IP Intercom Product Information
- Table 64. Axis Communications Non-residential IP Intercom Production (K Units), Revenue (US$ Million), Price (USD/Unit) and Gross Margin (2020-2024)
- Table 65. Barix Non-residential IP Intercom Corporation Information
- Table 66. Barix Non-residential IP Intercom Product Information
- Table 67. Barix Non-residential IP Intercom Production (K Units), Revenue (US$ Million), Price (USD/Unit) and Gross Margin (2020-2024)
- Table 68. TCS AG Non-residential IP Intercom Corporation Information
- Table 69. TCS AG Non-residential IP Intercom Product Information
- Table 70. TCS AG Non-residential IP Intercom Production (K Units), Revenue (US$ Million), Price (USD/Unit) and Gross Margin (2020-2024)
- Table 71. Legrand Non-residential IP Intercom Corporation Information
- Table 72. Legrand Non-residential IP Intercom Production (K Units), Revenue (US$ Million), Price (USD/Unit) and Gross Margin (2020-2024)
- Table 73. Commend Non-residential IP Intercom Corporation Information
- Table 74. Commend Non-residential IP Intercom Product Information
- Table 75. Commend Non-residential IP Intercom Production (K Units), Revenue (US$ Million), Price (USD/Unit) and Gross Margin (2020-2024)
- Table 76. TOA Electronics Non-residential IP Intercom Corporation Information
- Table 77. TOA Electronics Non-residential IP Intercom Product Information
- Table 78. TOA Electronics Non-residential IP Intercom Production (K Units), Revenue (US$ Million), Price (USD/Unit) and Gross Margin (2020-2024)
- Table 79. Zenitel Non-residential IP Intercom Corporation Information
- Table 80. Zenitel Non-residential IP Intercom Product Information
- Table 81. Zenitel Non-residential IP Intercom Production (K Units), Revenue (US$ Million), Price (USD/Unit) and Gross Margin (2020-2024)
- Table 82. Koontech Non-residential IP Intercom Corporation Information
- Table 83. Koontech Non-residential IP Intercom Product Information
- Table 84. Koontech Non-residential IP Intercom Production (K Units), Revenue (US$ Million), Price (USD/Unit) and Gross Margin (2020-2024)
- Table 85. GAI-Tronics Non-residential IP Intercom Corporation Information
- Table 86. GAI-Tronics Non-residential IP Intercom Product Information
- Table 87. GAI-Tronics Non-residential IP Intercom Production (K Units), Revenue (US$ Million), Price (USD/Unit) and Gross Margin (2020-2024)
- Table 88. Satec Non-residential IP Intercom Corporation Information
- Table 89. Satec Non-residential IP Intercom Product Information
- Table 90. Satec Non-residential IP Intercom Production (K Units), Revenue (US$ Million), Price (USD/Unit) and Gross Margin (2020-2024)
- Table 91. Raw Materials Key Suppliers Lists
- Table 92. Non-residential IP Intercom Distributors List
- Table 93. Non-residential IP Intercom Customers List
- Table 94. Non-residential IP Intercom Market Trends
- Table 95. Non-residential IP Intercom Market Drivers
- Table 96. Non-residential IP Intercom Market Challenges and Restraints
- Table 97. Research Programs/Design for This Report
- Table 98. Key Data Information from Secondary Sources
- Table 99. Key Data Information from Primary Sources
- Table 100. Authors List of This Report
List of Figures
- Figure 1. Global Non-residential IP Intercom Market Value by Type, (US$ Million) & (2019-2030)
- Figure 2. Global Non-residential IP Intercom Market Share by Type: 2023 VS 2030
- Figure 3. Global Non-residential IP Intercom Market Value by Application, (US$ Million) & (2019-2030)
- Figure 4. Global Non-residential IP Intercom Market Share by Application: 2023 VS 2030
- Figure 5. Global Non-residential IP Intercom Production Value (US$ Million), 2019 VS 2023 VS 2030
- Figure 6. Global Non-residential IP Intercom Production Value (US$ Million) & (2019-2030)
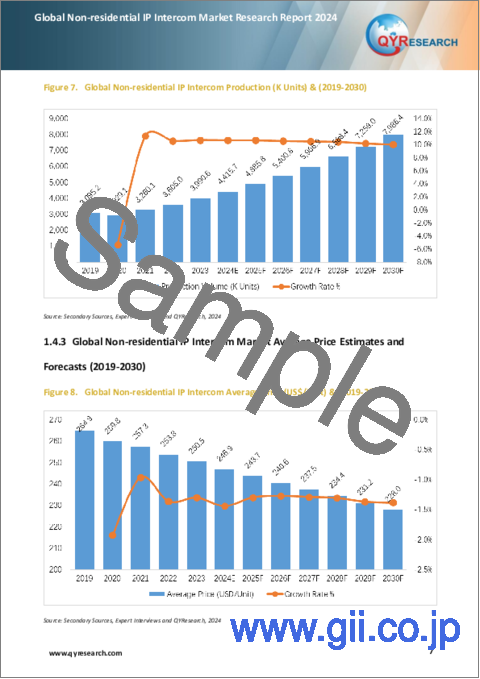
- Figure 7. Global Non-residential IP Intercom Production (K Units) & (2019-2030)
- Figure 8. Global Non-residential IP Intercom Average Price (US$/Unit) & (2019-2030)
- Figure 9. Non-residential IP Intercom Report Years Considered
- Figure 10. Non-residential IP Intercom Production Share by Manufacturers in 2023
- Figure 11. Non-residential IP Intercom Production Value Share by Manufacturers in 2023
- Figure 12. The Global 5 Largest Players: Market Share by Non-residential IP Intercom Revenue in 2023
- Figure 13. The Global 10 Largest Players: Market Share by Non-residential IP Intercom Revenue in 2023
- Figure 14. Global Non-residential IP Intercom Production Value Comparison by Region: 2019-2030 (US$ Million)
- Figure 15. Global Non-residential IP Intercom Production Comparison by Region: 2019 -2030 (K Units)
- Figure 16. North America Non-residential IP Intercom Production Value (US$ Million) Growth Rate (2019-2030)
- Figure 17. Europe Non-residential IP Intercom Production Value (US$ Million) Growth Rate (2019-2030)
- Figure 18. China Non-residential IP Intercom Production Value (US$ Million) Growth Rate (2019-2030)
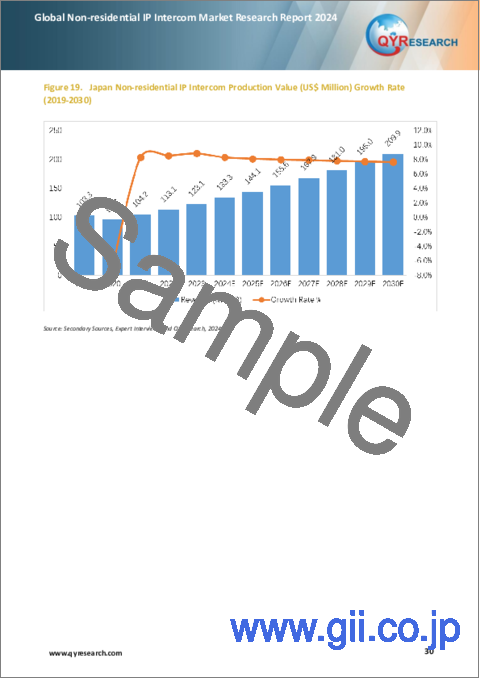
- Figure 19. Japan Non-residential IP Intercom Production Value (US$ Million) Growth Rate (2019-2030)
- Figure 20. Global Non-residential IP Intercom Consumption by Region: 2019-2030 (K Units)
- Figure 21. Global Non-residential IP Intercom Consumption Market Share by Region: 2019-2030
- Figure 22. North America Non-residential IP Intercom Consumption and Growth Rate (2019-2030) & (K Units)
- Figure 23. U.S. Non-residential IP Intercom Consumption and Growth Rate (2019-2030) & (K Units)
- Figure 24. Canada Non-residential IP Intercom Consumption and Growth Rate (2019-2030) & (K Units)
- Figure 25. Europe Non-residential IP Intercom Consumption and Growth Rate (2019-2030) & (K Units)
- Figure 26. Germany Non-residential IP Intercom Consumption and Growth Rate (2019-2030) & (K Units)
- Figure 27. France Non-residential IP Intercom Consumption and Growth Rate (2019-2030) & (K Units)
- Figure 28. U.K. Non-residential IP Intercom Consumption and Growth Rate (2019-2030) & (K Units)
- Figure 29. Russia Non-residential IP Intercom Consumption and Growth Rate (2019-2030) & (K Units)
- Figure 30. Italy Non-residential IP Intercom Consumption and Growth Rate (2019-2030) & (K Units)
- Figure 31. Asia Pacific Non-residential IP Intercom Consumption and Growth Rate (2019-2030) & (K Units)
- Figure 32. China Non-residential IP Intercom Consumption and Growth Rate (2019-2030) & (K Units)
- Figure 33. Japan Non-residential IP Intercom Consumption and Growth Rate (2019-2030) & (K Units)
- Figure 34. South Korea Non-residential IP Intercom Consumption and Growth Rate (2019-2030) & (K Units)
- Figure 35. Southeast Asia Non-residential IP Intercom Consumption and Growth Rate (2019-2030) & (K Units)
- Figure 36. India Non-residential IP Intercom Consumption and Growth Rate (2019-2030) & (K Units)
- Figure 37. Australia Non-residential IP Intercom Consumption and Growth Rate (2019-2030) & (K Units)
- Figure 38. Latin America Non-residential IP Intercom Consumption and Growth Rate (2019-2030) & (K Units)
- Figure 39. Brazil Non-residential IP Intercom Consumption and Growth Rate (2019-2030) & (K Units)
- Figure 40. Mexico Non-residential IP Intercom Consumption and Growth Rate (2019-2030) & (K Units)
- Figure 41. Global Production Market Share of Non-residential IP Intercom by Type (2019-2030)
- Figure 42. Global Production Value Market Share of Non-residential IP Intercom by Type (2019-2030)
- Figure 43. Global Production Market Share of Non-residential IP Intercom by Application (2019-2030)
- Figure 44. Global Production Value Market Share of Non-residential IP Intercom by Application (2019-2030)
- Figure 45. Legrand Non-residential IP Intercom Product Information
- Figure 46. Non-residential IP Intercom Value Chain
- Figure 47. Bottom-up and Top-down Approaches for This Report
- Figure 48. Data Triangulation
The global Non-residential IP Intercom market was valued at US$ 999.5 million in 2023 and is anticipated to reach US$ 1,820.9 million by 2030, witnessing a CAGR of 8.93% during the forecast period 2024-2030.
Report Scope
This report aims to provide a comprehensive presentation of the global market for Non-residential IP Intercom, with both quantitative and qualitative analysis, to help readers develop business/growth strategies, assess the market competitive situation, analyze their position in the current marketplace, and make informed business decisions regarding Non-residential IP Intercom.
The Non-residential IP Intercom market size, estimations, and forecasts are provided in terms of output/shipments (K Units) and revenue ($ millions), considering 2023 as the base year, with history and forecast data for the period from 2019 to 2030. This report segments the global Non-residential IP Intercom market comprehensively. Regional market sizes, concerning products by Type, by Application, and by players, are also provided.
For a more in-depth understanding of the market, the report provides profiles of the competitive landscape, key competitors, and their respective market ranks. The report also discusses technological trends and new product developments.
The report will help the Non-residential IP Intercom manufacturers, new entrants, and industry chain related companies in this market with information on the revenues, production, and average price for the overall market and the sub-segments across the different segments, by company, by Type, by Application, and by regions.
Market Segmentation
By Company
- Axis Communications
- Barix
- TCS AG
- Legrand
- Commend
- TOA Electronics
- Zenitel
- Koontech
- GAI-Tronics (Hubbell)
- Satec
by Type
- Visible
- Invisible
by Application
- Commercial
- Government
- Industrial
- Other Security Area
Production by Region
- North America
- Europe
- China
- Japan
- Asia Other
- Rest of World
Consumption by Region
- North America
- U.S.
- Canada
Asia-Pacific
- China
- Japan
- Korea
- India
- Southeast Asia
- Australia
- Rest of Asia-Pacific
Europe
- Germany
- France
- U.K.
- Italy
- Russia
- Rest of Europe
South America
- Mexico
- Brazil
- Rest of South America
Rest of World
Chapter Outline:
Chapter 1: Introduces the report scope of the report, executive summary of different market segments (by region, by Type, by Application, etc), including the market size of each market segment, future development potential, and so on.
Chapter 2: Detailed analysis of Non-residential IP Intercom manufacturers competitive landscape, price, production and value market share, latest development plan, merger, and acquisition information, etc.
Chapter 3: Production/output, value of Non-residential IP Intercom by region/country. It provides a quantitative analysis of the market size and development potential of each region in the next six years.
Chapter 4: Consumption of Non-residential IP Intercom in regional level and country level. It provides a quantitative analysis of the market size and development potential of each region and its main countries and introduces the market development, future development prospects, market space, and production of each country in the world.
Chapter 5: Provides the analysis of various market segments by Type, covering the market size and development potential of each market segment, to help readers find the blue ocean market in different market segments.
Chapter 6: Provides the analysis of various market segments by Application, covering the market size and development potential of each market segment, to help readers find the blue ocean market in different downstream markets.
Chapter 7: Provides profiles of key players, introducing the basic situation of the main companies in the market in detail, including product production/output, value, price, gross margin, product introduction, etc.
Chapter 8: Analysis of industrial chain, including the upstream and downstream of the industry.
Chapter 9: Introduces the market dynamics, latest developments of the market, the driving factors and restrictive factors of the market, the challenges and risks faced by manufacturers in the industry, and the analysis of relevant policies in the industry.
Chapter 10: The main points and conclusions of the report.
Table of Contents
1 Non-residential IP Intercom Market Overview
- 1.1 Product Definition
- 1.2 Non-residential IP Intercom by Type
- 1.3 Non-residential IP Intercom by Application
- 1.3.1 Global Non-residential IP Intercom Market Value Growth Rate Analysis by Application: 2023 VS 2030
- 1.3.2 Commercial
- 1.3.3 Government
- 1.3.4 Industrial
- 1.3.5 Other Security Area
- 1.4 Global Market Growth Prospects
- 1.4.1 Global Non-residential IP Intercom Production Value Estimates and Forecasts (2019-2030)
- 1.4.2 Global Non-residential IP Intercom Production Estimates and Forecasts (2019-2030)
- 1.4.3 Global Non-residential IP Intercom Market Average Price Estimates and Forecasts (2019-2030)
- 1.5 Assumptions and Limitations
2 Market Competition by Manufacturers
- 2.1 Global Non-residential IP Intercom Production Market Share by Manufacturers (2020-2024)
- 2.2 Global Non-residential IP Intercom Production Value Market Share by Manufacturers (2020-2024)
- 2.3 Global Key Players of Non-residential IP Intercom, Industry Ranking in 2023
- 2.4 Global Non-residential IP Intercom Market Share by Company Type (Tier 1, Tier 2, and Tier 3)
- 2.5 Global Non-residential IP Intercom Average Price by Manufacturers (2020-2024)
- 2.6 Global Key Manufacturers of Non-residential IP Intercom, Area Served & Headquarters
- 2.7 Global Non-residential IP Intercom Market Competitive Situation and Trends
- 2.7.1 Global Non-residential IP Intercom Market Concentration Rate
- 2.7.2 Global 5 and 10 Largest Non-residential IP Intercom Players Market Share by Revenue
- 2.8 Mergers & Acquisitions, Expansion
3 Non-residential IP Intercom Production by Region
- 3.1 Global Non-residential IP Intercom Production Value Estimates and Forecasts by Region: 2019 VS 2023 VS 2030
- 3.2 Global Non-residential IP Intercom Production Value by Region (2019-2030)
- 3.2.1 Global Non-residential IP Intercom Production Value Market Share by Region (2019-2024)
- 3.2.2 Global Forecasted Production Value of Non-residential IP Intercom by Region (2025-2030)
- 3.3 Global Non-residential IP Intercom Production Estimates and Forecasts by Region: 2019 VS 2023 VS 2030
- 3.4 Global Non-residential IP Intercom Production by Region (2019-2030)
- 3.4.1 Global Non-residential IP Intercom Production Market Share by Region (2019-2024)
- 3.4.2 Global Forecasted Production of Non-residential IP Intercom by Region (2025-2030)
- 3.5 Global Non-residential IP Intercom Market Price Analysis by Region (2019-2024)
- 3.6 Global Non-residential IP Intercom Production and Value, Year-over-Year Growth
- 3.6.1 North America Non-residential IP Intercom Production Value Estimates and Forecasts (2019-2030)
- 3.6.2 Europe Non-residential IP Intercom Production Value Estimates and Forecasts (2019-2030)
- 3.6.3 China Non-residential IP Intercom Production Value Estimates and Forecasts (2019-2030)
- 3.6.4 Japan Non-residential IP Intercom Production Value Estimates and Forecasts (2019-2030)
4 Non-residential IP Intercom Consumption by Region
- 4.1 Global Non-residential IP Intercom Consumption Estimates and Forecasts by Region: 2019 VS 2023 VS 2030
- 4.2 Global Non-residential IP Intercom Consumption by Region (2019-2030)
- 4.2.1 Global Non-residential IP Intercom Consumption by Region (2019-2030)
- 4.2.2 Global Non-residential IP Intercom Forecasted Consumption by Region (2025-2030)
- 4.3 North America
- 4.3.1 North America Non-residential IP Intercom Consumption Growth Rate by Country: 2019 VS 2023 VS 2030
- 4.3.2 North America Non-residential IP Intercom Consumption by Country (2019-2030)
- 4.3.3 U.S.
- 4.3.4 Canada
- 4.4 Europe
- 4.4.1 Europe Non-residential IP Intercom Consumption Growth Rate by Country: 2019 VS 2023 VS 2030
- 4.4.2 Europe Non-residential IP Intercom Consumption by Country (2019-2030)
- 4.4.3 Germany
- 4.4.4 France
- 4.4.5 U.K.
- 4.4.6 Russia
- 4.4.7 Italy
- 4.5 Asia Pacific
- 4.5.1 Asia Pacific Non-residential IP Intercom Consumption Growth Rate by Country: 2019 VS 2023 VS 2030
- 4.5.2 Asia Pacific Non-residential IP Intercom Consumption by Region (2019-2030)
- 4.5.3 China
- 4.5.4 Japan
- 4.5.5 South Korea
- 4.5.6 Southeast Asia
- 4.5.7 India
- 4.5.8 Australia
- 4.6 Latin America
- 4.6.1 Latin America Non-residential IP Intercom Consumption Growth Rate by Country: 2019 VS 2023 VS 2030
- 4.6.2 Latin America Non-residential IP Intercom Consumption by Country (2019-2030)
- 4.6.3 Brazil
- 4.6.4 Mexico
5 Segment by Type
- 5.1 Global Non-residential IP Intercom Production by Type (2019-2030)
- 5.1.1 Global Non-residential IP Intercom Production by Type (2019-2024)
- 5.1.2 Global Non-residential IP Intercom Production by Type (2025-2030)
- 5.1.3 Global Non-residential IP Intercom Production Market Share by Type (2019-2030)
- 5.2 Global Non-residential IP Intercom Production Value by Type (2019-2030)
- 5.2.1 Global Non-residential IP Intercom Production Value by Type (2019-2024)
- 5.2.2 Global Non-residential IP Intercom Production Value by Type (2025-2030)
- 5.2.3 Global Non-residential IP Intercom Production Value Market Share by Type (2019-2030)
- 5.3 Global Non-residential IP Intercom Price by Type (2019-2030)
6 Segment by Application
- 6.1 Global Non-residential IP Intercom Production by Application (2019-2030)
- 6.1.1 Global Non-residential IP Intercom Production by Application (2019-2024)
- 6.1.2 Global Non-residential IP Intercom Production by Application (2025-2030)
- 6.1.3 Global Non-residential IP Intercom Production Market Share by Application (2019-2030)
- 6.2 Global Non-residential IP Intercom Production Value by Application (2019-2030)
- 6.2.1 Global Non-residential IP Intercom Production Value by Application (2019-2024)
- 6.2.2 Global Non-residential IP Intercom Production Value by Application (2025-2030)
- 6.2.3 Global Non-residential IP Intercom Production Value Market Share by Application (2019-2030)
- 6.3 Global Non-residential IP Intercom Price by Application (2019-2030)
7 Key Companies Profiled
- 7.1 Axis Communications
- 7.1.1 Axis Communications Non-residential IP Intercom Corporation Information
- 7.1.2 Axis Communications Non-residential IP Intercom Product Information
- 7.1.3 Axis Communications Non-residential IP Intercom Production, Revenue, Price and Gross Margin (2020-2024)
- 7.2 Barix
- 7.2.1 Barix Non-residential IP Intercom Corporation Information
- 7.2.2 Barix Non-residential IP Intercom Product Information
- 7.2.3 Barix Non-residential IP Intercom Production, Revenue, Price and Gross Margin (2020-2024)
- 7.3 TCS AG
- 7.3.1 TCS AG Non-residential IP Intercom Corporation Information
- 7.3.2 TCS AG Non-residential IP Intercom Product Information
- 7.3.3 TCS AG Non-residential IP Intercom Production, Revenue, Price and Gross Margin (2020-2024)
- 7.4 Legrand
- 7.4.1 Legrand Non-residential IP Intercom Corporation Information
- 7.4.2 Legrand Non-residential IP Intercom Product Information
- 7.4.3 Legrand Non-residential IP Intercom Production, Revenue, Price and Gross Margin (2020-2024)
- 7.5 Commend
- 7.5.1 Commend Non-residential IP Intercom Corporation Information
- 7.5.2 Commend Non-residential IP Intercom Product Information
- 7.5.3 Commend Non-residential IP Intercom Production, Revenue, Price and Gross Margin (2020-2024)
- 7.6 TOA Electronics
- 7.6.1 TOA Electronics Non-residential IP Intercom Corporation Information
- 7.6.2 TOA Electronics Non-residential IP Intercom Product Information
- 7.6.3 TOA Electronics Non-residential IP Intercom Production, Revenue, Price and Gross Margin (2020-2024)
- 7.7 Zenitel
- 7.7.1 Zenitel Non-residential IP Intercom Corporation Information
- 7.7.2 Zenitel Non-residential IP Intercom Product Information
- 7.7.3 Zenitel Non-residential IP Intercom Production, Revenue, Price and Gross Margin (2020-2024)
- 7.8 Koontech
- 7.8.1 Koontech Non-residential IP Intercom Corporation Information
- 7.8.2 Koontech Non-residential IP Intercom Product Information
- 7.8.3 Koontech Non-residential IP Intercom Production, Revenue, Price and Gross Margin (2020-2024)
- 7.9 GAI-Tronics
- 7.9.1 GAI-Tronics Non-residential IP Intercom Corporation Information
- 7.9.2 GAI-Tronics Non-residential IP Intercom Product Information
- 7.9.3 GAI-Tronics Non-residential IP Intercom Production, Revenue, Price and Gross Margin (2020-2024)
- 7.10 Satec
- 7.10.1 Satec Non-residential IP Intercom Corporation Information
- 7.10.2 Satec Non-residential IP Intercom Product Information
- 7.10.3 Satec Non-residential IP Intercom Production, Revenue, Price and Gross Margin (2020-2024)
8 Industry Chain and Sales Channels Analysis
- 8.1 Non-residential IP Intercom Industry Chain Analysis
- 8.2 Non-residential IP Intercom Key Raw Materials
- 8.2.1 Raw Materials Key Suppliers
- 8.3 Non-residential IP Intercom Sales and Marketing
- 8.3.1 Non-residential IP Intercom Sales Channels
- 8.3.2 Non-residential IP Intercom Distributors
- 8.4 Non-residential IP Intercom Customers
9 Non-residential IP Intercom Market Dynamics
- 9.1 Non-residential IP Intercom Industry Trends
- 9.2 Non-residential IP Intercom Market Drivers
- 9.3 Non-residential IP Intercom Market Challenges and Restraints
10 Research Findings and Conclusion
11 Methodology and Data Source
- 11.1 Methodology/Research Approach
- 11.1.1 Research Programs/Design
- 11.1.2 Market Size Estimation
- 11.1.3 Market Breakdown and Data Triangulation
- 11.2 Data Source
- 11.2.1 Secondary Sources
- 11.2.2 Primary Sources
- 11.3 Author List
- 11.4 Disclaimer

