|
|
市場調査レポート
商品コード
1462814
サイバーレンジの世界市場、実績と予測(2019年~2030年)Global Cyber Range Market Report, History and Forecast 2019-2030 |
||||||
|
|||||||
カスタマイズ可能
適宜更新あり
|
|||||||

| サイバーレンジの世界市場、実績と予測(2019年~2030年) |
|
出版日: 2024年04月13日
発行: QYResearch
ページ情報: 英文 179 Pages
納期: 2~3営業日
|

全表示
- 概要
- 図表
- 目次
世界のサイバーレンジの市場規模は、2023年に22億4,213万米ドルと推定され、2030年までに46億8,081万米ドルに達し、予測期間の2024年~2030年にCAGRで10.67%の成長が見込まれます。
北米の市場規模は、2023年に8億4,066万米ドルであり、2030年までに17億8,002万米ドルに達する見込みで、予測期間のCAGRは11.09%です。
アジア太平洋の市場規模は、2023年に6億8,999万米ドルであり、2030年までに13億5,823万米ドルに達する見込みで、予測期間のCAGRは11.95%です。
欧州の市場規模は、2023年に7億445万米ドルであり、2030年までに13億7,102万米ドルに達する見込みで、予測期間のCAGRは9.50%です。
当レポートでは、世界サイバーレンジ市場について調査分析し、各地域の市場規模と予測、企業プロファイル、技術動向、新製品開発などの情報を提供しています。
目次
第1章 サイバーレンジ市場の概要
- サイバーレンジ市場の概要
- サイバーレンジ製品の範囲
- サイバーレンジ市場の現状と見通し
- 世界のサイバーレンジの市場規模の概要:地域別(2019年・2023年・2030年)
- サイバーレンジの市場規模:地域別(2019年~2030年)
- 世界のサイバーレンジの市場規模の実績:地域別(2019年~2024年)
- 世界のサイバーレンジの市場規模の予測:地域別(2025年~2030年)
- 主要地域のサイバーレンジの市場規模(2019年~2030年)
- 北米のサイバーレンジの市場規模(2019年~2030年)
- 欧州のサイバーレンジの市場規模(2019年~2030年)
- アジア太平洋のサイバーレンジの市場規模(2019年~2030年)
- 南米のサイバーレンジの市場規模(2019年~2030年)
- 中東・アフリカのサイバーレンジの市場規模(2019年~2030年)
第2章 サイバーレンジ市場:タイプ別
- イントロダクション
- クラウドベース
- オンプレミス
- ハイブリッド
- 世界のサイバーレンジの市場規模:タイプ別(2019年・2023年・2030年)
- 世界のサイバーレンジの市場規模の実績:タイプ別(2019年~2024年)
- 世界のサイバーレンジの市場規模の予測:タイプ別(2025年~2030年)
- 主要地域の市場規模:タイプ別
- 北米のサイバーレンジの収益の内訳:タイプ別(2019年~2030年)
- 欧州のサイバーレンジの収益の内訳:タイプ別(2019年~2030年)
- アジア太平洋のサイバーレンジの収益の内訳:タイプ別(2019年~2030年)
- 南米のサイバーレンジの収益の内訳:タイプ別(2019年~2030年)
- 中東・アフリカのサイバーレンジの収益の内訳:タイプ別(2019年~2030年)
第3章 サイバーレンジ市場の概要:用途別
- イントロダクション
- トレーニング目的
- ネットワークテスト
- 世界のサイバーレンジの市場規模:用途別(2019年・2023年・2030年)
- 世界のサイバーレンジの収益の実績:用途別(2019年~2024年)
- 世界のサイバーレンジの収益の予測:用途別(2025年~2030年)
- 主要地域の市場規模:用途別
- 北米のサイバーレンジの収益の内訳:用途別(2019年~2030年)
- 欧州のサイバーレンジの収益の内訳:用途別(2019年~2030年)
- アジア太平洋のサイバーレンジの収益の内訳:用途別(2019年~2030年)
- 南米のサイバーレンジの収益の内訳:用途別(2019年~2030年)
- 中東・アフリカのサイバーレンジの収益の内訳:用途別(2019年~2030年)
第4章 サイバーレンジ競合分析:企業別
- 世界のサイバーレンジの市場規模:企業別(2019年~2024年)
- 世界の主要企業:企業タイプ別(Tier 1・Tier 2・Tier 3)(2023年時点のサイバーレンジの収益に基づく)
- 世界のサイバーレンジの主要企業の本社とサービス地域
- 世界のサイバーレンジの主要企業、製品
- 世界のサイバーレンジの主要企業、設立日
- 競合状況
- サイバーレンジの市場集中度
- 合併と買収、拡張計画
第5章 企業(主要企業)プロファイル
- Northrop Grumman
- Cisco
- Leonardo
- RTX
- BAE Systems
- Airbus
- IBM
- Keysight
- Mantech
- SimSpace
- Cyberbit
- Integrity Technology
- Cyber Peace
- Immersive Labs
- VMWare
- QIANXIN
- Venustech
- H3C
- NCSE
- NSFOCUS
- Circadence
- Hack The Box
- RangeForce
- 360 Digital Security Group
- FengTai Technology
- TryHackMe
- Cyber Test Systems
- Guardtime
- Cloud Range
第6章 北米
- 北米のサイバーレンジの市場規模:国別(2019年~2030年)
- 米国
- カナダ
- メキシコ
第7章 欧州
- 欧州のサイバーレンジの市場規模:国別(2019年~2030年)
- ドイツ
- フランス
- 英国
- イタリア
- ロシア
- その他の欧州
第8章 アジア太平洋
- アジア太平洋のサイバーレンジの市場規模:地域別(2019年~2030年)
- 中国
- 日本
- 韓国
- 東南アジア
- インド
- その他のアジア太平洋
第9章 南米
- 南米のサイバーレンジの市場規模:国別(2019年~2030年)
- ブラジル
- その他の南米
第10章 中東・アフリカ
- 中東・アフリカのサイバーレンジの市場規模:国別
- トルコ
- GCC諸国
- 南アフリカ
- その他の中東・アフリカ
第11章 サイバーレンジの市場力学
- サイバーレンジ産業の動向
- サイバーレンジ市場の促進要因
- サイバーレンジ市場の課題、抑制要因
第12章 調査結果/結論
第13章 調査手法とデータソース
List of Tables
- Table 1. Global Market Cyber Range Market Size (US$ Million) Comparison by Region: 2019 VS 2023 VS 2030
- Table 2. Global Cyber Range Market Size by Region (2019-2024) & (US$ Million)
- Table 3. Global Cyber Range Market Size Share by Region (2019-2024)
- Table 4. Global Cyber Range Forecasted Market Size by Region (2025-2030) & (US$ Million)
- Table 5. Global Cyber Range Forecasted Market Size Share by Region (2025-2030)
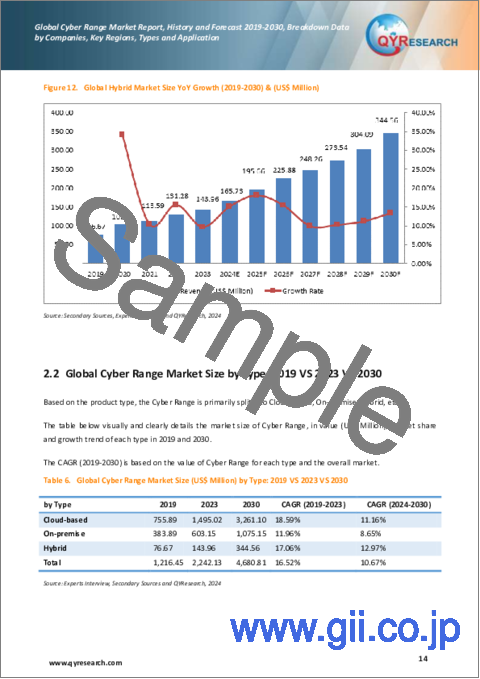
- Table 6. Global Cyber Range Market Size (US$ Million) by Type: 2019 VS 2023 VS 2030
- Table 7. Global Cyber Range Market Size by Type (2019-2024) & (US$ Million)
- Table 8. Global Cyber Range Revenue Market Share by Type (2019-2024)
- Table 9. Global Cyber Range Forecasted Market Size by Type (2025-2030) & (US$ Million)
- Table 10. Global Cyber Range Revenue Market Share by Type (2025-2030)
- Table 11. North America Cyber Range Revenue by Type (2019-2024) & (US$ Million)
- Table 12. North America Cyber Range Revenue by Type (2025-2030) & (US$ Million)
- Table 13. Europe Cyber Range Revenue by Type (2019-2024) & (US$ Million)
- Table 14. Europe Cyber Range Revenue by Type (2025-2030) & (US$ Million)
- Table 15. Asia-Pacific Cyber Range Revenue by Type (2019-2024) & (US$ Million)
- Table 16. Asia-Pacific Cyber Range Revenue by Type (2025-2030) & (US$ Million)
- Table 17. South America Cyber Range Revenue by Type (2019-2024) & (US$ Million)
- Table 18. South America Cyber Range Revenue by Type (2025-2030) & (US$ Million)
- Table 19. Middle East and Africa Cyber Range Revenue by Type (2019-2024) & (US$ Million)
- Table 20. Middle East and Africa Cyber Range Revenue by Type (2025-2030) & (US$ Million)
- Table 21. Global Cyber Range Revenue by Application: (US$ Million) 2019 VS 2023 VS 2030
- Table 22. Global Cyber Range Revenue by Application (2019-2024) & (US$ Million)
- Table 23. Global Cyber Range Revenue Market Share by Application (2019-2024)
- Table 24. Global Cyber Range Forecasted Revenue by Application (2025-2030) & (US$ Million)
- Table 25. Global Cyber Range Revenue Market Share by Application (2025-2030)
- Table 26. North America Cyber Range Revenue by Application (2019-2024) & (US$ Million)
- Table 27. North America Cyber Range Revenue by Application (2025-2030) & (US$ Million)
- Table 28. Europe Cyber Range Revenue by Application (2019-2024) & (US$ Million)
- Table 29. Europe Cyber Range Revenue by Application (2025-2030) & (US$ Million)
- Table 30. Asia-Pacific Cyber Range Revenue by Application (2019-2024) & (US$ Million)
- Table 31. Asia-Pacific Cyber Range Revenue by Application (2025-2030) & (US$ Million)
- Table 32. South America Cyber Range Revenue by Application (2019-2024) & (US$ Million)
- Table 33. South America Cyber Range Revenue by Application (2025-2030) & (US$ Million)
- Table 34. Middle East and Africa Cyber Range Revenue by Application (2019-2024) & (US$ Million)
- Table 35. Middle East and Africa Cyber Range Revenue by Application (2025-2030) & (US$ Million)
- Table 36. Global Cyber Range Revenue by Players (2019-2024) & (US$ Million)
- Table 37. Global Cyber Range Revenue Market Share by Players (2019-2024)
- Table 38. Global Top Players Market Share by Company Type (Tier 1, Tier 2, and Tier 3) & (based on the Revenue in Cyber Range as of 2023)
- Table 39. Global Key Players of Cyber Range, Headquarters and Area Served
- Table 40. Global Key Players of Cyber Range, Product
- Table 41. Global Key Players of Cyber Range, Establish Date
- Table 42. Global Cyber Range Players Market Concentration Ratio (CR5)
- Table 43. Mergers & Acquisitions, Expansion Plans
- Table 44. Northrop Grumman Basic Information List
- Table 45. Northrop Grumman Description and Business Overview
- Table 46. Northrop Grumman Cyber Range Products, Services and Solutions
- Table 47. Revenue (US$ Million) in Cyber Range Business of Northrop Grumman (2019-2024)
- Table 48. Northrop Grumman Recent Developments
- Table 49. Cisco Basic Information List
- Table 50. Cisco Description and Business Overview
- Table 51. Cisco Cyber Range Products, Services and Solutions
- Table 52. Revenue (US$ Million) in Cyber Range Business of Cisco (2019-2024)
- Table 53. Cisco Recent Developments
- Table 54. Leonardo Basic Information List
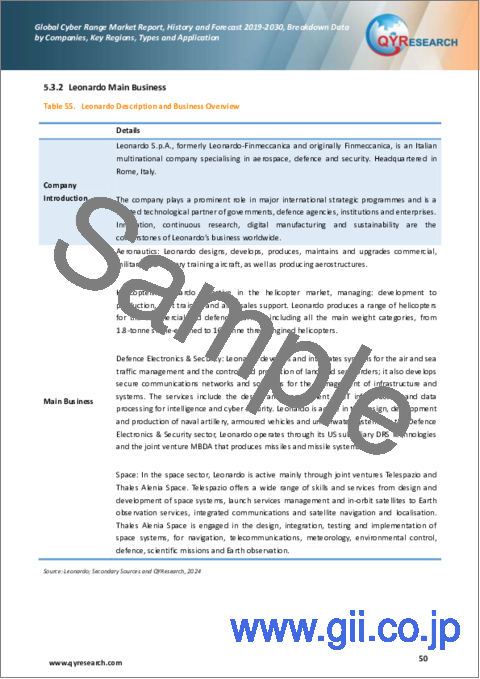
- Table 55. Leonardo Description and Business Overview
- Table 56. Leonardo Cyber Range Products, Services and Solutions
- Table 57. Revenue (US$ Million) in Cyber Range Business of Leonardo (2019-2024)
- Table 58. Leonardo Recent Developments
- Table 59. RTX Basic Information List
- Table 60. RTX Description and Business Overview
- Table 61. RTX Cyber Range Products, Services and Solutions
- Table 62. Revenue (US$ Million) in Cyber Range Business of RTX (2019-2024)
- Table 63. RTX Recent Developments
- Table 64. BAE Systems Basic Information List
- Table 65. BAE Systems Description and Business Overview
- Table 66. BAE Systems Cyber Range Products, Services and Solutions
- Table 67. Revenue (US$ Million) in Cyber Range Business of BAE Systems (2019-2024)
- Table 68. BAE Systems Recent Developments
- Table 69. Airbus Basic Information List
- Table 70. Airbus Description and Business Overview
- Table 71. Airbus Cyber Range Products, Services and Solutions
- Table 72. Revenue (US$ Million) in Cyber Range Business of Airbus (2019-2024)
- Table 73. IBM Basic Information List
- Table 74. IBM Description and Business Overview
- Table 75. IBM Cyber Range Products, Services and Solutions
- Table 76. Revenue (US$ Million) in Cyber Range Business of IBM (2019-2024)
- Table 77. IBM Recent Developments
- Table 78. Keysight Basic Information List
- Table 79. Keysight Description and Business Overview
- Table 80. Keysight Cyber Range Products, Services and Solutions
- Table 81. Revenue (US$ Million) in Cyber Range Business of Keysight (2019-2024)
- Table 82. Keysight Recent Developments
- Table 83. Mantech Basic Information List
- Table 84. Mantech Description and Business Overview
- Table 85. Mantech Cyber Range Products, Services and Solutions
- Table 86. Revenue (US$ Million) in Cyber Range Business of Mantech (2019-2024)
- Table 87. Mantech Recent Developments
- Table 88. SimSpace Basic Information List
- Table 89. SimSpace Description and Business Overview
- Table 90. SimSpace Cyber Range Products, Services and Solutions
- Table 91. Revenue (US$ Million) in Cyber Range Business of SimSpace (2019-2024)
- Table 92. SimSpace Recent Developments
- Table 93. Cyberbit Basic Information List
- Table 94. Cyberbit Description and Business Overview
- Table 95. Cyberbit Cyber Range Products, Services and Solutions
- Table 96. Revenue (US$ Million) in Cyber Range Business of Cyberbit (2019-2024)
- Table 97. Cyberbit Recent Developments
- Table 98. Integrity Technology Basic Information List
- Table 99. Integrity Technology Description and Business Overview
- Table 100. Integrity Technology Cyber Range Products, Services and Solutions
- Table 101. Revenue (US$ Million) in Cyber Range Business of Integrity Technology (2019-2024)
- Table 102. Cyber Peace Basic Information List
- Table 103. Cyber Peace Description and Business Overview
- Table 104. Cyber Peace Cyber Range Products, Services and Solutions
- Table 105. Revenue (US$ Million) in Cyber Range Business of Cyber Peace (2019-2024)
- Table 106. Cyber Peace Recent Developments
- Table 107. Immersive Labs Basic Information List
- Table 108. Immersive Labs Description and Business Overview
- Table 109. Immersive Labs Cyber Range Products, Services and Solutions
- Table 110. Revenue (US$ Million) in Cyber Range Business of Immersive Labs (2019-2024)
- Table 111. Immersive Labs Recent Developments
- Table 112. VMWare Basic Information List
- Table 113. VMWare Description and Business Overview
- Table 114. VMWare Cyber Range Products, Services and Solutions
- Table 115. Revenue (US$ Million) in Cyber Range Business of VMWare (2019-2024)
- Table 116. VMWare Recent Developments
- Table 117. QIANXIN Basic Information List
- Table 118. QIANXIN Description and Business Overview
- Table 119. QIANXIN Cyber Range Products, Services and Solutions
- Table 120. Revenue (US$ Million) in Cyber Range Business of QIANXIN (2019-2024)
- Table 121. Venustech Basic Information List
- Table 122. Venustech Description and Business Overview
- Table 123. Venustech Cyber Range Products, Services and Solutions
- Table 124. Revenue (US$ Million) in Cyber Range Business of Venustech (2019-2024)
- Table 125. H3C Basic Information List
- Table 126. H3C Description and Business Overview
- Table 127. H3C Cyber Range Products, Services and Solutions
- Table 128. Revenue (US$ Million) in Cyber Range Business of H3C (2019-2024)
- Table 129. NCSE Basic Information List
- Table 130. NCSE Description and Business Overview
- Table 131. NCSE Cyber Range Products, Services and Solutions
- Table 132. Revenue (US$ Million) in Cyber Range Business of NCSE (2019-2024)
- Table 133. NSFOCUS Basic Information List
- Table 134. NSFOCUS Description and Business Overview
- Table 135. NSFOCUS Cyber Range Products, Services and Solutions
- Table 136. Revenue (US$ Million) in Cyber Range Business of NSFOCUS (2019-2024)
- Table 137. Circadence Basic Information List
- Table 138. Circadence Description and Business Overview
- Table 139. Circadence Cyber Range Products, Services and Solutions
- Table 140. Revenue (US$ Million) in Cyber Range Business of Circadence (2019-2024)
- Table 141. Hack The Box Basic Information List
- Table 142. Hack The Box Description and Business Overview
- Table 143. Hack The Box Cyber Range Products, Services and Solutions
- Table 144. Revenue (US$ Million) in Cyber Range Business of Hack The Box (2019-2024)
- Table 145. RangeForce Basic Information List
- Table 146. RangeForce Description and Business Overview
- Table 147. RangeForce Cyber Range Products, Services and Solutions
- Table 148. Revenue (US$ Million) in Cyber Range Business of RangeForce (2019-2024)
- Table 149. RangeForce Recent Developments
- Table 150. 360 Digital Security Group Basic Information List
- Table 151. 360 Digital Security Group Description and Business Overview
- Table 152. 360 Digital Security Group Cyber Range Products, Services and Solutions
- Table 153. Revenue (US$ Million) in Cyber Range Business of 360 Digital Security Group (2019-2024)
- Table 154. FengTai Technology Basic Information List
- Table 155. FengTai Technology Description and Business Overview
- Table 156. FengTai Technology Cyber Range Products, Services and Solutions
- Table 157. Revenue (US$ Million) in Cyber Range Business of FengTai Technology (2019-2024)
- Table 158. TryHackMe Basic Information List
- Table 159. TryHackMe Description and Business Overview
- Table 160. TryHackMe Cyber Range Products, Services and Solutions
- Table 161. Revenue (US$ Million) in Cyber Range Business of TryHackMe (2019-2024)
- Table 162. Cyber Test Systems Basic Information List
- Table 163. Cyber Test Systems Description and Business Overview
- Table 164. Cyber Test Systems Cyber Range Products, Services and Solutions
- Table 165. Revenue (US$ Million) in Cyber Range Business of Cyber Test Systems (2019-2024)
- Table 166. Guardtime Basic Information List
- Table 167. Guardtime Description and Business Overview
- Table 168. Guardtime Cyber Range Products, Services and Solutions
- Table 169. Revenue (US$ Million) in Cyber Range Business of Guardtime (2019-2024)
- Table 170. Guardtime Recent Developments
- Table 171. Cloud Range Basic Information List
- Table 172. Cloud Range Description and Business Overview
- Table 173. Cloud Range Cyber Range Products, Services and Solutions
- Table 174. Revenue (US$ Million) in Cyber Range Business of Cloud Range (2019-2024)
- Table 175. Cloud Range Recent Developments
- Table 176. North America Cyber Range Market Size Growth Rate (CAGR) by Country (US$ Million): 2019 VS 2023 VS 2030
- Table 177. North America Cyber Range Market Size by Country (2019-2024) & (US$ Million)
- Table 178. North America Cyber Range Market Size by Country (2025-2030) & (US$ Million)
- Table 179. Europe Cyber Range Market Size Growth Rate (CAGR) by Country (US$ Million): 2019 VS 2023 VS 2030
- Table 180. Europe Cyber Range Market Size by Country (2019-2024) & (US$ Million)
- Table 181. Europe Cyber Range Market Size by Country (2025-2030) & (US$ Million)
- Table 182. Europe Cyber Range Market Share by Country (2019-2024)
- Table 183. Europe Cyber Range Market Share by Country (2025-2030)
- Table 184. Asia-Pacific Cyber Range Market Size Growth Rate (CAGR) by Region (US$ Million): 2019 VS 2023 VS 2030
- Table 185. Asia-Pacific Cyber Range Market Size by Region (2019-2024) & (US$ Million)
- Table 186. Asia-Pacific Cyber Range Market Size by Region (2025-2030) & (US$ Million)
- Table 187. Asia-Pacific Cyber Range Market Share by Region (2019-2024)
- Table 188. Asia-Pacific Cyber Range Market Share by Region (2025-2030)
- Table 189. South America Cyber Range Market Size Growth Rate (CAGR) by Country (US$ Million): 2019 VS 2023 VS 2030
- Table 190. South America Cyber Range Market Size by Country (2019-2024) & (US$ Million)
- Table 191. South America Cyber Range Market Size by Country (2025-2030) & (US$ Million)
- Table 192. Middle East and Africa Cyber Range Market Size Growth Rate (CAGR) by Country (US$ Million): 2019 VS 2023 VS 2030
- Table 193. Middle East & Africa Cyber Range Market Size by Country (2019-2024) & (US$ Million)
- Table 194. Middle East & Africa Cyber Range Market Size by Country (2025-2030) & (US$ Million)
- Table 195. Cyber Range Market Trends
- Table 196. Cyber Range Market Drivers
- Table 197. Cyber Range Market Challenges and Restraints
- Table 198. Research Programs/Design for This Report
- Table 199. Key Data Information from Secondary Sources
- Table 200. Key Data Information from Primary Sources
List of Figures
- Figure 1. Global Cyber Range Market Size Year-over-Year (2019-2030) & (US$ Million)
- Figure 2. Global Cyber Range Market Size, (US$ Million), 2019 VS 2023 VS 2030
- Figure 3. Global Cyber Range Market Share by Region: 2023 VS 2030
- Figure 4. Global Cyber Range Forecasted Market Size Share by Region (2019-2030)
- Figure 5. North America Cyber Range Market Size Growth Rate (2019-2030) & (US$ Million)
- Figure 6. Europe Cyber Range Market Size Growth Rate (2019-2030) & (US$ Million)
- Figure 7. Asia-Pacific Cyber Range Market Size Growth Rate (2019-2030) & (US$ Million)
- Figure 8. South America Cyber Range Market Size Growth Rate (2019-2030) & (US$ Million)
- Figure 9. Middle East and Africa Cyber Range Market Size Growth Rate (2019-2030) & (US$ Million)
- Figure 10. Global Cloud-based Market Size YoY Growth (2019-2030) & (US$ Million)
- Figure 11. Global On-premise Market Size YoY Growth (2019-2030) & (US$ Million)
- Figure 12. Global Hybrid Market Size YoY Growth (2019-2030) & (US$ Million)
- Figure 13. Global Cyber Range Market Size Share by Type: 2023 & 2030
- Figure 14. North America Cyber Range Revenue Market Share by Type (2019-2030)
- Figure 15. Europe Cyber Range Revenue Market Share by Type (2019-2030)
- Figure 16. Asia-Pacific Cyber Range Revenue Market Share by Type (2019-2030)
- Figure 17. South America Cyber Range Revenue Market Share by Type (2019-2030)
- Figure 18. Middle East and Africa Cyber Range Revenue Market Share by Type (2019-2030)
- Figure 19. Training Purpose Market Size (US$ Million) & YoY Growth (2019-2030)
- Figure 20. Network Testing Market Size (US$ Million) & YoY Growth (2019-2030)
- Figure 21. Global Cyber Range Revenue Share by Application: 2023 & 2030
- Figure 22. North America Cyber Range Revenue Market Share by Application (2019-2030)
- Figure 23. Europe Cyber Range Revenue Market Share by Application (2019-2030)
- Figure 24. Asia-Pacific Cyber Range Revenue Market Share by Application (2019-2030)
- Figure 25. South America Cyber Range Revenue Market Share by Application (2019-2030)
- Figure 26. Middle East and Africa Cyber Range Revenue Market Share by Application (2019-2030)
- Figure 27. The Top 10 and Top 5 Players Market Share by Cyber Range Sales in 2023
- Figure 28. North America Cyber Range Market Share by Country (2019-2030)
- Figure 29. United States Cyber Range Market Size (2019-2030) & (US$ Million)
- Figure 30. Canada Cyber Range Market Size (2019-2030) & (US$ Million)
- Figure 31. Mexico Cyber Range Market Size (2019-2030) & (US$ Million)
- Figure 32. Germany Cyber Range Market Size (2019-2030) & (US$ Million)
- Figure 33. France Cyber Range Market Size (2019-2030) & (US$ Million)
- Figure 34. U.K. Cyber Range Market Size (2019-2030) & (US$ Million)
- Figure 35. Italy Cyber Range Market Size (2019-2030) & (US$ Million)
- Figure 36. Russia Cyber Range Market Size (2019-2030) & (US$ Million)
- Figure 37. Rest of Europe Cyber Range Market Size (2019-2030) & (US$ Million)
- Figure 38. Asia-Pacific Cyber Range Market Share by Region (2019-2030)
- Figure 39. China Cyber Range Market Size (2019-2030) & (US$ Million)
- Figure 40. Japan Cyber Range Market Size (2019-2030) & (US$ Million)
- Figure 41. South Korea Cyber Range Market Size (2019-2030) & (US$ Million)
- Figure 42. Southeast Asia Cyber Range Market Size (2019-2030) & (US$ Million)
- Figure 43. India Cyber Range Market Size (2019-2030) & (US$ Million)
- Figure 44. Rest of Asia-Pacific Cyber Range Market Size (2019-2030) & (US$ Million)
- Figure 45. South America Cyber Range Market Share by Country (2019-2030)
- Figure 46. Brazil Cyber Range Market Size (2019-2030) & (US$ Million)
- Figure 47. Rest of South America Cyber Range Market Size (2019-2030) & (US$ Million)
- Figure 48. Middle East & Africa Cyber Range Market Share by Country (2023)
- Figure 49. Turkey Cyber Range Market Size (2019-2030) & (US$ Million)
- Figure 50. GCC Countries Cyber Range Market Size (2019-2030) & (US$ Million)
- Figure 51. South Africa Cyber Range Market Size (2019-2030) & (US$ Million)
- Figure 52. Rest of Middle East & Africa Cyber Range Market Size (2019-2030) & (US$ Million)
- Figure 53. Bottom-up and Top-down Approaches for This Report
- Figure 54. Data Triangulation
The global market for Cyber Range estimated was at US$ 2,242.13 million in the year 2023, is projected to reach a revised size of US$ 4,680.81 million by 2030, growing at a CAGR of 10.67% during the forecast period 2024-2030.
North American market for Cyber Range was valued at $ 840.66 million in 2023 and will reach $ 1,780.02 million by 2030, at a CAGR of 11.09% during the forecast period of 2024 through 2030.
Asia-Pacific market for Cyber Range was valued at $ 689.99 million in 2023 and will reach $ 1,358.23 million by 2030, at a CAGR of 11.95% during the forecast period of 2024 through 2030.
Europe market for Cyber Range was valued at $ 704.45 million in 2023 and will reach $ 1,371.02 million by 2030, at a CAGR of 9.50% during the forecast period of 2024 through 2030.
This report aims to provide a comprehensive presentation of the global market for Cyber Range, with both quantitative and qualitative analysis, to help readers develop business/growth strategies, assess the market competitive situation, analyze their position in the current marketplace, and make informed business decisions regarding Cyber Range.
For a more in-depth understanding of the market, the report provides profiles of the competitive landscape, key competitors, and their respective market ranks. The report also discusses technological trends and new product developments.
This report will help the readers to understand the competition within the industries and strategies for the competitive environment to enhance the potential profit. The report also focuses on the competitive landscape of the global Cyber Range market, and introduces in detail the market share, industry ranking, competitor ecosystem, market performance, new product development, operation situation, expansion, and acquisition. etc. of the main players, which helps the readers to identify the main competitors and deeply understand the competition pattern of the market.
Market Segmentation
This report covers the Cyber Range segments by company, by Type, by Application, by region and country, and provides market size and CAGR for the history and forecast period (2019-2024, 2025-2030), considering 2023 as the base year. It elucidates potential revenue opportunities across different segments and explains attractive investment proposition matrices for this market.
By Company
- Northrop Grumman
- Cisco
- Leonardo
- RTX
- BAE Systems
- Airbus
- IBM
- Keysight
- Mantech
- SimSpace
- Cyberbit
- Integrity Technology
- Cyber Peace
- Immersive Labs
- VMWare
- QIANXIN
- Venustech
- H3C
- NCSE
- NSFOCUS
- Circadence
- Hack The Box
- RangeForce
- 360 Digital Security Group
- FengTai Technology
- TryHackMe
- Cyber Test Systems
- Guardtime
- Cloud Range
Segment by Type
- Cloud-based
- On-premise
- Hybrid
Segment by Application
- Training Purpose
- Network Testing
By Region
- North America
- USA
- Canada
- Mexico
- Asia-Pacific
- China
- Japan
- India
- Southeast Asia
- Korea
- Europe
- Germany
- France
- UK
- Italy
- Russia
- South America
- Brazil
- Middle East & Africa
- GCC Countries
- South Africa
- Turkey
Chapter Outline
Chapter One: Introduces the report scope of the report, executive summary of global and regional market size and CAGR for the history and forecast period (2019-2024, 2025-2030). It offers a high-level view of the current state of the market and its likely evolution in the short to mid-term, and long term.
Chapter Two: Provides the analysis of various market segments by Type, covering the market size and development potential of each market segment, to help readers find the blue ocean market in different market segments.
Chapter Three: Provides the analysis of various market segments by Application, covering the market size and development potential of each market segment, to help readers find the blue ocean market in different downstream markets.
Chapter Four: Detailed analysis of Cyber Range companies' competitive landscape, revenue, market share and ranking, latest development plan, merger, and acquisition information, etc.
Chapter Five: Provides profiles of key players, introducing the basic situation of the main companies in the market in detail, including product introduction, revenue, recent development, etc.
Chapter Six, Seven, Eight, Nine and Ten: North America, Europe, Asia Pacific, South America, Middle East & Africa, revenue by country.
Chapter Eleven: this section also introduces the market dynamics, latest developments of the market, the driving factors and restrictive factors of the market, the challenges and risks faced by companies in the industry, and the analysis of relevant policies in the industry.
Chapter Twelve: Research Finding/Conclusion
Table of Contents
1 Market Overview of Cyber Range
- 1.1 Cyber Range Market Overview
- 1.1.1 Cyber Range Product Scope
- 1.1.2 Cyber Range Market Status and Outlook
- 1.2 Global Cyber Range Market Size Overview by Region 2019 VS 2023 VS 2030
- 1.3 Global Cyber Range Market Size by Region (2019-2030)
- 1.3.1 Global Cyber Range Historic Market Size by Region (2019-2024)
- 1.3.2 Global Cyber Range Market Size Forecast by Region (2025-2030)
- 1.4 Key Regions Cyber Range Market Size (2019-2030)
- 1.4.1 North America Cyber Range Market Size (2019-2030)
- 1.4.2 Europe Cyber Range Market Size (2019-2030)
- 1.4.3 Asia-Pacific Cyber Range Market Size (2019-2030)
- 1.4.4 South America Cyber Range Market Size (2019-2030)
- 1.4.5 Middle East and Africa Cyber Range Market Size (2019-2030)
2 Cyber Range Market by Type
- 2.1 Introduction
- 2.1.1 Cloud-based
- 2.1.2 On-premise
- 2.1.3 Hybrid
- 2.2 Global Cyber Range Market Size by Type: 2019 VS 2023 VS 2030
- 2.2.1 Global Cyber Range Historic Market Size by Type (2019-2024)
- 2.2.2 Global Cyber Range Forecasted Market Size by Type (2025-2030)
- 2.3 Key Regions Market Size by Type
- 2.3.1 North America Cyber Range Revenue Breakdown by Type (2019-2030)
- 2.3.2 Europe Cyber Range Revenue Breakdown by Type (2019-2030)
- 2.3.3 Asia-Pacific Cyber Range Revenue Breakdown by Type (2019-2030)
- 2.3.4 South America Cyber Range Revenue Breakdown by Type (2019-2030)
- 2.3.5 Middle East and Africa Cyber Range Revenue Breakdown by Type (2019-2030)
3 Cyber Range Market Overview by Application
- 3.1 Introduction
- 3.1.1 Training Purpose
- 3.1.2 Network Testing
- 3.2 Global Cyber Range Market Size by Application: 2019 VS 2023 VS 2030
- 3.2.1 Global Cyber Range Historic Revenue by Application (2019-2024)
- 3.2.2 Global Cyber Range Forecasted Revenue by Application (2025-2030)
- 3.3 Key Regions Market Size by Application
- 3.3.1 North America Cyber Range Revenue Breakdown by Application (2019-2030)
- 3.3.2 Europe Cyber Range Revenue Breakdown by Application (2019-2030)
- 3.3.3 Asia-Pacific Cyber Range Revenue Breakdown by Application (2019-2030)
- 3.3.4 South America Cyber Range Revenue Breakdown by Application (2019-2030)
- 3.3.5 Middle East and Africa Cyber Range Revenue Breakdown by Application (2019-2030)
4 Cyber Range Competition Analysis by Players
- 4.1 Global Cyber Range Market Size by Players (2019-2024)
- 4.2 Global Top Players by Company Type (Tier 1, Tier 2, and Tier 3) & (based on the Revenue in Cyber Range as of 2023)
- 4.3 Global Key Players of Cyber Range Head office and Area Served
- 4.4 Global Key Players of Cyber Range, Product
- 4.5 Global Key Players of Cyber Range, Establish Date
- 4.6 Competitive Status
- 4.6.1 Cyber Range Market Concentration Rate
- 4.6.2 Mergers & Acquisitions, Expansion Plans
5 Company (Top Players) Profiles
- 5.1 Northrop Grumman
- 5.1.1 Northrop Grumman Profile
- 5.1.2 Northrop Grumman Main Business
- 5.1.3 Northrop Grumman Cyber Range Products, Services and Solutions
- 5.1.4 Northrop Grumman Cyber Range Revenue (US$ Million) & (2019-2024)
- 5.1.5 Northrop Grumman Recent Developments
- 5.2 Cisco
- 5.2.1 Cisco Profile
- 5.2.2 Cisco Main Business
- 5.2.3 Cisco Cyber Range Products, Services and Solutions
- 5.2.4 Cisco Cyber Range Revenue (US$ Million) & (2019-2024)
- 5.2.5 Cisco Recent Developments
- 5.3 Leonardo
- 5.3.1 Leonardo Profile
- 5.3.2 Leonardo Main Business
- 5.3.3 Leonardo Cyber Range Products, Services and Solutions
- 5.3.4 Leonardo Cyber Range Revenue (US$ Million) & (2019-2024)
- 5.3.5 Leonardo Recent Developments
- 5.4 RTX
- 5.4.1 RTX Profile
- 5.4.2 RTX Main Business
- 5.4.3 RTX Cyber Range Products, Services and Solutions
- 5.4.4 RTX Cyber Range Revenue (US$ Million) & (2019-2024)
- 5.4.5 RTX Recent Developments
- 5.5 BAE Systems
- 5.5.1 BAE Systems Profile
- 5.5.2 BAE Systems Main Business
- 5.5.3 BAE Systems Cyber Range Products, Services and Solutions
- 5.5.4 BAE Systems Cyber Range Revenue (US$ Million) & (2019-2024)
- 5.5.5 BAE Systems Recent Developments
- 5.6 Airbus
- 5.6.1 Airbus Profile
- 5.6.2 Airbus Main Business
- 5.6.3 Airbus Cyber Range Products, Services and Solutions
- 5.6.4 Airbus Cyber Range Revenue (US$ Million) & (2019-2024)
- 5.7 IBM
- 5.7.1 IBM Profile
- 5.7.2 IBM Main Business
- 5.7.3 IBM Cyber Range Products, Services and Solutions
- 5.7.4 IBM Cyber Range Revenue (US$ Million) & (2019-2024)
- 5.7.5 IBM Recent Developments
- 5.8 Keysight
- 5.8.1 Keysight Profile
- 5.8.2 Keysight Main Business
- 5.8.3 Keysight Cyber Range Products, Services and Solutions
- 5.8.4 Keysight Cyber Range Revenue (US$ Million) & (2019-2024)
- 5.8.5 Keysight Recent Developments
- 5.9 Mantech
- 5.9.1 Mantech Profile
- 5.9.2 Mantech Main Business
- 5.9.3 Mantech Cyber Range Products, Services and Solutions
- 5.9.4 Mantech Cyber Range Revenue (US$ Million) & (2019-2024)
- 5.9.5 Mantech Recent Developments
- 5.10 SimSpace
- 5.10.1 SimSpace Profile
- 5.10.2 SimSpace Main Business
- 5.10.3 SimSpace Cyber Range Products, Services and Solutions
- 5.10.4 SimSpace Cyber Range Revenue (US$ Million) & (2019-2024)
- 5.10.5 SimSpace Recent Developments
- 5.11 Cyberbit
- 5.11.1 Cyberbit Profile
- 5.11.2 Cyberbit Main Business
- 5.11.3 Cyberbit Cyber Range Products, Services and Solutions
- 5.11.4 Cyberbit Cyber Range Revenue (US$ Million) & (2019-2024)
- 5.11.5 Cyberbit Recent Developments
- 5.12 Integrity Technology
- 5.12.1 Integrity Technology Profile
- 5.12.2 Integrity Technology Main Business
- 5.12.3 Integrity Technology Cyber Range Products, Services and Solutions
- 5.12.4 Integrity Technology Cyber Range Revenue (US$ Million) & (2019-2024)
- 5.13 Cyber Peace
- 5.13.1 Cyber Peace Profile
- 5.13.2 Cyber Peace Main Business
- 5.13.3 Cyber Peace Cyber Range Products, Services and Solutions
- 5.13.4 Cyber Peace Cyber Range Revenue (US$ Million) & (2019-2024)
- 5.13.5 Cyber Peace Recent Developments
- 5.14 Immersive Labs
- 5.14.1 Immersive Labs Profile
- 5.14.2 Immersive Labs Main Business
- 5.14.3 Immersive Labs Cyber Range Products, Services and Solutions
- 5.14.4 Immersive Labs Cyber Range Revenue (US$ Million) & (2019-2024)
- 5.14.5 Immersive Labs Recent Developments
- 5.15 VMWare
- 5.15.1 VMWare Profile
- 5.15.2 VMWare Main Business
- 5.15.3 VMWare Cyber Range Products, Services and Solutions
- 5.15.4 VMWare Cyber Range Revenue (US$ Million) & (2019-2024)
- 5.15.5 VMWare Recent Developments
- 5.16 QIANXIN
- 5.16.1 QIANXIN Profile
- 5.16.2 QIANXIN Main Business
- 5.16.3 QIANXIN Cyber Range Products, Services and Solutions
- 5.16.4 QIANXIN Cyber Range Revenue (US$ Million) & (2019-2024)
- 5.17 Venustech
- 5.17.1 Venustech Profile
- 5.17.2 Venustech Main Business
- 5.17.3 Venustech Cyber Range Products, Services and Solutions
- 5.17.4 Venustech Cyber Range Revenue (US$ Million) & (2019-2024)
- 5.18 H3C
- 5.18.1 H3C Profile
- 5.18.2 H3C Main Business
- 5.18.3 H3C Cyber Range Products, Services and Solutions
- 5.18.4 H3C Cyber Range Revenue (US$ Million) & (2019-2024)
- 5.19 NCSE
- 5.19.1 NCSE Profile
- 5.19.2 NCSE Main Business
- 5.19.3 NCSE Cyber Range Products, Services and Solutions
- 5.19.4 NCSE Cyber Range Revenue (US$ Million) & (2019-2024)
- 5.20 NSFOCUS
- 5.20.1 NSFOCUS Profile
- 5.20.2 NSFOCUS Main Business
- 5.20.3 NSFOCUS Cyber Range Products, Services and Solutions
- 5.20.4 NSFOCUS Cyber Range Revenue (US$ Million) & (2019-2024)
- 5.21 Circadence
- 5.21.1 Circadence Profile
- 5.21.2 Circadence Main Business
- 5.21.3 Circadence Cyber Range Products, Services and Solutions
- 5.21.4 Circadence Cyber Range Revenue (US$ Million) & (2019-2024)
- 5.22 Hack The Box
- 5.22.1 Hack The Box Profile
- 5.22.2 Hack The Box Main Business
- 5.22.3 Hack The Box Cyber Range Products, Services and Solutions
- 5.22.4 Hack The Box Cyber Range Revenue (US$ Million) & (2019-2024)
- 5.23 RangeForce
- 5.23.1 RangeForce Profile
- 5.23.2 RangeForce Main Business
- 5.23.3 RangeForce Cyber Range Products, Services and Solutions
- 5.23.4 RangeForce Cyber Range Revenue (US$ Million) & (2019-2024)
- 5.23.5 RangeForce Recent Developments
- 5.24 360 Digital Security Group
- 5.24.1 360 Digital Security Group Profile
- 5.24.2 360 Digital Security Group Main Business
- 5.24.3 360 Digital Security Group Cyber Range Products, Services and Solutions
- 5.24.4 360 Digital Security Group Cyber Range Revenue (US$ Million) & (2019-2024)
- 5.25 FengTai Technology
- 5.25.1 FengTai Technology Profile
- 5.25.2 FengTai Technology Main Business
- 5.25.3 FengTai Technology Cyber Range Products, Services and Solutions
- 5.25.4 FengTai Technology Cyber Range Revenue (US$ Million) & (2019-2024)
- 5.26 TryHackMe
- 5.26.1 TryHackMe Profile
- 5.26.2 TryHackMe Main Business
- 5.26.3 TryHackMe Cyber Range Products, Services and Solutions
- 5.26.4 TryHackMe Cyber Range Revenue (US$ Million) & (2019-2024)
- 5.27 Cyber Test Systems
- 5.27.1 Cyber Test Systems Profile
- 5.27.2 Cyber Test Systems Main Business
- 5.27.3 Cyber Test Systems Cyber Range Products, Services and Solutions
- 5.27.4 Cyber Test Systems Cyber Range Revenue (US$ Million) & (2019-2024)
- 5.28 Guardtime
- 5.28.1 Guardtime Profile
- 5.28.2 Guardtime Main Business
- 5.28.3 Guardtime Cyber Range Products, Services and Solutions
- 5.28.4 Guardtime Cyber Range Revenue (US$ Million) & (2019-2024)
- 5.28.5 Guardtime Recent Developments
- 5.29 Cloud Range
- 5.29.1 Cloud Range Profile
- 5.29.2 Cloud Range Main Business
- 5.29.3 Cloud Range Cyber Range Products, Services and Solutions
- 5.29.4 Cloud Range Cyber Range Revenue (US$ Million) & (2019-2024)
- 5.29.5 Cloud Range Recent Developments
6 North America
- 6.1 North America Cyber Range Market Size by Country (2019-2030)
- 6.2 United States
- 6.3 Canada
- 6.4 Mexico
7 Europe
- 7.1 Europe Cyber Range Market Size by Country (2019-2030)
- 7.2 Germany
- 7.3 France
- 7.4 U.K.
- 7.5 Italy
- 7.6 Russia
- 7.7 Rest of Europe
8 Asia-Pacific
- 8.1 Asia-Pacific Cyber Range Market Size by Region (2019-2030)
- 8.2 China
- 8.3 Japan
- 8.4 South Korea
- 8.5 Southeast Asia
- 8.6 India
- 8.7 Rest of Asia-Pacific
9 South America
- 9.1 South America Cyber Range Market Size by Country (2019-2030)
- 9.2 Brazil
- 9.3 Rest of South America
10 Middle East & Africa
- 10.1 Middle East & Africa Cyber Range Market Size by Country
- 10.2 Turkey
- 10.3 GCC Countries
- 10.4 South Africa
- 10.5 Rest of Middle East & Africa
11 Cyber Range Market Dynamics
- 11.1 Cyber Range Industry Trends
- 11.2 Cyber Range Market Drivers
- 11.3 Cyber Range Market Challenges and Restraints
12 Research Finding/Conclusion
13 Methodology and Data Source
- 13.1 Methodology/Research Approach
- 13.1.1 Research Programs/Design
- 13.1.2 Market Size Estimation
- 13.1.3 Market Breakdown and Data Triangulation
- 13.2 Data Source
- 13.2.1 Secondary Sources
- 13.2.2 Primary Sources
- 13.3 Author List
- 13.4 Disclaimer
