|
|
市場調査レポート
商品コード
1453631
インターロイキンの世界市場:産業分析・成長動向・競合分析 (2024年~2030年)Global Interleukin Industry Research Report Growth Trends and Competitive Analysis 2024-2030 |
||||||
|
|||||||
カスタマイズ可能
適宜更新あり
|
|||||||

| インターロイキンの世界市場:産業分析・成長動向・競合分析 (2024年~2030年) |
|
出版日: 2024年03月20日
発行: QYResearch
ページ情報: 英文 124 Pages
納期: 2~3営業日
|

全表示
- 概要
- 図表
- 目次
世界のインターロイキンの市場規模は、2023年に4,344万米ドルに達し、予測期間中 (2024~2030年) に9.88%のCAGRで成長し、2030年には8,274万米ドルに再調整されると予測されています。
当レポートでは、世界のインターロイキンの市場について分析し、種類別・用途別・地域別 の市場動向の見通し (2019年~2030年)、主要企業のプロファイルなどについて調査しております。
目次
第1章 レポート概要
- 調査範囲
- 市場分析:種類別
- 世界のインターロイキンの市場規模・成長率:種類別 (2019年・2023年・2030年)
- 医薬品グレード
- その他
- 用途別の市場
- 世界のインターロイキン市場の成長率:用途別 (2019年・2023年・2030年)
- 医療
- 培地サプリメント
- 科学研究
- 前提と制限
- 調査目的
- 調査年数
第2章 市場の展望
- 世界のインターロイキンの市場規模 (2019~2030年)
- 主要地域のインターロイキンの市場規模 (2019年・2023年・2030年)
- 世界のインターロイキンの市場規模:地域別 (2019~2024年)
- 世界のインターロイキンの市場規模、予測:地域別 (2025~2030年)
- 世界のインターロイキンの市場規模:主要国のランキング
第3章 インターロイキンの競合情勢:企業別
- 世界のインターロイキンの収益:企業別
- 世界のインターロイキンの収益:企業別 (2019~2024年)
- 世界のインターロイキンの収益シェア:企業別 (2019~2024年)
- 世界のインターロイキンの市場シェア:企業の種類別 (ティア1、ティア2、ティア3)
- 分析対象企業:インターロイキンの収益ランキング
- 世界のインターロイキン市場の集中率
- 世界のインターロイキンの主要企業:本社およびサービスエリア
- 企業合併・買収 (M&A)、拡張計画
第4章 世界のインターロイキン:種類別の内訳データ
- 世界のインターロイキンの市場規模、実績:種類別 (2019~2024年)
- 世界のインターロイキンの市場規模、予測:種類別 (2025~2030年)
第5章 世界のインターロイキン:用途別の内訳データ
- 世界のインターロイキンの市場規模、実績:用途別 (2019~2024年)
- 世界のインターロイキンの市場規模、予測:用途別 (2025~2030年)
第6章 北米
- 北米のインターロイキンの収益:企業別 (2022~2024年)
- 北米のインターロイキンの収益:種類別 (2019~2030年)
- 北米のインターロイキンの収益:用途別 (2019~2030年)
- 北米のインターロイキンの収益:国別 (2019~2030年)
- 米国
- カナダ
- メキシコ
第7章 欧州
- 欧州のインターロイキンの収益:企業別 (2022~2024年)
- 欧州のインターロイキンの収益:種類別 (2019~2030年)
- 欧州のインターロイキンの収益:用途別 (2019~2030年)
- 欧州のインターロイキンの収益:国別 (2019~2030年)
- ドイツ
- フランス
- 英国
- イタリア
- ロシア
第8章 アジア太平洋
- アジア太平洋のインターロイキンの収益:企業別 (2022~2024年)
- アジア太平洋のインターロイキンの収益:種類別 (2019~2030年)
- アジア太平洋のインターロイキンの収益:用途別 (2019~2030年)
- アジア太平洋のインターロイキンの収益:地域別 (2019~2030年)
- 中国
- 日本
- 韓国
- インド
- 東南アジア
- オーストラリア
第9章 ラテンアメリカ
- アジア太平洋のインターロイキンの収益:企業別 (2022~2024年)
- アジア太平洋のインターロイキンの収益:種類別 (2019~2030年)
- アジア太平洋のインターロイキンの収益:用途別 (2019~2030年)
- アジア太平洋のインターロイキンの収益:国別 (2019~2030年)
- ブラジル
- アルゼンチン
第10章 中東・アフリカ
- 中東・アフリカのインターロイキンの収益:企業別 (2022~2024年)
- 中東・アフリカのインターロイキンの収益:種類別 (2019~2030年)
- 中東・アフリカのインターロイキンの収益:用途別 (2019~2030年)
- 中東・アフリカのインターロイキンの収益:国別 (2019~2030年)
- 中東
- アフリカ
第11章 企業プロファイル
- Bio-Techne
- Cytiva
- Lonza
- Sartorius CellGenix
- Thermo Fisher Scientific
- Miltenyi Biotec
- Akron Biotech
- Sino Biological
- Creative Bioarray
第12章 インターロイキンの市場力学
- インターロイキン業界の動向
- インターロイキン市場の促進要因
- インターロイキン市場の課題
- インターロイキン市場の抑制要因
第13章 調査結果と結論
第14章 付録
List of Tables
- Table 1. Global Interleukin Market Size Growth Rate (CAGR) by Type (US$ Million): 2019 VS 2023 VS 2030
- Table 2. Global Interleukin Market Size Growth Rate (CAGR) by Application (US$ Million): 2019 VS 2023 VS 2030
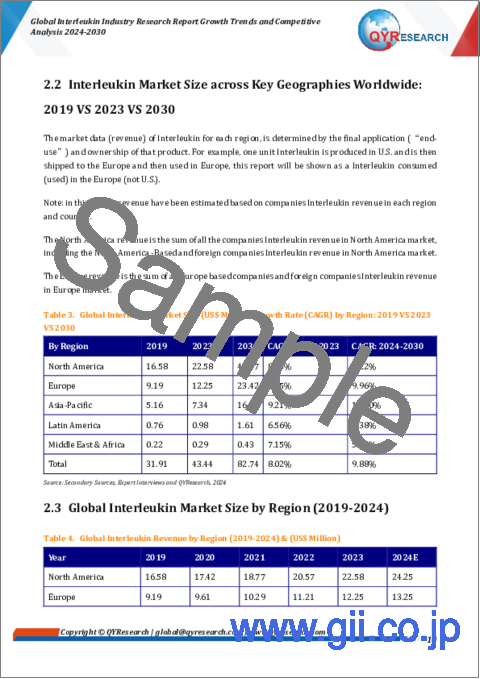
- Table 3. Global Interleukin Market Size (US$ Million) Growth Rate (CAGR) by Region: 2019 VS 2023 VS 2030
- Table 4. Global Interleukin Revenue by Region (2019-2024) & (US$ Million)
- Table 5. Global Interleukin Revenue Forecast by Region (2025-2030) & (US$ Million)
- Table 6. Global Interleukin Market Size of Major Countries, 2019 VS 2023 VS 2030, (US$ Million)
- Table 7. Global Interleukin Revenue by Players (2019-2024) & (US$ Million)
- Table 8. Global Interleukin Market Share by Players (2019-2024)
- Table 9. Global Top Interleukin Players by Company Type (Tier 1, Tier 2, and Tier 3) & (based on the Revenue in Interleukin as of 2023)
- Table 10. Ranking of Global Top Interleukin Companies by Revenue (US$ Million) in 2023
- Table 11. Global 5 Largest Players Market Share by Interleukin Revenue (CR5) & (2019-2024)
- Table 12. Global Key Players of Interleukin, Headquarters and Area Served
- Table 13. Mergers & Acquisitions, Expansion Plans
- Table 14. Global Interleukin Market Size by Type (2019-2024) & (US$ Million)
- Table 15. Global Interleukin Revenue Market Share by Type (2019-2024)
- Table 16. Global Interleukin Forecasted Market Size by Type (2025-2030) & (US$ Million)
- Table 17. Global Interleukin Revenue Market Share by Type (2025-2030)
- Table 18. Global Interleukin Market Size by Application (2019-2024) & (US$ Million)
- Table 19. Global Interleukin Revenue Market Share by Application (2019-2024)
- Table 20. Global Interleukin Forecasted Market Size by Application (2025-2030) & (US$ Million)
- Table 21. Global Interleukin Revenue Market Share by Application (2025-2030)
- Table 22. North America Interleukin Revenue by Company (2022-2024) & (US$ Million)
- Table 23. North America Interleukin Revenue by Type (2019-2024) & (US$ Million)
- Table 24. North America Interleukin Revenue by Type (2025-2030) & (US$ Million)
- Table 25. North America Interleukin Revenue by Application (2019-2024) & (US$ Million)
- Table 26. North America Interleukin Revenue by Application (2025-2030) & (US$ Million)
- Table 27. North America Interleukin Revenue Growth Rate (CAGR) by Country (US$ Million): 2019 VS 2023 VS 2030
- Table 28. North America Interleukin Revenue by Country (2019-2024) & (US$ Million)
- Table 29. North America Interleukin Revenue by Country (2025-2030) & (US$ Million)
- Table 30. Europe Interleukin Revenue by Company (2022-2024) & (US$ Million)
- Table 31. Europe Interleukin Revenue by Type (2019-2024) & (US$ Million)
- Table 32. Europe Interleukin Revenue by Type (2025-2030) & (US$ Million)
- Table 33. Europe Interleukin Revenue by Application (2019-2024) & (US$ Million)
- Table 34. Europe Interleukin Revenue by Application (2025-2030) & (US$ Million)
- Table 35. Europe Interleukin Revenue Growth Rate (CAGR) by Country (US$ Million): 2019 VS 2023 VS 2030
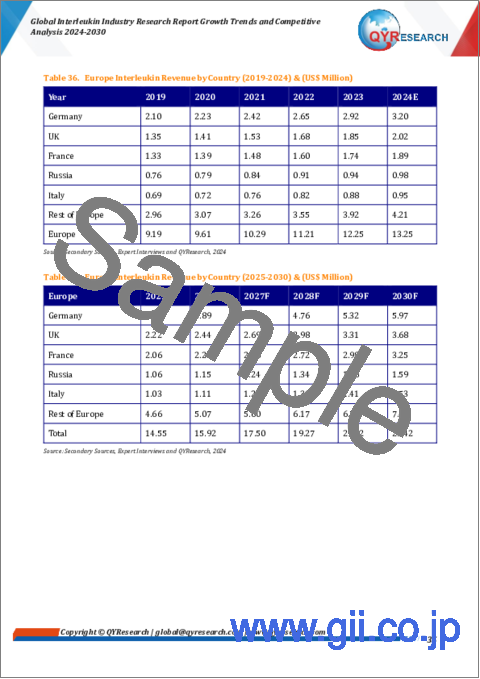
- Table 36. Europe Interleukin Revenue by Country (2019-2024) & (US$ Million)
- Table 37. Europe Interleukin Revenue by Country (2025-2030) & (US$ Million)
- Table 38. Asia Pacific Interleukin Revenue by Company (2022-2024) & (US$ Million)
- Table 39. Asia Pacific Interleukin Revenue Market Share by Company in 2023
- Table 40. Asia Pacific Interleukin Revenue by Type (2019-2024) & (US$ Million)
- Table 41. Asia Pacific Interleukin Revenue by Type (2025-2030) & (US$ Million)
- Table 42. Asia Pacific Interleukin Revenue Market Share by Type (2019-2030)
- Table 43. Asia Pacific Interleukin Revenue by Application (2019-2024) & (US$ Million)
- Table 44. Asia Pacific Interleukin Revenue by Application (2025-2030) & (US$ Million)
- Table 45. Asia Pacific Interleukin Revenue Market Share by Application (2019-2030)
- Table 46. Asia-Pacific Interleukin Growth Rate (CAGR) by Region (US$ Million): 2019 VS 2023 VS 2030
- Table 47. Asia Pacific Interleukin Revenue by Region (2019-2024) & (US$ Million)
- Table 48. Asia Pacific Interleukin Revenue by Region (2025-2030) & (US$ Million)
- Table 49. Asia Pacific Interleukin Revenue Share by Region (2019-2030)
- Table 50. China Interleukin Revenue (2019-2030) & (US$ Million)
- Table 51. Japan Interleukin Revenue (2019-2030) & (US$ Million)
- Table 52. South Korea Interleukin Revenue (2019-2030) & (US$ Million)
- Table 53. India Interleukin Revenue (2019-2030) & (US$ Million)
- Table 54. Southeast Asia Interleukin Revenue (2019-2030) & (US$ Million)
- Table 55. Australia Interleukin Revenue (2019-2030) & (US$ Million)
- Table 56. Latin America Interleukin Revenue by Company (2022-2024) & (US$ Million)
- Table 57. Latin America Interleukin Revenue Market Share by Company in 2023
- Table 58. Latin America Interleukin Revenue by Type (2019-2024) & (US$ Million)
- Table 59. Latin America Interleukin Revenue by Type (2025-2030) & (US$ Million)
- Table 60. Latin America Interleukin Revenue Market Share by Type (2019-2030)
- Table 61. Latin America Interleukin Revenue by Application (2019-2024) & (US$ Million)
- Table 62. Latin America Interleukin Revenue by Application (2025-2030) & (US$ Million)
- Table 63. Latin America Interleukin Revenue Market Share by Application (2019-2030)
- Table 64. Latin America Interleukin Revenue Growth Rate (CAGR) by Country (US$ Million): 2019 VS 2023 VS 2030
- Table 65. Latin America Interleukin Revenue by Country (2019-2024) & (US$ Million)
- Table 66. Latin America Interleukin Revenue by Country (2025-2030) & (US$ Million)
- Table 67. Latin America Interleukin Revenue Share by Country (2019-2030)
- Table 68. Brazil Interleukin Revenue (2019-2030) & (US$ Million)
- Table 69. Argentina Interleukin Revenue (2019-2030) & (US$ Million)
- Table 70. Middle East and Africa Interleukin Revenue by Company (2022-2024) & (US$ Million)
- Table 71. Middle East and Africa Interleukin Revenue Market Share by Company in 2023
- Table 72. Middle East and Africa Interleukin Revenue by Type (2019-2024) & (US$ Million)
- Table 73. Middle East and Africa Interleukin Revenue by Type (2025-2030) & (US$ Million)
- Table 74. Middle East and Africa Interleukin Revenue Market Share by Type (2019-2030)
- Table 75. Middle East and Africa Interleukin Revenue by Application (2019-2024) & (US$ Million)
- Table 76. Middle East and Africa Interleukin Revenue by Application (2025-2030) & (US$ Million)
- Table 77. Middle East and Africa Interleukin Revenue Market Share by Application (2019-2030)
- Table 78. Middle East and Africa Interleukin Revenue Growth Rate (CAGR) by Country (US$ Million): 2019 VS 2023 VS 2030
- Table 79. Middle East and Africa Interleukin Revenue by Country (2019-2024) & (US$ Million)
- Table 80. Middle East and Africa Interleukin Revenue by Country (2025-2030) & (US$ Million)
- Table 81. Middle East and Africa Interleukin Revenue Share by Country (2019-2030)
- Table 82. Middle East Interleukin Revenue (2019-2030) & (US$ Million)
- Table 83. Africa Interleukin Revenue (2019-2030) & (US$ Million)
- Table 84. Bio-Techne Company Details
- Table 85. Bio-Techne Interleukin Products and Services
- Table 86. Bio-Techne Revenue in Interleukin Business (2019-2024) & (US$ Million)
- Table 87. Bio-Techne Interleukin SWOT Analysis
- Table 88. Bio-Techne Recent Development
- Table 89. Cytiva Company Details
- Table 90. Cytiva Interleukin Products and Services
- Table 91. Cytiva Revenue in Interleukin Business (2019-2024) & (US$ Million)
- Table 92. Cytiva Interleukin SWOT Analysis
- Table 93. Cytiva Recent Development
- Table 94. Lonza Company Details
- Table 95. Lonza Interleukin Products and Services
- Table 96. Lonza Revenue in Interleukin Business (2019-2024) & (US$ Million)
- Table 97. Lonza Interleukin SWOT Analysis
- Table 98. Lonza Recent Development
- Table 99. Sartorius CellGenix Company Details
- Table 100. Sartorius CellGenix Interleukin Products and Services
- Table 101. Sartorius CellGenix Revenue in Interleukin Business (2019-2024) & (US$ Million)
- Table 102. Sartorius CellGenix Interleukin SWOT Analysis
- Table 103. Sartorius CellGenix Recent Development
- Table 104. Thermo Fisher Scientific Company Details
- Table 105. Thermo Fisher Scientific Interleukin Products and Services
- Table 106. Thermo Fisher Scientific Revenue in Interleukin Business (2019-2024) & (US$ Million)
- Table 107. Thermo Fisher Scientific Interleukin SWOT Analysis
- Table 108. Thermo Fisher Scientific Recent Development
- Table 109. Miltenyi Biotec Company Details
- Table 110. Miltenyi Biotec Interleukin Products and Services
- Table 111. Miltenyi Biotec Revenue in Interleukin Business (2019-2024) & (US$ Million)
- Table 112. Miltenyi Biotec Interleukin SWOT Analysis
- Table 113. Miltenyi Biotec Recent Development
- Table 114. Akron Biotech Company Details
- Table 115. Akron Biotech Interleukin Products and Services
- Table 116. Akron Biotech Revenue in Interleukin Business (2019-2024) & (US$ Million)
- Table 117. Akron Biotech Interleukin SWOT Analysis
- Table 118. Akron Biotech Recent Development
- Table 119. Sino Biological Company Details
- Table 120. Sino Biological Interleukin Products and Services
- Table 121. Sino Biological Revenue in Interleukin Business (2019-2024) & (US$ Million)
- Table 122. Sino Biological Interleukin SWOT Analysis
- Table 123. Sino Biological Recent Development
- Table 124. Creative Bioarray Company Details
- Table 125. Creative Bioarray Interleukin Products and Services
- Table 126. Creative Bioarray Revenue in Interleukin Business (2019-2024) & (US$ Million)
- Table 127. Creative Bioarray Interleukin SWOT Analysis
- Table 128. Creative Bioarray Recent Development
- Table 129. Interleukin Market Trends
- Table 130. Interleukin Market Drivers
- Table 131. Interleukin Market Challenges
- Table 132. Interleukin Market Restraints
- Table 133. Research Programs/Design for This Report
- Table 134. Key Data Information from Secondary Sources
- Table 135. Key Data Information from Primary Sources
List of Figures
- Figure 1. Interleukin Product Picture
- Figure 2. Global Interleukin Market Size by Type (US$ Million): 2019- 2030
- Figure 3. Global Interleukin Market Share by Type: 2023 VS 2030
- Figure 4. Global Interleukin Market Size by Application (US$ Million): 2019-2030
- Figure 5. Global Interleukin Market Share by Application: 2023 VS 2030
- Figure 6. Interleukin Report Years Considered
- Figure 7. Global Interleukin Revenue, (US$ Million), 2019 VS 2023 VS 2030
- Figure 8. Global Interleukin Revenue Market Share by Region in 2023
- Figure 9. Global Interleukin Revenue Market Share Forecast by Region (2025-2030)
- Figure 10. Global Interleukin Market Share by Players in 2023
- Figure 11. North America Interleukin Revenue Market Share by Company in 2023
- Figure 12. North America Interleukin Revenue Market Share by Type (2019-2030)
- Figure 13. North America Interleukin Revenue Market Share by Application (2019-2030)
- Figure 14. North America Interleukin Revenue Share by Country (2019-2030)
- Figure 15. United States Interleukin Revenue (2019-2030) & (US$ Million)
- Figure 16. Canada Interleukin Revenue (2019-2030) & (US$ Million)
- Figure 17. Mexico Interleukin Revenue (2019-2030) & (US$ Million)
- Figure 18. Europe Interleukin Revenue Market Share by Company in 2023
- Figure 19. Europe Interleukin Revenue Market Share by Type (2019-2030)
- Figure 20. Europe Interleukin Revenue Market Share by Application (2019-2030)
- Figure 21. Europe Interleukin Revenue Share by Country (2019-2030)
- Figure 22. Germany Interleukin Revenue (2019-2030) & (US$ Million)
- Figure 23. France Interleukin Revenue (2019-2030) & (US$ Million)
- Figure 24. U.K. Interleukin Revenue (2019-2030) & (US$ Million)
- Figure 25. Italy Interleukin Revenue (2019-2030) & (US$ Million)
- Figure 26. Russia Interleukin Revenue (2019-2030) & (US$ Million)
- Figure 27. Bottom-up and Top-down Approaches for This Report
- Figure 28. Data Triangulation
- Figure 29. Key Executives Interviewed
The global Interleukin market size was US$ 43.44 million in 2023 and is forecast to a readjusted size of US$ 82.74 million by 2030 with a CAGR of 9.88% during the forecast period 2024-2030.
The market research report offered here is a very useful resource that can help manufacturers, stakeholders, decision-makers, and other market participants to become familiar with every factor impacting the growth of the global Interleukin market. The analysts authoring the report have closely studied key strategies adopted by top players of the global Interleukin market. The report includes SWOT, and other market analyses to provide a clear and deep understanding of important aspects of the global Interleukin market. Readers of the report can become informed about current and future trends of the global Interleukin market and how they will impact market growth during the forecast period.
Market Segmentation
By Company
- Bio-Techne
- Cytiva
- Lonza
- Sartorius CellGenix
- Thermo Fisher Scientific
- Miltenyi Biotec
- Akron Biotech
- Sino Biological
- Creative Bioarray
Segment by Type
- Pharmaceutical Grade
- Other
Segment by Application
- Medical
- Culture Medium Supplement
- Scientific Research
By Region
North America
- United States
- Canada
- Mexico
Asia-Pacific
- China
- Japan
- Korea
- India
- Southeast Asia
- Australia
- Rest of Asia-Pacific
Europe
- Germany
- UK
- France
- Russia
- Italy
- Rest of Europe
Latin America
- Brazil
- Argentina
- Rest of Latin America
Middle East & Africa
- Middle East
- Africa
Chapter Outline
Chapter 1: Introduces the report scope of the report, executive summary of different market segments (product type, application, etc), including the market size of each market segment, future development potential, and so on.
Chapter 2: Revenue of Interleukin in global and regional level.
Chapter 3: Detailed analysis of Interleukin company competitive landscape, revenue, market share and industry ranking, latest development plan, merger, and acquisition information, etc.
Chapter 4: Provides the analysis of various market segments by Type, covering the revenue, and development potential of each market segment, to help readers find the blue ocean market in different market segments.
Chapter 5: Provides the analysis of various market segments by Application, covering the revenue, and development potential of each market segment, to help readers find the blue ocean market in different downstream markets.
Chapter 6: North America (US & Canada) by Type, by Application and by country, revenue for each segment.
Chapter 7: Europe by Type, by Application and by country, revenue for each segment.
Chapter 8: Asia Pacific by Type, by Application and by region, revenue for each segment.
Chapter 9: Latin America by Type, by Application and by country, revenue for each segment.
Chapter 10: Middle East and Africa, by Type, by Application and by country, revenue for each segment.
Chapter 11: Provides profiles of key companies, introducing the basic situation of the main companies in the market in detail, including product descriptions and specifications, Interleukin revenue, gross margin, and recent development, etc.
Chapter 12: Introduces the market dynamics, latest developments of the market, the driving factors and restrictive factors of the market, the challenges and risks faced by manufacturers in the industry, and the analysis of relevant policies in the industry.
Chapter 13: Research Findings and Conclusion
Table of Contents
1 Report Overview
- 1.1 Study Scope
- 1.2 Market Analysis by Type
- 1.2.1 Global Interleukin Market Size Growth Rate by Type: 2019 VS 2023 VS 2030
- 1.2.2 Pharmaceutical Grade
- 1.2.3 Other
- 1.3 Market by Application
- 1.3.1 Global Interleukin Market Growth by Application: 2019 VS 2023 VS 2030
- 1.3.2 Medical
- 1.3.3 Culture Medium Supplement
- 1.3.4 Scientific Research
- 1.4 Assumptions and Limitations
- 1.5 Study Objectives
- 1.6 Years Considered
2 Market Perspective
- 2.1 Global Interleukin Market Size 2019-2030
- 2.2 Interleukin Market Size across Key Geographies Worldwide: 2019 VS 2023 VS 2030
- 2.3 Global Interleukin Market Size by Region (2019-2024)
- 2.4 Global Interleukin Market Size Forecast by Region (2025-2030)
- 2.5 Global Major Interleukin Countries Ranking by Market Size
3 Interleukin Competition by Company
- 3.1 Global Interleukin Revenue by Players
- 3.1.1 Global Interleukin Revenue by Players (2019-2024)
- 3.1.2 Global Interleukin Market Share by Players (2019-2024)
- 3.2 Global Interleukin Market Share by Company Type (Tier 1, Tier 2, and Tier 3)
- 3.3 Company Covered: Ranking by Interleukin Revenue
- 3.4 Global Interleukin Market Concentration Ratio
- 3.5 Global Key Players of Interleukin Head office and Area Served
- 3.6 Mergers & Acquisitions, Expansion Plans
4 Global Interleukin Breakdown Data by Type
- 4.1 Global Interleukin Historic Market Size by Type (2019-2024)
- 4.2 Global Interleukin Forecasted Market Size by Type (2025-2030)
5 Global Interleukin Breakdown Data by Application
- 5.1 Global Interleukin Historic Market Size by Application (2019-2024)
- 5.2 Global Interleukin Forecasted Market Size by Application (2025-2030)
6 North America
- 6.1 North America Interleukin Revenue by Company (2022-2024)
- 6.2 North America Interleukin Revenue by Type (2019-2030)
- 6.3 North America Interleukin Revenue by Application (2019-2030)
- 6.4 North America Interleukin Revenue by Country (2019-2030)
- 6.4.1 United States
- 6.4.2 Canada
- 6.4.3 Mexico
7 Europe
- 7.1 Europe Interleukin Revenue by Company (2022-2024)
- 7.2 Europe Interleukin Revenue by Type (2019-2030)
- 7.3 Europe Interleukin Revenue by Application (2019-2030)
- 7.4 Europe Interleukin Revenue by Country (2019-2030)
- 7.4.1 Germany
- 7.4.2 France
- 7.4.3 U.K.
- 7.4.4 Italy
- 7.4.5 Russia
8 Asia Pacific
- 8.1 Asia Pacific Interleukin Revenue by Company (2022-2024)
- 8.2 Asia Pacific Interleukin Revenue by Type (2019-2030)
- 8.3 Asia Pacific Interleukin Revenue by Application (2019-2030)
- 8.4 Asia Pacific Interleukin Revenue by Region (2019-2030)
- 8.4.1 China
- 8.4.2 Japan
- 8.4.3 South Korea
- 8.4.4 India
- 8.4.5 Southeast Asia
- 8.4.6 Australia
9 Latin America
- 9.1 Latin America Interleukin Revenue by Company (2022-2024)
- 9.2 Latin America Interleukin Revenue by Type (2019-2030)
- 9.3 Latin America Interleukin Revenue by Application (2019-2030)
- 9.4 Latin America Interleukin Revenue by Country (2019-2030)
- 9.4.1 Brazil
- 9.4.2 Argentina
10 Middle East and Africa
- 10.1 Middle East and Africa Interleukin Revenue by Company (2022-2024)
- 10.2 Middle East and Africa Interleukin Revenue by Type (2019-2030)
- 10.3 Middle East and Africa Interleukin Revenue by Application (2019-2030)
- 10.4 Middle East and Africa Interleukin Revenue by Country (2019-2030)
- 10.4.1 Middle East
- 10.4.2 Africa
11 Company Profiles
- 11.1 Bio-Techne
- 11.1.1 Bio-Techne Company Details
- 11.1.2 Bio-Techne Business Overview
- 11.1.3 Bio-Techne Interleukin Products and Servicess and Services
- 11.1.4 Bio-Techne Revenue in Interleukin Business (2019-2024)
- 11.1.5 Bio-Techne Interleukin SWOT Analysis
- 11.1.6 Bio-Techne Recent Development
- 11.2 Cytiva
- 11.2.1 Cytiva Company Details
- 11.2.2 Cytiva Business Overview
- 11.2.3 Cytiva Interleukin Products and Servicess and Services
- 11.2.4 Cytiva Revenue in Interleukin Business (2019-2024)
- 11.2.5 Cytiva Interleukin SWOT Analysis
- 11.2.6 Cytiva Recent Development
- 11.3 Lonza
- 11.3.1 Lonza Company Details
- 11.3.2 Lonza Business Overview
- 11.3.3 Lonza Interleukin Products and Servicess and Services
- 11.3.4 Lonza Revenue in Interleukin Business (2019-2024)
- 11.3.5 Lonza Interleukin SWOT Analysis
- 11.3.6 Lonza Recent Development
- 11.4 Sartorius CellGenix
- 11.4.1 Sartorius CellGenix Company Details
- 11.4.2 Sartorius CellGenix Business Overview
- 11.4.3 Sartorius CellGenix Interleukin Products and Servicess and Services
- 11.4.4 Sartorius CellGenix Revenue in Interleukin Business (2019-2024)
- 11.4.5 Sartorius CellGenix Interleukin SWOT Analysis
- 11.4.6 Sartorius CellGenix Recent Development
- 11.5 Thermo Fisher Scientific
- 11.5.1 Thermo Fisher Scientific Company Details
- 11.5.2 Thermo Fisher Scientific Business Overview
- 11.5.3 Thermo Fisher Scientific Interleukin Products and Servicess and Services
- 11.5.4 Thermo Fisher Scientific Revenue in Interleukin Business (2019-2024)
- 11.5.5 Thermo Fisher Scientific Interleukin SWOT Analysis
- 11.5.6 Thermo Fisher Scientific Recent Development
- 11.6 Miltenyi Biotec
- 11.6.1 Miltenyi Biotec Company Details
- 11.6.2 Miltenyi Biotec Business Overview
- 11.6.3 Miltenyi Biotec Interleukin Products and Servicess and Services
- 11.6.4 Miltenyi Biotec Revenue in Interleukin Business (2019-2024)
- 11.6.5 Miltenyi Biotec Interleukin SWOT Analysis
- 11.6.6 Miltenyi Biotec Recent Development
- 11.7 Akron Biotech
- 11.7.1 Akron Biotech Company Details
- 11.7.2 Akron Biotech Business Overview
- 11.7.3 Akron Biotech Interleukin Products and Servicess and Services
- 11.7.4 Akron Biotech Revenue in Interleukin Business (2019-2024)
- 11.7.5 Akron Biotech Interleukin SWOT Analysis
- 11.7.6 Akron Biotech Recent Development
- 11.8 Sino Biological
- 11.8.1 Sino Biological Company Details
- 11.8.2 Sino Biological Business Overview
- 11.8.3 Sino Biological Interleukin Products and Servicess and Services
- 11.8.4 Sino Biological Revenue in Interleukin Business (2019-2024)
- 11.8.5 Sino Biological Interleukin SWOT Analysis
- 11.8.6 Sino Biological Recent Development
- 11.9 Creative Bioarray
- 11.9.1 Creative Bioarray Company Details
- 11.9.2 Creative Bioarray Business Overview
- 11.9.3 Creative Bioarray Interleukin Products and Servicess and Services
- 11.9.4 Creative Bioarray Revenue in Interleukin Business (2019-2024)
- 11.9.5 Creative Bioarray Interleukin SWOT Analysis
- 11.9.6 Creative Bioarray Recent Development
12 Interleukin Market Dynamics
- 12.1 Interleukin Industry Trends
- 12.2 Interleukin Market Drivers
- 12.3 Interleukin Market Challenges
- 12.4 Interleukin Market Restraints
13 Research Findings and Conclusion
14 Appendix
- 14.1 Research Methodology
- 14.1.1 Methodology/Research Approach
- 14.1.2 Data Source
- 14.2 Author Details
- 14.3 Disclaimer

