|
|
市場調査レポート
商品コード
1432269
SDS-PAGEの世界市場:実績・予測 (2019年~2030年)Global SDS-PAGE Market Report, History and Forecast 2019-2030 |
||||||
|
|||||||
カスタマイズ可能
適宜更新あり
|
|||||||

| SDS-PAGEの世界市場:実績・予測 (2019年~2030年) |
|
出版日: 2024年02月22日
発行: QYResearch
ページ情報: 英文 111 Pages
納期: 2~3営業日
|

全表示
- 概要
- 図表
- 目次
世界のSDS-PAGEの市場規模は、収益ベースで2023年の3億5,653万米ドルから、予測期間中は6.16%のCAGRで推移し、2030年には5億4,100万米ドルの規模に成長すると予測されています。
北米市場は2023年の1億4,211万米ドルから、5.62%のCAGRで推移し、2030年には2億534万米ドルの規模に成長すると予測されています。欧州市場は2023年の8,584万米ドルから、CAGR 5.58%で推移し、2030年には1億2,621万米ドルに達すると予測されています。アジア太平洋市場は2023年の1億901万米ドルから、7.14%のCAGRで推移し、2030年には1億7,910万米ドルに達すると予測されています。ラテンアメリカ市場は2023年の996万米ドルから、CAGR 6.49%で推移し、2030年には1,543万米ドルに達すると予測されています。中東・アフリカ市場は2023年の961万米ドルから、CAGR 6.79%で推移し、2030年には1,492万米ドルに達すると予測されています。
当レポートでは、世界のSDS-PAGEの市場を調査し、市場概要、市場成長への各種影響因子の分析、市場規模の推移・予測、タイプ・用途別の内訳、地域・主要国別の詳細分析、競合環境、市場シェア、主要企業のプロファイルなどをまとめています。
目次
第1章 SDS-PAGE:市場概要
- SDS-PAGE:市場概要
- 市場規模の概要:地域別:2019年 vs 2023年 vs 2030年
- 世界市場の規模:推移・予測
- 主要地域市場の規模:推移・予測
- 北米
- 欧州
- アジア太平洋
- ラテンアメリカ
- 中東・アフリカ
第2章 SDS-PAGE市場:タイプ別
- イントロダクション
- 試薬
- ジェル
- 機器
- 世界市場の規模:2019 vs 2023 vs 2030
- 市場規模実績
- 市場規模予測
- 主要地域市場の規模
- 北米
- 欧州
- アジア太平洋
- ラテンアメリカ
- 中東・アフリカ
第3章 SDS-PAGE市場の概要:用途別
- イントロダクション
- バイオテクノロジー・製薬
- 臨床研究
- 学術機関
- その他
- 世界市場の規模:2019 vs 2023 vs 2030
- 収益の推移
- 収益の予測
- 主要地域市場の規模
- 北米
- 欧州
- アジア太平洋
- ラテンアメリカ
- 中東・アフリカ
第4章 SDS-PAGE市場の競合分析:企業別
- 世界のSDS-PAGE市場の規模:企業別
- 世界の主要企業:企業タイプ別
- 世界の主要企業:本社およびサービスエリア
- 世界の主要企業:製品・用途
- 世界の主要企業:参入日
- 競合情勢
第5章 主要企業プロファイル
- Thermo Fisher Scientific
- Danaher
- Merck
- Bio-Rad Laboratories
- GenScript
- Beijing Liuyi Biotechnology
- Rockland Immunochemicals
- Boston BioProducts
- Cleaver Scientific(Thistle Scientific)
- Hycult Biotech
- Elabscience Bionovation
- Cepham Life Sciences
- Beijing Qualityard Biotechnology
- Guangzhou Seyotin
- GenDEPOT
- Shanghai Genefist
第6章 北米
第7章 欧州
第8章 アジア太平洋
第9章 ラテンアメリカ
第10章 中東・アフリカ
第11章 SDS-PAGE:市場力学
- 産業動向
- 市場促進要因
- 市場課題
- 市場抑制要因
第12章 調査結果・総論
第13章 調査手法・データソース
List of Tables
- Table 1. Global Market SDS-PAGE Market Size (US$ Million) Comparison by Region: 2019 VS 2023 VS 2030
- Table 2. Global SDS-PAGE Market Size by Region (2019-2024) & (US$ Million)
- Table 3. Global SDS-PAGE Market Size Share by Region (2019-2024)
- Table 4. Global SDS-PAGE Forecasted Market Size by Region (2025-2030) & (US$ Million)
- Table 5. Global SDS-PAGE Forecasted Market Size Share by Region (2025-2030)
- Table 6. Global SDS-PAGE Market Size (US$ Million) by Type: 2019 VS 2023 VS 2030
- Table 7. Global SDS-PAGE Market Size by Type (2019-2024) & (US$ Million)
- Table 8. Global SDS-PAGE Revenue Market Share by Type (2019-2024)
- Table 9. Global SDS-PAGE Forecasted Market Size by Type (2025-2030) & (US$ Million)
- Table 10. Global SDS-PAGE Revenue Market Share by Type (2025-2030)
- Table 11. North America SDS-PAGE Revenue by Type (2019-2024) & (US$ Million)
- Table 12. North America SDS-PAGE Revenue by Type (2025-2030) & (US$ Million)
- Table 13. Europe SDS-PAGE Revenue by Type (2019-2024) & (US$ Million)
- Table 14. Europe SDS-PAGE Revenue by Type (2025-2030) & (US$ Million)
- Table 15. Asia-Pacific SDS-PAGE Revenue by Type (2019-2024) & (US$ Million)
- Table 16. Asia-Pacific SDS-PAGE Revenue by Type (2025-2030) & (US$ Million)
- Table 17. Latin America SDS-PAGE Revenue by Type (2019-2024) & (US$ Million)
- Table 18. Latin America SDS-PAGE Revenue by Type (2025-2030) & (US$ Million)
- Table 19. Middle East and Africa SDS-PAGE Revenue by Type (2019-2024) & (US$ Million)
- Table 20. Middle East and Africa SDS-PAGE Revenue by Type (2025-2030) & (US$ Million)
- Table 21. Global SDS-PAGE Revenue by Application: (US$ Million) 2019 VS 2023 VS 2030
- Table 22. Global SDS-PAGE Revenue by Application (2019-2024) & (US$ Million)
- Table 23. Global SDS-PAGE Revenue Market Share by Application (2019-2024)
- Table 24. Global SDS-PAGE Forecasted Revenue by Application (2025-2030) & (US$ Million)
- Table 25. Global SDS-PAGE Revenue Market Share by Application (2025-2030)
- Table 26. North America SDS-PAGE Revenue by Application (2019-2024) & (US$ Million)
- Table 27. North America SDS-PAGE Revenue by Application (2025-2030) & (US$ Million)
- Table 28. Europe SDS-PAGE Revenue by Application (2019-2024) & (US$ Million)
- Table 29. Europe SDS-PAGE Revenue by Application (2025-2030) & (US$ Million)
- Table 30. Asia-Pacific SDS-PAGE Revenue by Application (2019-2024) & (US$ Million)
- Table 31. Asia-Pacific SDS-PAGE Revenue by Application (2025-2030) & (US$ Million)
- Table 32. Latin America SDS-PAGE Revenue by Application (2019-2024) & (US$ Million)
- Table 33. Latin America SDS-PAGE Revenue by Application (2025-2030) & (US$ Million)
- Table 34. Middle East and Africa SDS-PAGE Revenue by Application (2019-2024) & (US$ Million)
- Table 35. Middle East and Africa SDS-PAGE Revenue by Application (2025-2030) & (US$ Million)
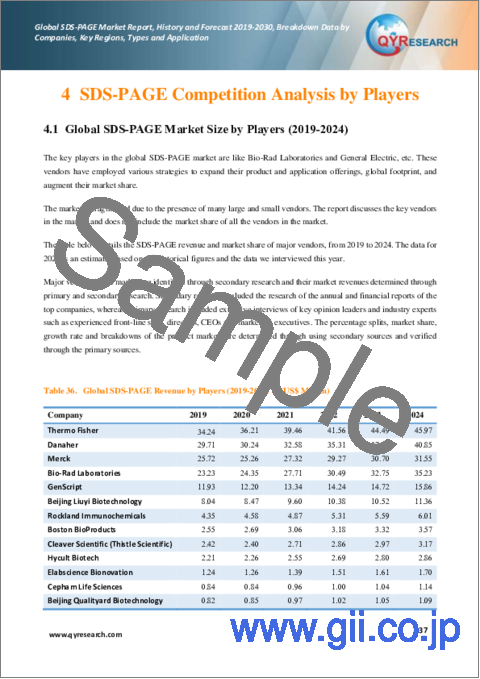
- Table 36. Global SDS-PAGE Revenue by Players (2019-2024) & (US$ Million)
- Table 37. Global SDS-PAGE Revenue Market Share by Players (2019-2024)
- Table 38. Global Top Players Market Share by Company Type (Tier 1, Tier 2, and Tier 3) & (based on the Revenue in SDS-PAGE as of 2023)
- Table 39. Global Key Players of SDS-PAGE, Headquarters and Area Served
- Table 40. Global Key Players of SDS-PAGE, Product and Application
- Table 41. Global Key Players of SDS-PAGE, Date of Enter into This Industry
- Table 42. Global SDS-PAGE Players Market Concentration Ratio (CR5 and HHI)
- Table 43. Mergers & Acquisitions, Expansion Plans
- Table 44. Thermo Fisher Scientific Basic Information List
- Table 45. Thermo Fisher Scientific Description and Business Overview
- Table 46. Thermo Fisher Scientific SDS-PAGE Products, Services and Solutions
- Table 47. Revenue (US$ Million) in SDS-PAGE Business of Thermo Fisher Scientific (2019-2024)
- Table 48. Thermo Fisher Scientific Recent Developments
- Table 49. Danaher Basic Information List
- Table 50. Danaher Description and Business Overview
- Table 51. Danaher SDS-PAGE Products, Services and Solutions
- Table 52. Revenue (US$ Million) in SDS-PAGE Business of Danaher (2019-2024)
- Table 53. Danaher Recent Developments
- Table 54. Merck Basic Information List
- Table 55. Merck Description and Business Overview
- Table 56. Merck SDS-PAGE Products, Services and Solutions
- Table 57. Revenue (US$ Million) in SDS-PAGE Business of Merck (2019-2024)
- Table 58. Merck Recent Developments
- Table 59. Bio-Rad Laboratories Basic Information List
- Table 60. Bio-Rad Laboratories Description and Business Overview
- Table 61. Bio-Rad Laboratories SDS-PAGE Products, Services and Solutions
- Table 62. Revenue (US$ Million) in SDS-PAGE Business of Bio-Rad Laboratories (2019-2024)
- Table 63. Bio-Rad Laboratories Recent Developments
- Table 64. GenScript Basic Information List
- Table 65. GenScript Description and Business Overview
- Table 66. GenScript SDS-PAGE Products, Services and Solutions
- Table 67. Revenue (US$ Million) in SDS-PAGE Business of GenScript (2019-2024)
- Table 68. GenScript Recent Developments
- Table 69. Beijing Liuyi Biotechnology Basic Information List
- Table 70. Beijing Liuyi Biotechnology Description and Business Overview
- Table 71. Beijing Liuyi Biotechnology SDS-PAGE Products, Services and Solutions
- Table 72. Revenue (US$ Million) in SDS-PAGE Business of Beijing Liuyi Biotechnology (2019-2024)
- Table 73. Beijing Liuyi Biotechnology Recent Developments
- Table 74. Rockland Immunochemicals Basic Information List
- Table 75. Rockland Immunochemicals Description and Business Overview
- Table 76. Rockland Immunochemicals SDS-PAGE Products, Services and Solutions
- Table 77. Revenue (US$ Million) in SDS-PAGE Business of Rockland Immunochemicals (2019-2024)
- Table 78. Rockland Immunochemicals Recent Developments
- Table 79. Boston BioProducts Basic Information List
- Table 80. Boston BioProducts Description and Business Overview
- Table 81. Boston BioProducts SDS-PAGE Products, Services and Solutions
- Table 82. Revenue (US$ Million) in SDS-PAGE Business of Boston BioProducts (2019-2024)
- Table 83. Boston BioProducts Recent Developments
- Table 84. Cleaver Scientific Basic Information List
- Table 85. Cleaver Scientific Description and Business Overview
- Table 86. Cleaver Scientific SDS-PAGE Products, Services and Solutions
- Table 87. Revenue (US$ Million) in SDS-PAGE Business of Cleaver Scientific (2019-2024)
- Table 88. Hycult Biotech Basic Information List
- Table 89. Hycult Biotech Description and Business Overview
- Table 90. Hycult Biotech SDS-PAGE Products, Services and Solutions
- Table 91. Revenue (US$ Million) in SDS-PAGE Business of Hycult Biotech (2019-2024)
- Table 92. Hycult Biotech Recent Developments
- Table 93. Elabscience Bionovation Basic Information List
- Table 94. Elabscience Bionovation Description and Business Overview
- Table 95. Elabscience Bionovation SDS-PAGE Products, Services and Solutions
- Table 96. Revenue (US$ Million) in SDS-PAGE Business of Elabscience Bionovation (2019-2024)
- Table 97. Elabscience Bionovation Recent Developments
- Table 98. Cepham Life Sciences Basic Information List
- Table 99. Cepham Life Sciences Description and Business Overview
- Table 100. Cepham Life Sciences SDS-PAGE Products, Services and Solutions
- Table 101. Revenue (US$ Million) in SDS-PAGE Business of Cepham Life Sciences (2019-2024)
- Table 102. Beijing Qualityard Biotechnology Basic Information List
- Table 103. Beijing Qualityard Biotechnology Description and Business Overview
- Table 104. Beijing Qualityard Biotechnology SDS-PAGE Products, Services and Solutions
- Table 105. Revenue (US$ Million) in SDS-PAGE Business of Beijing Qualityard Biotechnology (2019-2024)
- Table 106. Guangzhou Seyotin Basic Information List
- Table 107. Guangzhou Seyotin Description and Business Overview
- Table 108. Guangzhou Seyotin SDS-PAGE Products, Services and Solutions
- Table 109. Revenue (US$ Million) in SDS-PAGE Business of Guangzhou Seyotin (2019-2024)
- Table 110. GenDEPOT Basic Information List
- Table 111. GenDEPOT Description and Business Overview
- Table 112. GenDEPOT SDS-PAGE Products, Services and Solutions
- Table 113. Revenue (US$ Million) in SDS-PAGE Business of GenDEPOT (2019-2024)
- Table 114. Shanghai Genefist Basic Information List
- Table 115. Shanghai Genefist Description and Business Overview
- Table 116. Shanghai Genefist SDS-PAGE Products, Services and Solutions
- Table 117. Revenue (US$ Million) in SDS-PAGE Business of Shanghai Genefist (2019-2024)
- Table 118. North America SDS-PAGE Market Size Growth Rate (CAGR) by Country (US$ Million): 2019 VS 2023 VS 2030
- Table 119. North America SDS-PAGE Market Size by Country (2019-2024) & (US$ Million)
- Table 120. North America SDS-PAGE Market Size by Country (2025-2030) & (US$ Million)
- Table 121. Europe SDS-PAGE Market Size Growth Rate (CAGR) by Country (US$ Million): 2019 VS 2023 VS 2030
- Table 122. Europe SDS-PAGE Market Size by Country (2019-2024) & (US$ Million)
- Table 123. Europe SDS-PAGE Market Size by Country (2025-2030) & (US$ Million)
- Table 124. Europe SDS-PAGE Market Share by Country (2019-2024)
- Table 125. Europe SDS-PAGE Market Share by Country (2025-2030)
- Table 126. Asia-Pacific SDS-PAGE Market Size Growth Rate (CAGR) by Region (US$ Million): 2019 VS 2023 VS 2030
- Table 127. Asia-Pacific SDS-PAGE Market Size by Region (2019-2024) & (US$ Million)
- Table 128. Asia-Pacific SDS-PAGE Market Size by Region (2025-2030) & (US$ Million)
- Table 129. Asia-Pacific SDS-PAGE Market Share by Region (2019-2024)
- Table 130. Asia-Pacific SDS-PAGE Market Share by Region (2025-2030)
- Table 131. Latin America SDS-PAGE Market Size Growth Rate (CAGR) by Country (US$ Million): 2019 VS 2023 VS 2030
- Table 132. Latin America SDS-PAGE Market Size by Country (2019-2024) & (US$ Million)
- Table 133. Latin America SDS-PAGE Market Size by Country (2025-2030) & (US$ Million)
- Table 134. Middle East and Africa SDS-PAGE Market Size Growth Rate (CAGR) by Country (US$ Million): 2019 VS 2023 VS 2030
- Table 135. Middle East & Africa SDS-PAGE Market Size by Country (2019-2024) & (US$ Million)
- Table 136. Middle East & Africa SDS-PAGE Market Size by Country (2025-2030) & (US$ Million)
- Table 137. SDS-PAGE Market Trends
- Table 138. SDS-PAGE Market Drivers
- Table 139. SDS-PAGE Market Challenges
- Table 140. SDS-PAGE Market Restraints
- Table 141. Research Programs/Design for This Report
- Table 142. Key Data Information from Secondary Sources
- Table 143. Key Data Information from Primary Sources
List of Figures
- Figure 1. SDS-PAGE Product Picture
- Figure 2. Global SDS-PAGE Market Size Year-over-Year (2019-2030) & (US$ Million)
- Figure 3. Global SDS-PAGE Market Size, (US$ Million), 2019 VS 2023 VS 2030
- Figure 4. Global SDS-PAGE Market Share by Region: 2023 VS 2030
- Figure 5. Global SDS-PAGE Forecasted Market Size Share by Region (2019-2030)
- Figure 6. North America SDS-PAGE Market Size Growth Rate (2019-2030) & (US$ Million)
- Figure 7. Europe SDS-PAGE Market Size Growth Rate (2019-2030) & (US$ Million)
- Figure 8. Asia-Pacific SDS-PAGE Market Size Growth Rate (2019-2030) & (US$ Million)
- Figure 9. Latin America SDS-PAGE Market Size Growth Rate (2019-2030) & (US$ Million)
- Figure 10. Middle East & Africa SDS-PAGE Market Size Growth Rate (2019-2030) & (US$ Million)
- Figure 11. Product Picture of Reagents
- Figure 12. Global Reagents Market Size YoY Growth (2019-2030) & (US$ Million)
- Figure 13. Product Picture of Gels
- Figure 14. Global Gels Market Size YoY Growth (2019-2030) & (US$ Million)
- Figure 15. Product Picture of Instruments
- Figure 16. Global Instruments Market Size YoY Growth (2019-2030) & (US$ Million)
- Figure 17. Global SDS-PAGE Market Size Share by Type: 2023 & 2030
- Figure 18. North America SDS-PAGE Revenue Market Share by Type (2019-2030)
- Figure 19. Europe SDS-PAGE Revenue Market Share by Type (2019-2030)
- Figure 20. Asia-Pacific SDS-PAGE Revenue Market Share by Type (2019-2030)
- Figure 21. Latin America SDS-PAGE Revenue Market Share by Type (2019-2030)
- Figure 22. Middle East and Africa SDS-PAGE Revenue Market Share by Type (2019-2030)
- Figure 23. Biotechnology and Pharmaceutical Market Size (US$ Million) & YoY Growth (2019-2030)
- Figure 24. Clinical Research Market Size (US$ Million) & YoY Growth (2019-2030)
- Figure 25. Academic Institution Market Size (US$ Million) & YoY Growth (2019-2030)
- Figure 26. Others Market Size (US$ Million) & YoY Growth (2019-2030)
- Figure 27. Global SDS-PAGE Revenue Share by Application: 2023 & 2030
- Figure 28. North America SDS-PAGE Revenue Market Share by Application (2019-2030)
- Figure 29. Europe SDS-PAGE Revenue Market Share by Application (2019-2030)
- Figure 30. Asia-Pacific SDS-PAGE Revenue Market Share by Application (2019-2030)
- Figure 31. Latin America SDS-PAGE Revenue Market Share by Application (2019-2030)
- Figure 32. Middle East and Africa SDS-PAGE Revenue Market Share by Application (2019-2030)
- Figure 33. SDS-PAGE Market Share by Company Type (Tier 1, Tier 2, and Tier 3): 2019 VS 2023
- Figure 34. The Top 10 and Top 5 Players Market Share by SDS-PAGE Sales in 2023
- Figure 35. North America SDS-PAGE Market Share by Country (2019-2030)
- Figure 36. United States SDS-PAGE Market Size (2019-2030) & (US$ Million)
- Figure 37. Canada SDS-PAGE Market Size (2019-2030) & (US$ Million)
- Figure 38. Germany SDS-PAGE Market Size (2019-2030) & (US$ Million)
- Figure 39. France SDS-PAGE Market Size (2019-2030) & (US$ Million)
- Figure 40. U.K. SDS-PAGE Market Size (2019-2030) & (US$ Million)
- Figure 41. Italy SDS-PAGE Market Size (2019-2030) & (US$ Million)
- Figure 42. Russia SDS-PAGE Market Size (2019-2030) & (US$ Million)
- Figure 43. Asia-Pacific SDS-PAGE Market Share by Region (2019-2030)
- Figure 44. China SDS-PAGE Market Size (2019-2030) & (US$ Million)
- Figure 45. Japan SDS-PAGE Market Size (2019-2030) & (US$ Million)
- Figure 46. South Korea SDS-PAGE Market Size (2019-2030) & (US$ Million)
- Figure 47. Southeast Asia SDS-PAGE Market Size (2019-2030) & (US$ Million)
- Figure 48. India SDS-PAGE Market Size (2019-2030) & (US$ Million)
- Figure 49. Australia SDS-PAGE Market Size (2019-2030) & (US$ Million)
- Figure 50. Latin America SDS-PAGE Market Share by Country (2019-2030)
- Figure 51. Mexico SDS-PAGE Market Size (2019-2030) & (US$ Million)
- Figure 52. Brazil SDS-PAGE Market Size (2019-2030) & (US$ Million)
- Figure 53. Middle East & Africa SDS-PAGE Market Share by Country (2019-2030)
- Figure 54. Saudi Arabia SDS-PAGE Market Size (2019-2030) & (US$ Million)
- Figure 55. UAE SDS-PAGE Market Size (2019-2030) & (US$ Million)
- Figure 56. Egypt SDS-PAGE Market Size (2019-2030) & (US$ Million)
- Figure 57. South Africa SDS-PAGE Market Size (2019-2030) & (US$ Million)
- Figure 58. Bottom-up and Top-down Approaches for This Report
- Figure 59. Data Triangulation
Global SDS-PAGE market size in terms of revenue is projected to reach 541.00 Million USD by 2030 from 356.53 Million USD in 2023, with a CAGR 6.16% during 2024-2030.
North America market for SDS-PAGE is estimated to increase from 142.11 million USD in 2023 to reach 205.34 million USD by 2030, at a CAGR of 5.62% during the forecast period of 2024 through 2030.
Europe market for SDS-PAGE is estimated to increase from 85.84 million USD in 2023 to reach 126.21 million USD by 2030, at a CAGR of 5.58% during the forecast period of 2024 through 2030.
Asia-Pacific market for SDS-PAGE is estimated to increase from 109.01 million USD in 2023 to reach 179.10 million USD by 2030, at a CAGR of 7.14% during the forecast period of 2024 through 2030.
Latin America market for SDS-PAGE is estimated to increase from 9.96 million USD in 2023 to reach 15.43 million USD by 2030, at a CAGR of 6.49% during the forecast period of 2024 through 2030.
Middle East and Africa market for SDS-PAGE is estimated to increase from 9.61 million USD in 2023 to reach 14.92 million USD by 2030, at a CAGR of 6.79% during the forecast period of 2024 through 2030.
The major global manufacturers of SDS-PAGE include Thermo Fisher, Danaher, Merck, Bio-Rad Laboratories, GenScript, Beijing Liuyi Biotechnology, Rockland Immunochemicals, Boston BioProducts, Cleaver Scientific (Thistle Scientific), Hycult Biotech, etc. In 2023, the world's top five vendors accounted for approximately 44.94% of the revenue.
This report aims to provide a comprehensive presentation of the global market for SDS-PAGE, with both quantitative and qualitative analysis, to help readers develop business/growth strategies, assess the market competitive situation, analyze their position in the current marketplace, and make informed business decisions regarding SDS-PAGE.
For a more in-depth understanding of the market, the report provides profiles of the competitive landscape, key competitors, and their respective market ranks. The report also discusses technological trends and new product developments.
This report will help the readers to understand the competition within the industries and strategies for the competitive environment to enhance the potential profit. The report also focuses on the competitive landscape of the global SDS-PAGE market, and introduces in detail the market share, industry ranking, competitor ecosystem, market performance, new product development, operation situation, expansion, and acquisition. etc. of the main players, which helps the readers to identify the main competitors and deeply understand the competition pattern of the market.
Market Segmentation
This report covers the SDS-PAGE segments by company, by Type, by Application, by region and country, and provides market size and CAGR for the history and forecast period (2019-2024, 2025-2030), considering 2023 as the base year. It elucidates potential revenue opportunities across different segments and explains attractive investment proposition matrices for this market.
By Company
- Thermo Fisher
- Danaher
- Merck
- Bio-Rad Laboratories
- GenScript
- Beijing Liuyi Biotechnology
- Rockland Immunochemicals
- Boston BioProducts
- Cleaver Scientific (Thistle Scientific)
- Hycult Biotech
- Elabscience Bionovation
- Cepham Life Sciences
- Beijing Qualityard Biotechnology
- Guangzhou Seyotin
- GenDEPOT
- Shanghai Genefist
Segment by Type
- Reagents
- Gels
- Instruments
Segment by Application
- Biotechnology and Pharmaceutical
- Clinical Research
- Academic Institution
- Others
By Region
- North America
- United States
- Canada
- Asia-Pacific
- China
- Japan
- South Korea
- Southeast Asia
- India
- Australia
- Europe
- Germany
- France
- U.K.
- Italy
- Russia
- Latin America
- Mexico
- Brazil
- Middle East & Africa
- Saudi Arabia
- UAE
- Egypt
- South Africa
Chapter Outline
Chapter One: Introduces the report scope of the report, executive summary of global and regional market size and CAGR for the history and forecast period (2019-2024, 2025-2030). It offers a high-level view of the current state of the market and its likely evolution in the short to mid-term, and long term.
Chapter Two: Provides the analysis of various market segments by Type, covering the market size and development potential of each market segment, to help readers find the blue ocean market in different market segments.
Chapter Three: Provides the analysis of various market segments by Application, covering the market size and development potential of each market segment, to help readers find the blue ocean market in different downstream markets.
Chapter Four: Detailed analysis of SDS-PAGE companies' competitive landscape, revenue, market share and ranking, latest development plan, merger, and acquisition information, etc.
Chapter Five: Provides profiles of key players, introducing the basic situation of the main companies in the market in detail, including product introduction, revenue, recent development, etc.
Chapter Six, Seven, Eight, Nine and Ten: North America, Europe, Asia Pacific, Latin America, Middle East & Africa, revenue by country.
Chapter Eleven: this section also introduces the market dynamics, latest developments of the market, the driving factors and restrictive factors of the market, the challenges and risks faced by companies in the industry, and the analysis of relevant policies in the industry.
Chapter Twelve: Research Finding/Conclusion
Table of Contents
1 Market Overview of SDS-PAGE
- 1.1 SDS-PAGE Market Overview
- 1.1.1 SDS-PAGE Product Scope
- 1.1.2 SDS-PAGE Market Status and Outlook
- 1.2 Global SDS-PAGE Market Size Overview by Region 2019 VS 2023 VS 2030
- 1.3 Global SDS-PAGE Market Size by Region (2019-2030)
- 1.3.1 Global SDS-PAGE Historic Market Size by Region (2019-2024)
- 1.3.2 Global SDS-PAGE Market Size Forecast by Region (2025-2030)
- 1.4 Key Regions SDS-PAGE Market Size (2019-2030)
- 1.4.1 North America SDS-PAGE Market Size (2019-2030)
- 1.4.2 Europe SDS-PAGE Market Size (2019-2030)
- 1.4.3 Asia-Pacific SDS-PAGE Market Size (2019-2030)
- 1.4.4 Latin America SDS-PAGE Market Size (2019-2030)
- 1.4.5 Middle East & Africa SDS-PAGE Market Size (2019-2030)
2 SDS-PAGE Market by Type
- 2.1 Introduction
- 2.1.1 Reagents
- 2.1.2 Gels
- 2.1.3 Instruments
- 2.2 Global SDS-PAGE Market Size by Type: 2019 VS 2023 VS 2030
- 2.2.1 Global SDS-PAGE Historic Market Size by Type (2019-2024)
- 2.2.2 Global SDS-PAGE Forecasted Market Size by Type (2025-2030)
- 2.3 Key Regions Market Size by Type
- 2.3.1 North America SDS-PAGE Revenue Breakdown by Type (2019-2030)
- 2.3.2 Europe SDS-PAGE Revenue Breakdown by Type (2019-2030)
- 2.3.3 Asia-Pacific SDS-PAGE Revenue Breakdown by Type (2019-2030)
- 2.3.4 Latin America SDS-PAGE Revenue Breakdown by Type (2019-2030)
- 2.3.5 Middle East and Africa SDS-PAGE Revenue Breakdown by Type (2019-2030)
3 SDS-PAGE Market Overview by Application
- 3.1 Introduction
- 3.1.1 Biotechnology and Pharmaceutical
- 3.1.2 Clinical Research
- 3.1.3 Academic Institution
- 3.1.4 Others
- 3.2 Global SDS-PAGE Market Size by Application: 2019 VS 2023 VS 2030
- 3.2.1 Global SDS-PAGE Historic Revenue by Application (2019-2024)
- 3.2.2 Global SDS-PAGE Forecasted Revenue by Application (2025-2030)
- 3.3 Key Regions Market Size by Application
- 3.3.1 North America SDS-PAGE Revenue Breakdown by Application (2019-2030)
- 3.3.2 Europe SDS-PAGE Revenue Breakdown by Application (2019-2030)
- 3.3.3 Asia-Pacific SDS-PAGE Revenue Breakdown by Application (2019-2030)
- 3.3.4 Latin America SDS-PAGE Revenue Breakdown by Application (2019-2030)
- 3.3.5 Middle East and Africa SDS-PAGE Revenue Breakdown by Application (2019-2030)
4 SDS-PAGE Competition Analysis by Players
- 4.1 Global SDS-PAGE Market Size by Players (2019-2024)
- 4.2 Global Top Players by Company Type (Tier 1, Tier 2, and Tier 3) & (based on the Revenue in SDS-PAGE as of 2023)
- 4.3 Global Key Players of SDS-PAGE Head office and Area Served
- 4.4 Global Key Players of SDS-PAGE, Product and Application
- 4.5 Global Key Players of SDS-PAGE, Date of Enter into This Industry
- 4.6 Competitive Status
- 4.6.1 SDS-PAGE Market Concentration Rate
- 4.6.2 Mergers & Acquisitions, Expansion Plans
5 Company (Top Players) Profiles
- 5.1 Thermo Fisher Scientific
- 5.1.1 Thermo Fisher Scientific Profile
- 5.1.2 Thermo Fisher Scientific Main Business
- 5.1.3 Thermo Fisher Scientific SDS-PAGE Products, Services and Solutions
- 5.1.4 Thermo Fisher Scientific SDS-PAGE Revenue (US$ Million) & (2019-2024)
- 5.1.5 Thermo Fisher Scientific Recent Developments
- 5.2 Danaher
- 5.2.1 Danaher Profile
- 5.2.2 Danaher Main Business
- 5.2.3 Danaher SDS-PAGE Products, Services and Solutions
- 5.2.4 Danaher SDS-PAGE Revenue (US$ Million) & (2019-2024)
- 5.2.5 Danaher Recent Developments
- 5.3 Merck
- 5.3.1 Merck Profile
- 5.3.2 Merck Main Business
- 5.3.3 Merck SDS-PAGE Products, Services and Solutions
- 5.3.4 Merck SDS-PAGE Revenue (US$ Million) & (2019-2024)
- 5.3.5 Merck Recent Developments
- 5.4 Bio-Rad Laboratories
- 5.4.1 Bio-Rad Laboratories Profile
- 5.4.2 Bio-Rad Laboratories Main Business
- 5.4.3 Bio-Rad Laboratories SDS-PAGE Products, Services and Solutions
- 5.4.4 Bio-Rad Laboratories SDS-PAGE Revenue (US$ Million) & (2019-2024)
- 5.4.5 Bio-Rad Laboratories Recent Developments
- 5.5 GenScript
- 5.5.1 GenScript Profile
- 5.5.2 GenScript Main Business
- 5.5.3 GenScript SDS-PAGE Products, Services and Solutions
- 5.5.4 GenScript SDS-PAGE Revenue (US$ Million) & (2019-2024)
- 5.5.5 GenScript Recent Developments
- 5.6 Beijing Liuyi Biotechnology
- 5.6.1 Beijing Liuyi Biotechnology Profile
- 5.6.2 Beijing Liuyi Biotechnology Main Business
- 5.6.3 Beijing Liuyi Biotechnology SDS-PAGE Products, Services and Solutions
- 5.6.4 Beijing Liuyi Biotechnology SDS-PAGE Revenue (US$ Million) & (2019-2024)
- 5.6.5 Beijing Liuyi Biotechnology Recent Developments
- 5.7 Rockland Immunochemicals
- 5.7.1 Rockland Immunochemicals Profile
- 5.7.2 Rockland Immunochemicals Main Business
- 5.7.3 Rockland Immunochemicals SDS-PAGE Products, Services and Solutions
- 5.7.4 Rockland Immunochemicals SDS-PAGE Revenue (US$ Million) & (2019-2024)
- 5.7.5 Rockland Immunochemicals Recent Developments
- 5.8 Boston BioProducts
- 5.8.1 Boston BioProducts Profile
- 5.8.2 Boston BioProducts Main Business
- 5.8.3 Boston BioProducts SDS-PAGE Products, Services and Solutions
- 5.8.4 Boston BioProducts SDS-PAGE Revenue (US$ Million) & (2019-2024)
- 5.8.5 Boston BioProducts Recent Developments
- 5.9 Cleaver Scientific (Thistle Scientific)
- 5.9.1 Cleaver Scientific Profile
- 5.9.2 Cleaver Scientific Main Business
- 5.9.3 Cleaver Scientific SDS-PAGE Products, Services and Solutions
- 5.9.4 Cleaver Scientific SDS-PAGE Revenue (US$ Million) & (2019-2024)
- 5.10 Hycult Biotech
- 5.10.1 Hycult Biotech Profile
- 5.10.2 Hycult Biotech Main Business
- 5.10.3 Hycult Biotech SDS-PAGE Products, Services and Solutions
- 5.10.4 Hycult Biotech SDS-PAGE Revenue (US$ Million) & (2019-2024)
- 5.10.5 Hycult Biotech Recent Developments
- 5.11 Elabscience Bionovation
- 5.11.1 Elabscience Bionovation Profile
- 5.11.2 Elabscience Bionovation Main Business
- 5.11.3 Elabscience Bionovation SDS-PAGE Products, Services and Solutions
- 5.11.4 Elabscience Bionovation SDS-PAGE Revenue (US$ Million) & (2019-2024)
- 5.11.5 Elabscience Bionovation Recent Developments
- 5.12 Cepham Life Sciences
- 5.12.1 Cepham Life Sciences Profile
- 5.12.2 Cepham Life Sciences Main Business
- 5.12.3 Cepham Life Sciences SDS-PAGE Products, Services and Solutions
- 5.12.4 Cepham Life Sciences SDS-PAGE Revenue (US$ Million) & (2019-2024)
- 5.13 Beijing Qualityard Biotechnology
- 5.13.1 Beijing Qualityard Biotechnology Profile
- 5.13.2 Beijing Qualityard Biotechnology Main Business
- 5.13.3 Beijing Qualityard Biotechnology SDS-PAGE Products, Services and Solutions
- 5.13.4 Beijing Qualityard Biotechnology SDS-PAGE Revenue (US$ Million) & (2019-2024)
- 5.14 Guangzhou Seyotin
- 5.14.1 Guangzhou Seyotin Profile
- 5.14.2 Guangzhou Seyotin Main Business
- 5.14.3 Guangzhou Seyotin SDS-PAGE Products, Services and Solutions
- 5.14.4 Guangzhou Seyotin SDS-PAGE Revenue (US$ Million) & (2019-2024)
- 5.15 GenDEPOT
- 5.15.1 GenDEPOT Profile
- 5.15.2 GenDEPOT Main Business
- 5.15.3 GenDEPOT SDS-PAGE Products, Services and Solutions
- 5.15.4 GenDEPOT SDS-PAGE Revenue (US$ Million) & (2019-2024)
- 5.16 Shanghai Genefist
- 5.16.1 Shanghai Genefist Profile
- 5.16.2 Shanghai Genefist Main Business
- 5.16.3 Shanghai Genefist SDS-PAGE Products, Services and Solutions
- 5.16.4 Shanghai Genefist SDS-PAGE Revenue (US$ Million) & (2019-2024)
6 North America
- 6.1 North America SDS-PAGE Market Size by Country (2019-2030)
- 6.2 United States
- 6.3 Canada
7 Europe
- 7.1 Europe SDS-PAGE Market Size by Country (2019-2030)
- 7.2 Germany
- 7.3 France
- 7.4 U.K.
- 7.5 Italy
- 7.6 Russia
8 Asia-Pacific
- 8.1 Asia-Pacific SDS-PAGE Market Size by Region (2019-2030)
- 8.2 China
- 8.3 Japan
- 8.4 South Korea
- 8.5 Southeast Asia
- 8.6 India
- 8.7 Australia
9 Latin America
- 9.1 Latin America SDS-PAGE Market Size by Country (2019-2030)
- 9.2 Mexico
- 9.3 Brazil
10 Middle East & Africa
- 10.1 Middle East & Africa SDS-PAGE Market Size by Country
- 10.2 Saudi Arabia
- 10.3 UAE
- 10.4 Egypt
- 10.5 South Africa
11 SDS-PAGE Market Dynamics
- 11.1 SDS-PAGE Industry Trends
- 11.2 SDS-PAGE Market Drivers
- 11.3 SDS-PAGE Market Challenges
- 11.4 SDS-PAGE Market Restraints
12 Research Finding/Conclusion
13 Methodology and Data Source
- 13.1 Methodology/Research Approach
- 13.1.1 Research Programs/Design
- 13.1.2 Market Size Estimation
- 13.1.3 Market Breakdown and Data Triangulation
- 13.2 Data Source
- 13.2.1 Secondary Sources
- 13.2.2 Primary Sources
- 13.3 Author List
- 13.4 Disclaimer

