|
|
市場調査レポート
商品コード
1421017
コンポジットホースの世界市場:2024年Global Composite Hose Market Research Report 2024 |
||||||
|
|||||||
カスタマイズ可能
適宜更新あり
|
|||||||

| コンポジットホースの世界市場:2024年 |
|
出版日: 2024年02月06日
発行: QYResearch
ページ情報: 英文 137 Pages
納期: 2~3営業日
|

全表示
- 概要
- 図表
- 目次
世界のコンポジットホースの市場規模は、2023年の11億1,000万米ドルから、予測期間中は5.63%のCAGRで推移し、2030年には16億3,000万米ドルの規模に成長すると予測されています。
当レポートでは、世界のコンポジットホースの市場を調査し、市場および製品の概要、市場成長への各種影響因子の分析、市場規模の推移・予測、タイプ・用途別の内訳、地域・主要国別の詳細分析、競合環境、市場シェア、ランキング、主要企業のプロファイルなどをまとめています。
目次
第1章 コンポジットホース:市場概要
- 製品の定義
- コンポジットホース:タイプ別
- 価格の比較
- 一般タイプ
- 極低温タイプ
- コンポジットホース:用途別
- 市場規模
- 化学薬品
- 石油&ガス
- その他
- 世界市場の成長見通し
- 収益の推計・予測
- 販売量の推計・予測
- 平均価格の推計・予測
- 前提と制限
第2章 コンポジットホース市場の競合情勢:製造業者別
- 販売量のシェア:製造業者別
- 収益のシェア:製造業者別
- 平均価格:製造業者別
- 主要企業:業界ランキング
- 競合情勢・動向
- M&A・拡大
第3章 世界のコンポジットホース市場のシナリオ:地域別
- 市場規模:地域別:2019 vs 2023 vs 2030
- 販売量の推移・予測
- 収益の推移・予測
- 北米市場のデータ:国別
- 欧州市場のデータ:国別
- アジア太平洋市場のデータ:国別
- ラテンアメリカ市場のデータ:国別
- 中東・アフリカ市場のデータ:国別
第4章 タイプ別セグメント
- 販売量の推移・予測・市場シェア
- 収益の推移・予測・市場シェア
- 価格の推移・予測
第5章 用途別セグメント
- 販売量の推移・予測・市場シェア
- 収益の推移・予測・市場シェア
- 価格の推移・予測
第6章 主要企業の概要
- Trelleborg
- Semperit
- Smith Industrial
- Alfagomma
- Bridgestone
- Parker Hannifin
- Watson Marlow
- Hansa-Flex
- MIB Italiana
- Flex-Tek
- Aerosun
- Polyhose Group
- Novaflex
- Meiji Rubber & Chemical
- Gasso Equipment
- NOV Inc.
第7章 産業チェーンと販売チャネルの分析
- 産業チェーン分析
- 主要原材料
- 販売およびマーケティング
- 販売代理店
- 顧客
第8章 コンポジットホース:市場力学
- 業界の動向
- 市場促進要因
- 市場の課題
第9章 調査結果・総論
第10章 調査手法・データソース
List of Tables
- Table 1. Global Composite Hose Market Value Comparison by Type (2024-2030) & (US$ Million)
- Table 2. Global Composite Hose Market Value by Application (2024-2030) & (US$ Million)
- Table 3. Global Composite Hose Market Competitive Situation by Manufacturers in 2023
- Table 4. Global Composite Hose Sales (Km) of Key Manufacturers (2019-2024)
- Table 5. Global Composite Hose Sales Market Share by Manufacturers (2019-2024)
- Table 6. Global Composite Hose Revenue (US$ Million) by Manufacturers (2019-2024)
- Table 7. Global Composite Hose Revenue Share by Manufacturers (2019-2024)
- Table 8. Global Market Composite Hose Average Price (US$/Meter) of Key Manufacturers (2019-2024)
- Table 9. Global Key Players of Composite Hose, Industry Ranking, 2022 VS 2023
- Table 10. Global Manufacturers Market Concentration Ratio (CR5 and HHI)
- Table 11. Global Composite Hose by Company Type (Tier 1, Tier 2, and Tier 3) & (based on the Revenue in Composite Hose as of 2023)
- Table 12. Manufacturers Mergers & Acquisitions, Expansion Plans
- Table 13. Global Composite Hose Market Size by Region (US$ Million): 2019 VS 2023 VS 2030
- Table 14. Global Composite Hose Sales by Region (2019-2024) & (Km)
- Table 15. Global Composite Hose Sales Market Share by Region (2019-2024)
- Table 16. Global Composite Hose Sales by Region (2025-2030) & (Km)
- Table 17. Global Composite Hose Sales Market Share by Region (2025-2030)
- Table 18. Global Composite Hose Revenue by Region (2019-2024) & (US$ Million)
- Table 19. Global Composite Hose Revenue Market Share by Region (2019-2024)
- Table 20. Global Composite Hose Revenue by Region (2025-2030) & (US$ Million)
- Table 21. Global Composite Hose Revenue Market Share by Region (2025-2030)
- Table 22. North America Composite Hose Revenue by Country: 2019 VS 2023 VS 2030 (US$ Million)
- Table 23. North America Composite Hose Sales by Country (2019-2024) & (Km)
- Table 24. North America Composite Hose Sales by Country (2025-2030) & (Km)
- Table 25. North America Composite Hose Revenue by Country (2019-2024) & (US$ Million)
- Table 26. North America Composite Hose Revenue by Country (2025-2030) & (US$ Million)
- Table 27. Europe Composite Hose Revenue by Country: 2019 VS 2023 VS 2030 (US$ Million)
- Table 28. Europe Composite Hose Sales by Country (2019-2024) & (Km)
- Table 29. Europe Composite Hose Sales by Country (2025-2030) & (Km)
- Table 30. Europe Composite Hose Revenue by Country (2019-2024) & (US$ Million)
- Table 31. Europe Composite Hose Revenue by Country (2025-2030) & (US$ Million)
- Table 32. Asia Pacific Composite Hose Revenue by Region: 2019 VS 2023 VS 2030 (US$ Million)
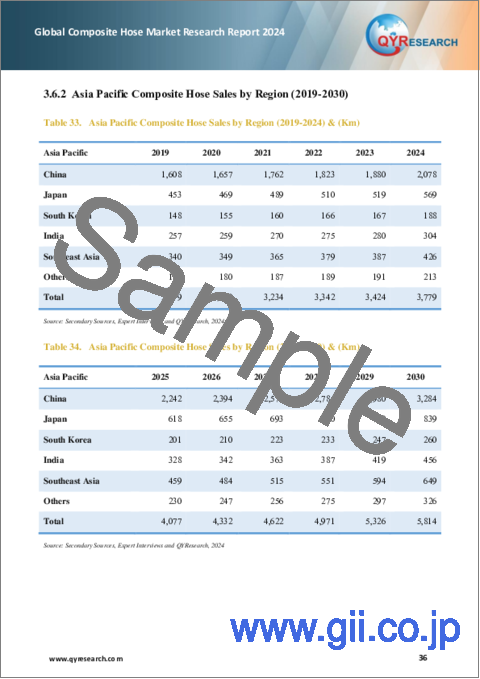
- Table 33. Asia Pacific Composite Hose Sales by Region (2019-2024) & (Km)
- Table 34. Asia Pacific Composite Hose Sales by Region (2025-2030) & (Km)
- Table 35. Asia Pacific Composite Hose Revenue by Region (2019-2024) & (US$ Million)
- Table 36. Asia Pacific Composite Hose Revenue by Region (2025-2030) & (US$ Million)
- Table 37. Latin America Composite Hose Revenue by Country: 2019 VS 2023 VS 2030 (US$ Million)
- Table 38. Latin America Composite Hose Sales by Country (2019-2024) & (Km)
- Table 39. Latin America Composite Hose Sales by Country (2025-2030) & (Km)
- Table 40. Latin America Composite Hose Revenue by Country (2019-2024) & (US$ Million)
- Table 41. Latin America Composite Hose Revenue Market Share by Country (2019-2024)
- Table 42. Middle East and Africa Composite Hose Revenue by Country: 2019 VS 2023 VS 2030 (US$ Million)
- Table 43. Middle East and Africa Composite Hose Sales by Country (2019-2024) & (Km)
- Table 44. Middle East and Africa Composite Hose Sales by Country (2025-2030) & (Km)
- Table 45. Middle East and Africa Composite Hose Revenue by Country (2019-2024) & (US$ Million)
- Table 46. Middle East and Africa Composite Hose Revenue by Country (2025-2030) & (US$ Million)
- Table 47. Global Composite Hose Sales (Km) by Type (2019-2024)
- Table 48. Global Composite Hose Sales (Km) by Type (2025-2030)
- Table 49. Global Composite Hose Sales Market Share by Type (2019-2024)
- Table 50. Global Composite Hose Sales Market Share by Type (2025-2030)
- Table 51. Global Composite Hose Revenue (US$ Million) by Type (2019-2024)
- Table 52. Global Composite Hose Revenue (US$ Million) by Type (2025-2030)
- Table 53. Global Composite Hose Revenue Market Share by Type (2019-2024)
- Table 54. Global Composite Hose Revenue Market Share by Type (2025-2030)
- Table 55. Global Composite Hose Price (US$/Meter) by Type (2019-2024)
- Table 56. Global Composite Hose Price (US$/Meter) by Type (2025-2030)
- Table 57. Global Composite Hose Sales (Km) by Application (2019-2024)
- Table 58. Global Composite Hose Sales (Km) by Application (2025-2030)
- Table 59. Global Composite Hose Sales Market Share by Application (2019-2024)
- Table 60. Global Composite Hose Sales Market Share by Application (2025-2030)
- Table 61. Global Composite Hose Revenue (US$ Million) by Application (2019-2024)
- Table 62. Global Composite Hose Revenue (US$ Million) by Application (2025-2030)
- Table 63. Global Composite Hose Revenue Market Share by Application (2019-2024)
- Table 64. Global Composite Hose Revenue Market Share by Application (2025-2030)
- Table 65. Global Composite Hose Price (US$/Meter) by Application (2019-2024)
- Table 66. Global Composite Hose Price (US$/Meter) by Application (2025-2030)
- Table 67. Trelleborg Company Information
- Table 68. Trelleborg Composite Hose Sales (Km), Revenue (US$ Million), Price (US$/Meter) and Gross Margin (2019-2024)
- Table 69. Trelleborg Composite Hose Product
- Table 70. Semperit Company Information
- Table 71. Semperit Composite Hose Sales (Km), Revenue (US$ Million), Price (US$/Meter) and Gross Margin (2019-2024)
- Table 72. Semperit Composite Hose Product
- Table 73. Smith Industrial Company Information
- Table 74. Smith Industrial Composite Hose Sales (Km), Revenue (US$ Million), Price (US$/Meter) and Gross Margin (2019-2024)
- Table 75. Smith Industrial Composite Hose Product
- Table 76. Alfagomma Company Information
- Table 77. Alfagomma Composite Hose Sales (Km), Revenue (US$ Million), Price (US$/Meter) and Gross Margin (2019-2024)
- Table 78. Alfagomma Composite Hose Product
- Table 79. Bridgestone Company Information
- Table 80. Bridgestone Composite Hose Sales (Km), Revenue (US$ Million), Price (US$/Meter) and Gross Margin (2019-2024)
- Table 81. Bridgestone Composite Hose Product
- Table 82. Parker Hannifin Company Information
- Table 83. Parker Hannifin Composite Hose Sales (Km), Revenue (US$ Million), Price (US$/Meter) and Gross Margin (2019-2024)
- Table 84. Parker Hannifin Composite Hose Product
- Table 85. Watson Marlow Company Information
- Table 86. Watson Marlow Composite Hose Sales (Km), Revenue (US$ Million), Price (US$/Meter) and Gross Margin (2019-2024)
- Table 87. Watson Marlow Composite Hose Product
- Table 88. Hansa-Flex Company Information
- Table 89. Hansa-Flex Composite Hose Sales (Km), Revenue (US$ Million), Price (US$/Meter) and Gross Margin (2019-2024)
- Table 90. Hansa-Flex Composite Hose Product
- Table 91. MIB Italiana Company Information
- Table 92. MIB Italiana Composite Hose Sales (Km), Revenue (US$ Million), Price (US$/Meter) and Gross Margin (2019-2024)
- Table 93. MIB Italiana Composite Hose Product
- Table 94. Flex-Tek Company Information
- Table 95. Flex-Tek Composite Hose Sales (Km), Revenue (US$ Million), Price (US$/Meter) and Gross Margin (2019-2024)
- Table 96. Flex-Tek Composite Hose Product
- Table 97. Aerosun Company Information
- Table 98. Aerosun Composite Hose Sales (Km), Revenue (US$ Million), Price (US$/Meter) and Gross Margin (2019-2024)
- Table 99. Aerosun Composite Hose Product
- Table 100. Polyhose Group Company Information
- Table 101. Polyhose Group Composite Hose Sales (Km), Revenue (US$ Million), Price (US$/Meter) and Gross Margin (2019-2024)
- Table 102. Polyhose Group Composite Hose Product
- Table 103. Novaflex Company Information
- Table 104. Novaflex Composite Hose Sales (Km), Revenue (US$ Million), Price (US$/Meter) and Gross Margin (2019-2024)
- Table 105. Novaflex Composite Hose Product
- Table 106. Meiji Rubber & Chemical Company Information
- Table 107. Meiji Rubber & Chemical Composite Hose Sales (Km), Revenue (US$ Million), Price (US$/Meter) and Gross Margin (2019-2024)
- Table 108. Meiji Rubber & Chemical Composite Hose Product
- Table 109. Gasso Equipment Company Information
- Table 110. Gasso Equipment Composite Hose Sales (Km), Revenue (US$ Million), Price (US$/Meter) and Gross Margin (2019-2024)
- Table 111. Gasso Equipment Composite Hose Product
- Table 112. NOV Inc. Company Information
- Table 113. NOV Inc. Composite Hose Sales (Km), Revenue (US$ Million), Price (US$/Meter) and Gross Margin (2019-2024)
- Table 114. NOV Inc. Composite Hose Product
- Table 115. Raw Materials Key Suppliers Lists
- Table 116. Composite Hose Distributors List
- Table 117. Composite Hose Customers List
- Table 118. Composite Hose Market Trends
- Table 119. Composite Hose Market Drivers
- Table 120. Composite Hose Market Challenges
- Table 121. Research Programs/Design for This Report
- Table 122. Key Data Information from Secondary Sources
- Table 123. Key Data Information from Primary Sources
- Table 124. Authors List of This Report
List of Figures
- Figure 1. Product Picture of Composite Hose
- Figure 2. Global Composite Hose Market Share by Type: 2023 & 2030
- Figure 3. General Type Product Picture
- Figure 4. Cryogenic Type Product Picture
- Figure 5. Global Composite Hose Market Share by Application: 2023 & 2030
- Figure 6. Chemical
- Figure 7. Oil & Gas
- Figure 8. Aerospace
- Figure 9. Global Composite Hose Revenue, (US$ Million), 2019 VS 2023 VS 2030
- Figure 10. Global Composite Hose Market Size (2019-2030) & (US$ Million)
- Figure 11. Global Composite Hose Sales (2019-2030) & (Km)
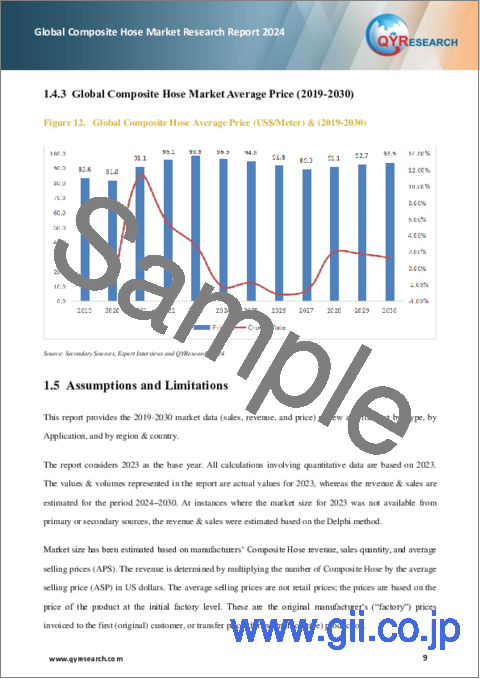
- Figure 12. Global Composite Hose Average Price (US$/Meter) & (2019-2030)
- Figure 13. Composite Hose Report Years Considered
- Figure 14. Global 5 Largest Composite Hose Players: Market Share by Revenue in Composite Hose in 2023
- Figure 15. United States Composite Hose Revenue Growth Rate (2019-2030) & (US$ Million)
- Figure 16. Canada Composite Hose Revenue Growth Rate (2019-2030) & (US$ Million)
- Figure 17. Germany Composite Hose Revenue Growth Rate (2019-2030) & (US$ Million)
- Figure 18. France Composite Hose Revenue Growth Rate (2019-2030) & (US$ Million)
- Figure 19. U.K. Composite Hose Revenue Growth Rate (2019-2030) & (US$ Million)
- Figure 20. Italy Composite Hose Revenue Growth Rate (2019-2030) & (US$ Million)
- Figure 21. China Composite Hose Revenue Growth Rate (2019-2030) & (US$ Million)
- Figure 22. Japan Composite Hose Revenue Growth Rate (2019-2030) & (US$ Million)
- Figure 23. South Korea Composite Hose Revenue Growth Rate (2019-2030) & (US$ Million)
- Figure 24. India Composite Hose Revenue Growth Rate (2019-2030) & (US$ Million)
- Figure 25. Southeast Asia Composite Hose Revenue Growth Rate (2019-2030) & (US$ Million)
- Figure 26. Mexico Composite Hose Revenue Growth Rate (2019-2030) & (US$ Million)
- Figure 27. Brazil Composite Hose Revenue Growth Rate (2019-2030) & (US$ Million)
- Figure 28. Middle East Composite Hose Revenue Growth Rate (2019-2030) & (US$ Million)
- Figure 29. Africa Composite Hose Revenue Growth Rate (2019-2030) & (US$ Million)
- Figure 30. Composite Hose Value Chain
- Figure 31. Bottom-up and Top-down Approaches for This Report
- Figure 32. Data Triangulation
- Figure 33. Key Executives Interviewed
The global Composite Hose market was valued at US$ 1.11 billion in 2023 and is anticipated to reach US$ 1.63 billion by 2030, witnessing a CAGR of 5.63% during the forecast period 2024-2030.
This report aims to provide a comprehensive presentation of the global market for Composite Hose, with both quantitative and qualitative analysis, to help readers develop business/growth strategies, assess the market competitive situation, analyze their position in the current marketplace, and make informed business decisions regarding Composite Hose.
The Composite Hose market size, estimations, and forecasts are provided in terms of sales volume (Km) and revenue ($ millions), considering 2023 as the base year, with history and forecast data for the period from 2019 to 2030. This report segments the global Composite Hose market comprehensively. Regional market sizes, concerning products by Type, by Application, and by players, are also provided.
For a more in-depth understanding of the market, the report provides profiles of the competitive landscape, key competitors, and their respective market ranks. The report also discusses technological trends and new product developments.
The report will help the Composite Hose manufacturers, new entrants, and industry chain related companies in this market with information on the revenues, sales volume, and average price for the overall market and the sub-segments across the different segments, by company, by Type, by Application, and by regions.
Market Segmentation
By Company
- Trelleborg
- Semperit
- Smith Industrial
- Alfagomma
- Bridgestone
- Parker Hannifin
- Watson Marlow
- Hansa-Flex
- MIB Italiana
- Aerosun
- Polyhose Group
- Flex-Tek
- Novaflex
- Meiji Rubber & Chemical
- Gasso Equipment
- NOV Inc.
Segment by Type
- General Type
- Cryogenic Type
Segment by Application
- Chemical
- Oil & Gas
- Others
Consumption by Region
- North America
- U.S.
- Canada
- Asia-Pacific
- China
- Japan
- South Korea
- Southeast Asia
- India
- Europe
- Germany
- France
- U.K.
- Italy
- Rest of Europe
- Latin America
- Mexico
- Brazil
- Rest of Latin America
Chapter Outline
Chapter 1: Introduces the report scope of the report, executive summary of different market segments (by region, product type, application, etc), including the market size of each market segment, future development potential, and so on. It offers a high-level view of the current state of the market and its likely evolution in the short to mid-term, and long term.
Chapter 2: Detailed analysis of Composite Hose manufacturers competitive landscape, price, sales and revenue market share, merger, and acquisition information, etc.
Chapter 3: Sales, revenue of Composite Hose in regional level and country level. It provides a quantitative analysis of the market size and development potential of each region and its main countries and introduces the market development, future development prospects, market space, and market size of each country in the world.
Chapter 4: Provides the analysis of various market segments by Type, covering the market size and development potential of each market segment, to help readers find the blue ocean market in different market segments.
Chapter 5: Provides the analysis of various market segments by Application, covering the market size and development potential of each market segment, to help readers find the blue ocean market in different downstream markets.
Chapter 6: Provides profiles of key players, introducing the basic situation of the main companies in the market in detail, including product sales, revenue, price, gross margin, product introduction, etc.
Chapter 7: Analysis of industrial chain, including the upstream and downstream of the industry.
Chapter 8: Introduces the market dynamics, latest developments of the market, the driving factors and restrictive factors of the market, the challenges and risks faced by manufacturers in the industry, and the analysis of relevant policies in the industry.
Chapter 9: The main points and conclusions of the report.
Table of Contents
1 Composite Hose Market Overview
- 1.1 Product Definition
- 1.2 Composite Hose by Type
- 1.2.1 Global Composite Hose Market Value Comparison by Type (2024-2030)
- 1.2.2 General Type
- 1.2.3 Cryogenic Type
- 1.3 Composite Hose by Application
- 1.3.1 Global Composite Hose Market Value by Application (2024-2030)
- 1.3.2 Chemical
- 1.3.3 Oil & Gas
- 1.3.4 Others
- 1.4 Global Composite Hose Market Size Estimates and Forecasts
- 1.4.1 Global Composite Hose Revenue 2019-2030
- 1.4.2 Global Composite Hose Sales 2019-2030
- 1.4.3 Global Composite Hose Market Average Price (2019-2030)
- 1.5 Assumptions and Limitations
2 Composite Hose Market Competition by Manufacturers
- 2.1 Global Composite Hose Sales Market Share by Manufacturers (2019-2024)
- 2.2 Global Composite Hose Revenue Market Share by Manufacturers (2019-2024)
- 2.3 Global Composite Hose Average Price by Manufacturers (2019-2024)
- 2.4 Global Key Players of Composite Hose, Industry Ranking, 2022 VS 2023
- 2.5 Global Composite Hose Market Competitive Situation and Trends
- 2.5.1 Global Composite Hose Market Concentration Rate
- 2.5.2 The Global 5 Largest Composite Hose Players Market Share by Revenue
- 2.5.3 Global Composite Hose Market Share by Company Type (Tier 1, Tier 2, and Tier 3)
- 2.6 Manufacturers Mergers & Acquisitions, Expansion Plans
3 Global Composite Hose Market Scenario by Region
- 3.1 Global Composite Hose Market Size by Region: 2019 Versus 2023 Versus 2030
- 3.2 Global Composite Hose Sales by Region: 2019-2030
- 3.2.1 Global Composite Hose Sales by Region: 2019-2024
- 3.2.2 Global Composite Hose Sales by Region: 2025-2030
- 3.3 Global Composite Hose Revenue by Region: 2019-2030
- 3.3.1 Global Composite Hose Revenue by Region: 2019-2024
- 3.3.2 Global Composite Hose Revenue by Region: 2025-2030
- 3.4 North America Composite Hose Market Facts & Figures by Country
- 3.4.1 North America Composite Hose Market Size by Country: 2019 VS 2023 VS 2030
- 3.4.2 North America Composite Hose Sales by Country (2019-2030)
- 3.4.3 North America Composite Hose Revenue by Country (2019-2030)
- 3.4.4 United States
- 3.4.5 Canada
- 3.5 Europe Composite Hose Market Facts & Figures by Country
- 3.5.1 Europe Composite Hose Market Size by Country: 2019 VS 2023 VS 2030
- 3.5.2 Europe Composite Hose Sales by Country (2019-2030)
- 3.5.3 Europe Composite Hose Revenue by Country (2019-2030)
- 3.5.4 Germany
- 3.5.5 France
- 3.5.6 U.K.
- 3.5.7 Italy
- 3.6 Asia Pacific Composite Hose Market Facts & Figures by Region
- 3.6.1 Asia Pacific Composite Hose Market Size by Region: 2019 VS 2023 VS 2030
- 3.6.2 Asia Pacific Composite Hose Sales by Region (2019-2030)
- 3.6.3 Asia Pacific Composite Hose Revenue by Region (2019-2030)
- 3.6.4 China
- 3.6.5 Japan
- 3.6.6 South Korea
- 3.6.7 India
- 3.6.8 Southeast Asia
- 3.7 Latin America Composite Hose Market Facts & Figures by Country
- 3.7.1 Latin America Composite Hose Market Size by Country: 2019 VS 2023 VS 2030
- 3.7.2 Latin America Composite Hose Sales by Country (2019-2030)
- 3.7.3 Latin America Composite Hose Revenue by Country
- 3.7.4 Mexico
- 3.7.5 Brazil
- 3.8 Middle East and Africa Composite Hose Market Facts & Figures by Country
- 3.8.1 Middle East and Africa Composite Hose Market Size by Country: 2019 VS 2023 VS 2030
- 3.8.2 Middle East and Africa Composite Hose Sales by Country (2019-2030)
- 3.8.3 Middle East and Africa Composite Hose Revenue by Country
- 3.8.4 Middle East
- 3.8.5 Africa
4 Segment by Type
- 4.1 Global Composite Hose Sales by Type (2019-2030)
- 4.1.1 Global Composite Hose Sales by Type (2019-2024)
- 4.1.2 Global Composite Hose Sales by Type (2025-2030)
- 4.1.3 Global Composite Hose Sales Market Share by Type (2019-2030)
- 4.2 Global Composite Hose Revenue by Type (2019-2030)
- 4.2.1 Global Composite Hose Revenue by Type (2019-2024)
- 4.2.2 Global Composite Hose Revenue by Type (2025-2030)
- 4.2.3 Global Composite Hose Revenue Market Share by Type (2019-2030)
- 4.3 Global Composite Hose Price by Type (2019-2030)
5 Segment by Application
- 5.1 Global Composite Hose Sales by Application (2019-2030)
- 5.1.1 Global Composite Hose Sales by Application (2019-2024)
- 5.1.2 Global Composite Hose Sales by Application (2025-2030)
- 5.1.3 Global Composite Hose Sales Market Share by Application (2019-2030)
- 5.2 Global Composite Hose Revenue by Application (2019-2030)
- 5.2.1 Global Composite Hose Revenue by Application (2019-2024)
- 5.2.2 Global Composite Hose Revenue by Application (2025-2030)
- 5.2.3 Global Composite Hose Revenue Market Share by Application (2019-2030)
- 5.3 Global Composite Hose Price by Application (2019-2030)
6 Key Companies Profiled
- 6.1 Trelleborg
- 6.1.1 Trelleborg Company Information
- 6.1.2 Trelleborg Description and Business Overview
- 6.1.3 Trelleborg Composite Hose Sales, Revenue and Gross Margin (2019-2024)
- 6.1.4 Trelleborg Composite Hose Product Portfolio
- 6.2 Semperit
- 6.2.1 Semperit Company Information
- 6.2.2 Semperit Description and Business Overview
- 6.2.3 Semperit Composite Hose Sales, Revenue and Gross Margin (2019-2024)
- 6.2.4 Semperit Composite Hose Product Portfolio
- 6.3 Smith Industrial
- 6.3.1 Smith Industrial Company Information
- 6.3.2 Smith Industrial Description and Business Overview
- 6.3.3 Smith Industrial Composite Hose Sales, Revenue and Gross Margin (2019-2024)
- 6.3.4 Smith Industrial Composite Hose Product Portfolio
- 6.4 Alfagomma
- 6.4.1 Alfagomma Company Information
- 6.4.2 Alfagomma Description and Business Overview
- 6.4.3 Alfagomma Composite Hose Sales, Revenue and Gross Margin (2019-2024)
- 6.4.4 Alfagomma Composite Hose Product Portfolio
- 6.5 Bridgestone
- 6.5.1 Bridgestone Company Information
- 6.5.2 Bridgestone Description and Business Overview
- 6.5.3 Bridgestone Composite Hose Sales, Revenue and Gross Margin (2019-2024)
- 6.5.4 Bridgestone Composite Hose Product Portfolio
- 6.6 Parker Hannifin
- 6.6.1 Parker Hannifin Company Information
- 6.6.2 Parker Hannifin Description and Business Overview
- 6.6.3 Parker Hannifin Composite Hose Sales, Revenue and Gross Margin (2019-2024)
- 6.6.4 Parker Hannifin Composite Hose Product Portfolio
- 6.7 Watson Marlow
- 6.7.1 Watson Marlow Company Information
- 6.7.2 Watson Marlow Description and Business Overview
- 6.7.3 Watson Marlow Composite Hose Sales, Revenue and Gross Margin (2019-2024)
- 6.7.4 Watson Marlow Composite Hose Product Portfolio
- 6.8 Hansa-Flex
- 6.8.1 Hansa-Flex Company Information
- 6.8.2 Hansa-Flex Description and Business Overview
- 6.8.3 Hansa-Flex Composite Hose Sales, Revenue and Gross Margin (2019-2024)
- 6.8.4 Hansa-Flex Composite Hose Product Portfolio
- 6.9 MIB Italiana
- 6.9.1 MIB Italiana Company Information
- 6.9.2 MIB Italiana Description and Business Overview
- 6.9.3 MIB Italiana Composite Hose Sales, Revenue and Gross Margin (2019-2024)
- 6.9.4 MIB Italiana Composite Hose Product Portfolio
- 6.10 Flex-Tek
- 6.10.1 Flex-Tek Company Information
- 6.10.2 Flex-Tek Description and Business Overview
- 6.10.3 Flex-Tek Composite Hose Sales, Revenue and Gross Margin (2019-2024)
- 6.10.4 Flex-Tek Composite Hose Product Portfolio
- 6.11 Aerosun
- 6.11.1 Aerosun Company Information
- 6.11.2 Aerosun Description and Business Overview
- 6.11.3 Aerosun Composite Hose Sales, Revenue and Gross Margin (2019-2024)
- 6.11.4 Aerosun Composite Hose Product Portfolio
- 6.12 Polyhose Group
- 6.12.1 Polyhose Group Company Information
- 6.12.2 Polyhose Group Description and Business Overview
- 6.12.3 Polyhose Group Composite Hose Sales, Revenue and Gross Margin (2019-2024)
- 6.12.4 Polyhose Group Composite Hose Product Portfolio
- 6.13 Novaflex
- 6.13.1 Novaflex Company Information
- 6.13.2 Novaflex Description and Business Overview
- 6.13.3 Novaflex Composite Hose Product Portfolio
- 6.14 Meiji Rubber & Chemical
- 6.14.1 Meiji Rubber & Chemical Company Information
- 6.14.2 Meiji Rubber & Chemical Description and Business Overview
- 6.14.3 Meiji Rubber & Chemical Composite Hose Sales, Revenue and Gross Margin (2019-2024)
- 6.14.4 Meiji Rubber & Chemical Composite Hose Product Portfolio
- 6.15 Gasso Equipment
- 6.15.1 Gasso Equipment Company Information
- 6.15.2 Gasso Equipment Description and Business Overview
- 6.15.3 Gasso Equipment Composite Hose Sales, Revenue and Gross Margin (2019-2024)
- 6.15.4 Gasso Equipment Composite Hose Product Portfolio
- 6.16 NOV Inc.
- 6.16.1 NOV Inc. Company Information
- 6.16.2 NOV Inc. Description and Business Overview
- 6.16.3 NOV Inc. Composite Hose Sales, Revenue and Gross Margin (2019-2024)
- 6.16.4 NOV Inc. Composite Hose Product Portfolio
7 Industry Chain and Sales Channels Analysis
- 7.1 Composite Hose Industry Chain Analysis
- 7.2 Composite Hose Key Raw Materials
- 7.2.1 Key Raw Materials
- 7.2.2 Raw Materials Key Suppliers
- 7.3 Composite Hose Sales and Marketing
- 7.4 Composite Hose Distributors
- 7.5 Composite Hose Customers
8 Composite Hose Market Dynamics
- 8.1 Composite Hose Industry Trends
- 8.2 Composite Hose Market Drivers
- 8.3 Composite Hose Market Challenges
9 Research Findings and Conclusion
10 Methodology and Data Source
- 10.1 Methodology/Research Approach
- 10.1.1 Research Programs/Design
- 10.1.2 Market Size Estimation
- 10.1.3 Market Breakdown and Data Triangulation
- 10.2 Data Source
- 10.2.1 Secondary Sources
- 10.2.2 Primary Sources
- 10.3 Author List
- 10.4 Disclaimer

