|
|
市場調査レポート
商品コード
1409022
ウインチ - 世界市場のシェアとランキング、全体の売上と需要の予測(2024年~2030年)Winches - Global Market Share and Ranking, Overall Sales and Demand Forecast 2024-2030 |
||||||

|
|||||||
カスタマイズ可能
適宜更新あり
|
|||||||

| ウインチ - 世界市場のシェアとランキング、全体の売上と需要の予測(2024年~2030年) |
|
出版日: 2024年01月16日
発行: QYResearch
ページ情報: 英文 157 Pages
納期: 2~3営業日
|

全表示
- 概要
- 図表
- 目次
世界のウインチの市場規模は、2023年に11億2,899万米ドル、2030年までに14億4,396万米ドルに達し、2024年~2030年の予測期間にCAGRで3.60%の成長が見込まれています。
北米市場は2023年に3億2,221万米ドル、2030年までに3億8,697万米ドルに達する見込みで、予測期間のCAGRは2.84%です。
アジア太平洋市場は2023年に3億6,187万米ドル、2030年までに4億8,324万米ドルに達する見込みで、予測期間のCAGRは4.23%です。
欧州市場は2023年に3億4,653万米ドル、2030年までに4億3,289万米ドルに達する見込みで、予測期間のCAGRは3.23%です。
当レポートでは、世界のウインチ市場について調査分析し、各地域の市場規模と予測、市場力学、競合情勢などを提供しています。
目次
第1章 市場の概要
- ウインチの製品のイントロダクション
- 世界のウインチの市場規模の予測
- 世界のウインチの売上金額(2019年~2030年)
- 世界のウインチの売上数量(2019年~2030年)
- 世界のウインチの販売価格(2019年~2030年)
- ウインチ市場の動向と促進要因
- ウインチの動向の分析
- ウインチ市場の促進要因
- ウインチ市場の抑制要因
- ポーターのファイブフォース分析
- 前提条件と制限
- 調査目的
- 調査年
第2章 競合分析:企業別
- 世界のウインチ企業の収益ランキング(2023年)
- 世界のウインチの収益:企業別(2019年~2023年)
- 世界のウインチの売上数量:企業別(2019年~2023年)
- 世界のウインチの平均価格:企業別(2019年~2023年)
- 主要メーカーのウインチの製造拠点と本社
- ウインチの主要メーカーの設立日
- ウインチ市場の競合分析
- ウインチの市場集中度(2019年~2023年)
- 世界のウインチ収益の3大・5大メーカー(2023年)
- 世界の主要メーカー:企業タイプ別(Tier 1・Tier 2・Tier 3)(2023年のウインチの収益に基づく)
- 合併と買収、拡大
第3章 セグメント:タイプ別
- イントロダクション:タイプ別
- 油圧ウインチ
- 電動ウインチ
- 船舶用ウインチ
- 世界のウインチの売上金額:タイプ別
- 世界のウインチの売上金額:タイプ別(2019年・2023年・2030年)
- 世界のウインチの売上金額:タイプ別(2019年~2030年)
- 世界のウインチの売上金額:タイプ別(2019年~2030年)
- 世界のウインチの売上数量:タイプ別
- 世界のウインチの売上数量:タイプ別(2019年・2023年・2030年)
- 世界のウインチの売上数量:タイプ別(2019年~2030年)
- 世界のウインチの売上数量:タイプ別(2019年~2030年)
- 世界のウインチの平均価格:タイプ別(2019年~2030年)
第4章 セグメント:用途別
- 世界のウインチの売上金額:用途別
- 世界のウインチの売上金額:用途別(2019年・2023年・2030年)
- 世界のウインチの売上金額:用途別(2019年~2030年)
- 世界のウインチの売上金額:用途別(2019年~2030年)
- 世界のウインチの売上数量:用途別
- 世界のウインチの売上数量:用途別(2019年・2023年・2030年)
- 世界のウインチの売上数量:用途別(2019年~2030年)
- 世界のウインチの売上数量:用途別(2019年~2030年)
- 世界のウインチの平均価格:用途別(2019年~2030年)
第5章 セグメント:地域別
- 世界のウインチの売上金額:地域別
- 世界のウインチの売上金額:地域別(2019年・2023年・2030年)
- 世界のウインチの売上金額:地域別(2019年~2024年)
- 世界のウインチの売上金額:地域別(2025年~2030年)
- 世界のウインチの売上金額:地域別(2019年~2030年)
- 世界のウインチの売上数量:地域別
- 世界のウインチの売上数量:地域別(2019年・2023年・2030年)
- 世界のウインチの売上数量:地域別(2019年~2024年)
- 世界のウインチの売上数量:地域別(2025年~2030年)
- 世界のウインチの売上数量:地域別(2019年~2030年)
- 世界のウインチの平均価格:地域別(2019年~2030年)
- 北米
- 北米のウインチの売上金額(2019年~2030年)
- 北米のウインチの売上金額:国別(2023年・2030年)
- 欧州
- 欧州のウインチの売上金額(2019年~2030年)
- 欧州のウインチの売上金額:国別(2023年・2030年)
- アジア太平洋
- アジア太平洋のウインチの売上金額(2019年~2030年)
- アジア太平洋のウインチの売上金額:地域別(2023年・2030年)
- 南米
- 南米のウインチの売上金額(2019年~2030年)
- 南米のウインチの売上金額:国別(2023年・2030年)
- 中東・アフリカ
第6章 セグメント:主要国/地域別
- 主な国/地域のウインチの売上成長の動向(2019年・2023年・2030年)
- 主要国/地域のウインチの売上金額
- 主要国/地域のウインチの売上金額(2019年~2030年)
- 主要国/地域のウインチの売上数量(2019年~2030年)
- 米国
- 米国のウインチの売上金額(2019年~2030年)
- 米国のウインチの売上金額:タイプ別(2023年・2030年)
- 米国のウインチの売上金額:用途別(2023年・2030年)
- 欧州
- 欧州のウインチの売上金額(2019年~2030年)
- 欧州のウインチの売上金額:タイプ別(2023年・2030年)
- 欧州のウインチの売上金額:用途別(2023年・2030年)
- 中国
- 中国のウインチの売上金額(2019年~2030年)
- 中国のウインチの売上金額:タイプ別(2023年・2030年)
- 中国のウインチの売上金額:用途別(2023年・2030年)
- 日本
- 日本のウインチの売上金額(2019年~2030年)
- 日本のウインチの売上金額:タイプ別(2023年・2030年)
- 日本のウインチの売上金額:用途別(2023年・2030年)
- 韓国
- 韓国のウインチの売上金額(2019年~2030年)
- 韓国のウインチの売上金額:タイプ別(2023年・2030年)
- 韓国のウインチの売上金額:用途別(2023年・2030年)
- 東南アジア
- 東南アジアのウインチの売上金額(2019年~2030年)
- 東南アジアのウインチの売上金額:タイプ別(2023年・2030年)
- 東南アジアのウインチの売上金額:用途別(2023年・2030年)
- インド
- インドのウインチの売上金額(2019年~2030年)
- インドのウインチの売上金額:タイプ別(2023年・2030年)
- インドのウインチの売上金額:用途別(2023年・2030年)
第7章 企業プロファイル
- TWG
- Paccar Winch
- Ingersoll Rand
- WARN Industries
- Huisman Group
- Dinamic Oil
- Ramsey Winch
- Dana
- Rotzler Deutschland GmbH Co. KG
- Thern, Inc.
- ZOLLERN
- PLANETA-Hebetechnik
- INI Hydraulic
- TMA Srl
- EMCE
- Wantong
- Bloom Manufacturing
- Xinhong
第8章 産業チェーン分析
- ウインチの上流の分析
- 主な原材料
- 原材料の主要サプライヤー
- 製造コスト構造
- 下流の分析(顧客分析)
- 販売モデルと販売チャネル
- ウインチの販売モデル
- 市場ポジショニング
- 価格戦略
- ブランド戦略
- ウインチの商社または販売業者、その連絡先
第9章 調査結果と結論
第10章 付録
List of Tables
- Table 1. Global Winches Revenue by Company (2019-2023) & (US$ Million)
- Table 2. Global Winches Revenue Market Share by Company (2019-2023)
- Table 3. Global Winches Sales Volume by Company (2019-2023) & (K Units)
- Table 4. Global Winches Sales Volume Market Share by Company (2019-2023)
- Table 5. Global Market Winches Price by Company (2019-2023) & (US$/Unit)
- Table 6. Key Manufacturers Winches Manufacturing Base and Headquarters
- Table 7. Winches Key Manufacturers Winches Established Date
- Table 8. Global Winches Manufacturers Market Concentration Ratio (CR5)
- Table 9. Global Top Manufacturers Market Share by Company Type (Tier 1, Tier 2, and Tier 3) & (based on the Revenue in Winches as of 2023)
- Table 10. Mergers & Acquisitions, Expansion Plans
- Table 11. Global Winches Sales Value by Type: 2019 VS 2023 VS 2030 (US$ Million)
- Table 12. Global Winches Sales Value by Type (2019-2024) & (US$ Million)
- Table 13. Global Winches Sales Value by Type (2025-2030) & (US$ Million)
- Table 14. Global Winches Sales Market Share in Value by Type (2019-2024)
- Table 15. Global Winches Sales Market Share in Value by Type (2025-2030)
- Table 16. Global Winches Sales Volume by Type: 2019 VS 2023 VS 2030 (K Units)
- Table 17. Global Winches Sales Volume by Type (2019-2024) & (K Units)
- Table 18. Global Winches Sales Volume by Type (2025-2030) & (K Units)
- Table 19. Global Winches Sales Market Share in Value by Type (2019-2024)
- Table 20. Global Winches Sales Market Share in Value by Type (2025-2030)
- Table 21. Global Winches Price by Type (2019-2024) & (US$/Unit)
- Table 22. Global Winches Price by Type (2025-2030) & (US$/Unit)
- Table 23. Global Winches Sales Value by Application: 2019 VS 2023 VS 2030 (US$ Million)
- Table 24. Global Winches Sales Value by Application (2019-2024) & (US$ Million)
- Table 25. Global Winches Sales Value by Application (2025-2030) & (US$ Million)
- Table 26. Global Winches Sales Market Share in Value by Application (2019-2024)
- Table 27. Global Winches Sales Market Share in Value by Application (2025-2030)
- Table 28. Global Winches Sales Volume by Application: 2019 VS 2023 VS 2030 (K Units)
- Table 29. Global Winches Sales Volume by Application (2019-2024) & (K Units)
- Table 30. Global Winches Sales Volume by Application (2025-2030) & (K Units)
- Table 31. Global Winches Sales Market Share in Value by Application (2019-2024)
- Table 32. Global Winches Sales Market Share in Value by Application (2025-2030)
- Table 33. Global Winches Price by Application (2019-2024) & (US$/Unit)
- Table 34. Global Winches Price by Application (2025-2030) & (US$/Unit)
- Table 35. Global Winches Sales Value by Region, (2019 VS 2023 VS 2030) & (US$ Million)
- Table 36. Global Winches Sales Value by Region (2019-2024) & (US$ Million)
- Table 37. Global Winches Sales Value by Region (2025-2030) & (US$ Million)
- Table 38. Global Winches Sales Value by Region (2019-2024) & (%)
- Table 39. Global Winches Sales Value by Region (2025-2030) & (%)
- Table 40. Global Winches Sales Volume by Region (K Units): 2019 VS 2023 VS 2030
- Table 41. Global Winches Sales Volume by Region (2019-2024) & (K Units)
- Table 42. Global Winches Sales Volume by Region (2025-2030) & (K Units)
- Table 43. Global Winches Sales Volume by Region (2019-2024) & (%)
- Table 44. Global Winches Sales Volume by Region (2025-2030) & (%)
- Table 45. Global Winches Average Price by Region (2019-2024) & (US$/Unit)
- Table 46. Global Winches Average Price by Region (2025-2030) & (US$/Unit)
- Table 47. Key Countries/Regions Winches Sales Value Growth Trends, (US$ Million): 2019 VS 2023 VS 2030
- Table 48. Key Countries/Regions Winches Sales Value, (2019-2024) & (US$ Million)
- Table 49. Key Countries/Regions Winches Sales Value, (2025-2030) & (US$ Million)
- Table 50. Key Countries/Regions Winches Sales Volume, (2019-2024) & (K Units)
- Table 51. Key Countries/Regions Winches Sales Volume, (2025-2030) & (K Units)
- Table 52. United States Winches Sales Value by Type (%), 2023 VS 2030
- Table 53. United States Winches Sales Value by Application (%), 2023 VS 2030
- Table 54. Europe Winches Sales Value by Type (%), 2023 VS 2030
- Table 55. Europe Winches Sales Value by Application (%), 2023 VS 2030
- Table 56. China Winches Sales Value by Type (%), 2023 VS 2030
- Table 57. China Winches Sales Value by Application (%), 2023 VS 2030
- Table 58. Japan Winches Sales Value by Type (%), 2023 VS 2030
- Table 59. Japan Winches Sales Value by Application (%), 2023 VS 2030
- Table 60. South Korea Winches Sales Value by Type (%), 2023 VS 2030
- Table 61. South Korea Winches Sales Value by Application (%), 2023 VS 2030
- Table 62. Southeast Asia Winches Sales Value by Type (%), 2023 VS 2030
- Table 63. Southeast Asia Winches Sales Value by Application (%), 2023 VS 2030
- Table 64. India Winches Sales Value by Type (%), 2023 VS 2030
- Table 65. India Winches Sales Value by Application (%), 2023 VS 2030
- Table 66. TWG Basic Information, Manufacturing Base and Competitors
- Table 67. TWG Major Business
- Table 68. TWG Winches Product and Services
- Table 69. TWG Winches Sales (K Units), Price (USD/Unit), Revenue (USD Million) and Gross Margin(2019-2023)
- Table 70. Paccar Winch Basic Information, Manufacturing Base and Competitors
- Table 71. Paccar Winch Major Business
- Table 72. Paccar Winch Winches Product and Services
- Table 73. Paccar Winch Winches Sales (K Units), Price (USD/Unit), Revenue (USD Million) and Gross Margin(2019-2023)
- Table 74. Ingersoll Rand Basic Information, Manufacturing Base and Competitors
- Table 75. Ingersoll Rand Major Business
- Table 76. Ingersoll Rand Winches Product and Services
- Table 77. Ingersoll Rand Winches Sales (K Units), Price (USD/Unit), Revenue (USD Million) and Gross Margin(2019-2023)
- Table 78. WARN Industries Basic Information, Manufacturing Base and Competitors
- Table 79. WARN Industries Major Business
- Table 80. WARN Industries Winches Product and Services
- Table 81. WARN Industries Winches Sales (K Units), Price (USD/Unit), Revenue (USD Million) and Gross Margin(2019-2023)
- Table 82. Huisman Group Basic Information, Manufacturing Base and Competitors
- Table 83. Huisman Group Major Business
- Table 84. Huisman Group Winches Product and Services
- Table 85. Huisman Group Winches Sales (K Units), Price (USD/Unit), Revenue (USD Million) and Gross Margin(2019-2023)
- Table 86. Dinamic Oil Basic Information, Manufacturing Base and Competitors
- Table 87. Dinamic Oil Major Business
- Table 88. Dinamic Oil Winches Product and Services
- Table 89. Dinamic Oil Winches Sales (K Units), Price (USD/Unit), Revenue (USD Million) and Gross Margin(2019-2023)
- Table 90. Ramsey Winch Basic Information, Manufacturing Base and Competitors
- Table 91. Ramsey Winch Major Business
- Table 92. Ramsey Winch Winches Product and Services
- Table 93. Ramsey Winch Winches Sales (K Units), Price (USD/Unit), Revenue (USD Million) and Gross Margin(2019-2023)
- Table 94. Dana Basic Information, Manufacturing Base and Competitors
- Table 95. Dana Major Business
- Table 96. Dana Winches Product and Services
- Table 97. Dana Winches Sales (K Units), Price (USD/Unit), Revenue (USD Million) and Gross Margin(2019-2023)
- Table 98. Rotzler Deutschland GmbH Co. KG Basic Information, Manufacturing Base and Competitors
- Table 99. Rotzler Deutschland GmbH Co. KG Major Business
- Table 100. Rotzler Deutschland GmbH Co. KG Winches Product and Services
- Table 101. Rotzler Deutschland GmbH Co. KG Winches Sales (K Units), Price (USD/Unit), Revenue (USD Million) and Gross Margin(2019-2023)
- Table 102. Thern, Inc. Basic Information, Manufacturing Base and Competitors
- Table 103. Thern, Inc. Major Business
- Table 104. Thern, Inc. Winches Product and Services
- Table 105. Thern, Inc. Winches Sales (K Units), Price (USD/Unit), Revenue (USD Million) and Gross Margin(2019-2023)
- Table 106. ZOLLERN Basic Information, Manufacturing Base and Competitors
- Table 107. ZOLLERN Major Business
- Table 108. ZOLLERN Winches Product and Services
- Table 109. ZOLLERN Winches Sales (K Units), Price (USD/Unit), Revenue (USD Million) and Gross Margin(2019-2023)
- Table 110. PLANETA-Hebetechnik Basic Information, Manufacturing Base and Competitors
- Table 111. PLANETA-Hebetechnik Major Business
- Table 112. PLANETA-Hebetechnik Winches Product and Services
- Table 113. PLANETA-Hebetechnik Winches Sales (K Units), Price (USD/Unit), Revenue (USD Million) and Gross Margin(2019-2023)
- Table 114. INI Hydraulic Basic Information, Manufacturing Base and Competitors
- Table 115. INI Hydraulic Major Business
- Table 116. INI Hydraulic Winches Product and Services
- Table 117. INI Hydraulic Winches Sales (K Units), Price (USD/Unit), Revenue (USD Million) and Gross Margin(2019-2023)
- Table 118. TMA Srl Basic Information, Manufacturing Base and Competitors
- Table 119. TMA Srl Major Business
- Table 120. TMA Srl Winches Product and Services
- Table 121. TMA Srl Winches Sales (K Units), Price (USD/Unit), Revenue (USD Million) and Gross Margin(2019-2023)
- Table 122. EMCE Basic Information, Manufacturing Base and Competitors
- Table 123. EMCE Major Business
- Table 124. EMCE Winches Product and Services
- Table 125. EMCE Winches Sales (K Units), Price (USD/Unit), Revenue (USD Million) and Gross Margin(2019-2023)
- Table 126. Wantong Basic Information, Manufacturing Base and Competitors
- Table 127. Wantong Major Business
- Table 128. Wantong Winches Product and Services
- Table 129. Wantong Winches Sales (K Units), Price (USD/Unit), Revenue (USD Million) and Gross Margin(2019-2023)
- Table 130. Bloom Manufacturing Basic Information, Manufacturing Base and Competitors
- Table 131. Bloom Manufacturing Major Business
- Table 132. Bloom Manufacturing Winches Product and Services
- Table 133. Bloom Manufacturing Winches Sales (K Units), Price (USD/Unit), Revenue (USD Million) and Gross Margin(2019-2023)
- Table 134. Xinhong Basic Information, Manufacturing Base and Competitors
- Table 135. Xinhong Major Business
- Table 136. Xinhong Winches Product and Services
- Table 137. Xinhong Winches Sales (K Units), Price (USD/Unit), Revenue (USD Million) and Gross Margin(2019-2023)
- Table 138. Key Raw Materials Lists
- Table 139. Raw Materials Key Suppliers Lists
- Table 140. Winches Downstream Customers
- Table 141. Table Traders or Distributors with Contact Information of Winches
- Table 142. Research Programs/Design for This Report
- Table 143. Key Data Information from Secondary Sources
- Table 144. Key Data Information from Primary Sources
List of Figures
- Figure 1. Winches Product Picture
- Figure 2. Global Winches Sales Value, 2019 VS 2023 VS 2030 (US$ Million)
- Figure 3. Global Winches Sales Value (2019-2030) & (US$ Million)
- Figure 4. Global Winches Sales Volume (2019-2030) & (K Units)
- Figure 5. Global Winches Sales Price (2019-2030) & (US$/Unit)
- Figure 6. Winches Market Trends
- Figure 7. Winches Market Drivers
- Figure 8. Winches Market Restraints
- Figure 9. Porter's Five Forces Analysis
- Figure 10. Winches Report Years Considered
- Figure 11. Global Winches Players Revenue Ranking (2023) & (US$ Million)
- Figure 12. The 3 Largest Manufacturers in the World: Market Share by Winches Revenue in 2023
- Figure 13. The 5 Largest Manufacturers in the World: Market Share by Winches Revenue in 2023
- Figure 14. Hydraulic Winches Picture
- Figure 15. Electric Winches Picture
- Figure 16. Marine Winches Picture
- Figure 17. North America Winches Sales Value (2019-2030) & (US$ Million)
- Figure 18. North America Winches Sales Value by Country (%), 2023 VS 2030
- Figure 19. Europe Winches Sales Value, (2019-2030) & (US$ Million)
- Figure 20. Europe Winches Sales Value by Country (%), 2023 VS 2030
- Figure 21. Asia Pacific Winches Sales Value, (2019-2030) & (US$ Million)
- Figure 22. Asia Pacific Winches Sales Value by Region (%), 2023 VS 2030
- Figure 23. South America Winches Sales Value, (2019-2030) & (US$ Million)
- Figure 24. South America Winches Sales Value by Country (%), 2023 VS 2030
- Figure 25. Middle East & Africa Winches Sales Value, (2019-2030) & (US$ Million)
- Figure 26. Middle East & Africa Winches Sales Value by Country (%), 2023 VS 2030
- Figure 27. United States Winches Sales Value, (2019-2030) & (US$ Million)
- Figure 28. Europe Winches Sales Value, (2019-2030) & (US$ Million)
- Figure 29. China Winches Sales Value, (2019-2030) & (US$ Million)
- Figure 30. Japan Winches Sales Value, (2019-2030) & (US$ Million)
- Figure 31. South Korea Winches Sales Value, (2019-2030) & (US$ Million)
- Figure 32. Southeast Asia Winches Sales Value, (2019-2030) & (US$ Million)
- Figure 33. India Winches Sales Value, (2019-2030) & (US$ Million)
- Figure 34. Winches Manufacturing Cost Structure
- Figure 35. Figure Marketing Channels of Winches by Method
- Figure 36. Bottom-up and Top-down Approaches for This Report
- Figure 37. Data Triangulation
- Figure 38. Key Executives Interviewed
The global market for Winches was estimated to be worth US$ 1128.99 million in 2023 and is forecast to a readjusted size of US$ 1443.96 million by 2030 with a CAGR of 3.60% during the forecast period 2024-2030.
North American market for Winches was valued at $ 322.21 million in 2023 and will reach $ 386.97 million by 2030, at a CAGR of 2.84% during the forecast period of 2024 through 2030.
Asia-Pacific market for Winches was valued at $ 361.87 million in 2023 and will reach $ 483.24 million by 2030, at a CAGR of 4.23% during the forecast period of 2024 through 2030.
Europe market for Winches was valued at $ 346.53 million in 2023 and will reach $ 432.89 million by 2030, at a CAGR of 3.23% during the forecast period of 2024 through 2030.
The global key companies of Winches include: TWG, Paccar Winch, Ingersoll Rand, WARN Industries, Huisman Group, Dinamic Oil, Ramsey Winch, Dana, and Rotzler Deutschland G mbH Co. KG, etc. In 2023, the global five largest players hold a share approximately 30.80% in terms of revenue.
This report aims to provide a comprehensive presentation of the global market for Winches, focusing on the total sales volume, sales revenue, price, key companies market share and ranking, together with an analysis of Winches by region & country, by Type, and by Application.
The Winches market size, estimations, and forecasts are provided in terms of sales volume (K Units) and sales revenue ($ millions), considering 2023 as the base year, with history and forecast data for the period from 2019 to 2030. With both quantitative and qualitative analysis, to help readers develop business/growth strategies, assess the market competitive situation, analyze their position in the current marketplace, and make informed business decisions regarding Winches.
Market Segmentation
By Company
- TWG
- Paccar Winch
- Ingersoll Rand
- WARN Industries
- Huisman Group
- Dinamic Oil
- Ramsey Winch
- Dana
- Rotzler Deutschland GmbH Co. KG
- Thern, Inc
- ZOLLERN
- PLANETA-Hebetechnik
- INI Hydraulic
- TMA Srl
- EMCE
- Wantong
- Bloom Manufacturing
- Xinhong
Segment by Type
- Hydraulic Winches
- Electric Winches
- Marine Winches
Segment by Application
- Infrastructure and Construction
- Oil and Gas
- Industry
- Marine
- Drilling
- Waste & Refuse Treatment
- Others
By Region
- North America
- United States
- Canada
- Mexico
- Asia-Pacific
- China
- Japan
- South Korea
- Southeast Asia
- India
- Rest of Asia-Pacific
- Europe
- Germany
- France
- U.K.
- Italy
- Benelux
- Rest of Europe
- South America
- Brazil
- Rest of South America
- Middle East & Africa
Chapter Outline
Chapter 1: Introduces the report scope of the report, global total market size (valve, volume and price). This chapter also provides the market dynamics, latest developments of the market, the driving factors and restrictive factors of the market, the challenges and risks faced by manufacturers in the industry, and the analysis of relevant policies in the industry.
Chapter 2: Detailed analysis of Winches manufacturers competitive landscape, price, sales and revenue market share, latest development plan, merger, and acquisition information, etc.
Chapter 3: Provides the analysis of various market segments by Type, covering the market size and development potential of each market segment, to help readers find the blue ocean market in different market segments.
Chapter 4: Provides the analysis of various market segments by Application, covering the market size and development potential of each market segment, to help readers find the blue ocean market in different downstream markets.
Chapter 5: Sales, revenue of Winches in regional level. It provides a quantitative analysis of the market size and development potential of each region and introduces the market development, future development prospects, market space, and market size of each country in the world.
Chapter 6: Sales, revenue of Winches in country level. It provides sigmate data by Type, and by Application for each country/region.
Chapter 7: Provides profiles of key players, introducing the basic situation of the main companies in the market in detail, including product sales, revenue, price, gross margin, product introduction, recent development, etc.
Chapter 8: Analysis of industrial chain, including the upstream and downstream of the industry.
Chapter 9: Conclusion.
Table of Contents
1 Market Overview
- 1.1 Winches Product Introduction
- 1.2 Global Winches Market Size Forecast
- 1.2.1 Global Winches Sales Value (2019-2030)
- 1.2.2 Global Winches Sales Volume (2019-2030)
- 1.2.3 Global Winches Sales Price (2019-2030)
- 1.3 Winches Market Trends & Drivers
- 1.3.1 Winches Trends Analysis
- 1.3.2 Winches Market Drivers
- 1.3.3 Winches Market Restraints
- 1.3.4 Porter's Five Forces Analysis
- 1.4 Assumptions and Limitations
- 1.5 Study Objectives
- 1.6 Years Considered
2 Competitive Analysis by Company
- 2.1 Global Winches Players Revenue Ranking (2023)
- 2.2 Global Winches Revenue by Company (2019-2023)
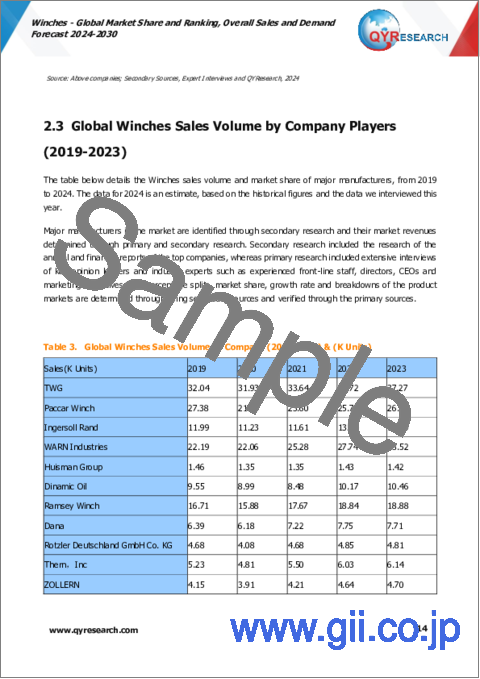
- 2.3 Global Winches Sales Volume by Company Players (2019-2023)
- 2.4 Global Winches Average Price by Company (2019-2023)
- 2.5 Key Manufacturers Winches Manufacturing Base and Headquarters
- 2.6 Key Manufacturers Winches Established Date
- 2.7 Winches Market Competitive Analysis
- 2.7.1 Winches Market Concentration Rate (2019-2023)
- 2.7.2 Global 3 and 5 Largest Manufacturers by Winches Revenue in 2023
- 2.7.3 Global Top Manufacturers by Company Type (Tier 1, Tier 2, and Tier 3) & (based on the Revenue in Winches as of 2023)
- 2.8 Mergers & Acquisitions, Expansion
3 Segmentation by Type
- 3.1 Introduction by Type
- 3.1.1 Hydraulic Winches
- 3.1.2 Electric Winches
- 3.1.3 Marine Winches
- 3.2 Global Winches Sales Value by Type
- 3.2.1 Global Winches Sales Value by Type (2019 VS 2023 VS 2030)
- 3.2.2 Global Winches Sales Value, by Type (2019-2030)
- 3.2.3 Global Winches Sales Value, by Type (%) (2019-2030)
- 3.3 Global Winches Sales Volume by Type
- 3.3.1 Global Winches Sales Volume by Type (2019 VS 2023 VS 2030)
- 3.3.2 Global Winches Sales Volume, by Type (2019-2030)
- 3.3.3 Global Winches Sales Volume, by Type (%) (2019-2030)
- 3.4 Global Winches Average Price by Type (2019-2030)
4 Segmentation by Application
- 4.1 Global Winches Sales Value by Application
- 4.1.1 Global Winches Sales Value by Application (2019 VS 2023 VS 2030)
- 4.1.2 Global Winches Sales Value, by Application (2019-2030)
- 4.1.3 Global Winches Sales Value, by Application (%) (2019-2030)
- 4.2 Global Winches Sales Volume by Application
- 4.2.1 Global Winches Sales Volume by Application (2019 VS 2023 VS 2030)
- 4.2.2 Global Winches Sales Volume, by Application (2019-2030)
- 4.2.3 Global Winches Sales Volume, by Application (%) (2019-2030)
- 4.3 Global Winches Average Price by Application (2019-2030)
5 Segmentation by Region
- 5.1 Global Winches Sales Value by Region
- 5.1.1 Global Winches Sales Value by Region: 2019 VS 2023 VS 2030
- 5.1.2 Global Winches Sales Value by Region (2019-2024)
- 5.1.3 Global Winches Sales Value by Region (2025-2030)
- 5.1.4 Global Winches Sales Value by Region (%), (2019-2030)
- 5.2 Global Winches Sales Volume by Region
- 5.2.1 Global Winches Sales Volume by Region: 2019 VS 2023 VS 2030
- 5.2.2 Global Winches Sales Volume by Region (2019-2024)
- 5.2.3 Global Winches Sales Volume by Region (2025-2030)
- 5.2.4 Global Winches Sales Volume by Region (%), (2019-2030)
- 5.3 Global Winches Average Price by Region (2019-2030)
- 5.4 North America
- 5.4.1 North America Winches Sales Value, 2019-2030
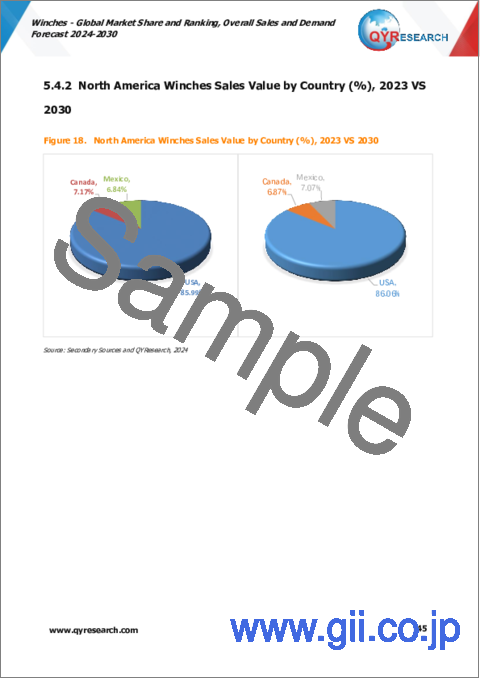
- 5.4.2 North America Winches Sales Value by Country (%), 2023 VS 2030
- 5.5 Europe
- 5.5.1 Europe Winches Sales Value, 2019-2030
- 5.5.2 Europe Winches Sales Value by Country (%), 2023 VS 2030
- 5.6 Asia Pacific
- 5.6.1 Asia Pacific Winches Sales Value, 2019-2030
- 5.6.2 Asia Pacific Winches Sales Value by Region (%), 2023 VS 2030
- 5.7 South America
- 5.7.1 South America Winches Sales Value, 2019-2030
- 5.7.2 South America Winches Sales Value by Country (%), 2023 VS 2030
- 5.8 Middle East & Africa
- 5.8.1 Middle East & Africa Winches Sales Value, 2019-2030
- 5.8.2 Middle East & Africa Winches Sales Value by Country (%), 2023 VS 2030
6 Segmentation by Key Countries/Regions
- 6.1 Key Countries/Regions Winches Sales Value Growth Trends, 2019 VS 2023 VS 2030
- 6.2 Key Countries/Regions Winches Sales Value
- 6.2.1 Key Countries/Regions Winches Sales Value, 2019-2030
- 6.2.2 Key Countries/Regions Winches Sales Volume, 2019-2030
- 6.3 United States
- 6.3.1 United States Winches Sales Value, 2019-2030
- 6.3.2 United States Winches Sales Value by Type (%), 2023 VS 2030
- 6.3.3 United States Winches Sales Value by Application, 2023 VS 2030
- 6.4 Europe
- 6.4.1 Europe Winches Sales Value, 2019-2030
- 6.4.2 Europe Winches Sales Value by Type (%), 2023 VS 2030
- 6.4.3 Europe Winches Sales Value by Application, 2023 VS 2030
- 6.5 China
- 6.5.1 China Winches Sales Value, 2019-2030
- 6.5.2 China Winches Sales Value by Type (%), 2023 VS 2030
- 6.5.3 China Winches Sales Value by Application, 2023 VS 2030
- 6.6 Japan
- 6.6.1 Japan Winches Sales Value, 2019-2030
- 6.6.2 Japan Winches Sales Value by Type (%), 2023 VS 2030
- 6.6.3 Japan Winches Sales Value by Application, 2023 VS 2030
- 6.7 South Korea
- 6.7.1 South Korea Winches Sales Value, 2019-2030
- 6.7.2 South Korea Winches Sales Value by Type (%), 2023 VS 2030
- 6.7.3 South Korea Winches Sales Value by Application, 2023 VS 2030
- 6.8 Southeast Asia
- 6.8.1 Southeast Asia Winches Sales Value, 2019-2030
- 6.8.2 Southeast Asia Winches Sales Value by Type (%), 2023 VS 2030
- 6.8.3 Southeast Asia Winches Sales Value by Application, 2023 VS 2030
- 6.9 India
- 6.9.1 India Winches Sales Value, 2019-2030
- 6.9.2 India Winches Sales Value by Type (%), 2023 VS 2030
- 6.9.3 India Winches Sales Value by Application, 2023 VS 2030
7 Company Profiles
- 7.1 TWG
- 7.1.1 TWG Details
- 7.1.2 TWG Major Business
- 7.1.3 TWG Winches Product and Services
- 7.1.4 TWG Winches Sales, Price, Revenue and Gross Margin (2019-2023)
- 7.2 Paccar Winch
- 7.2.1 Paccar Winch Details
- 7.2.2 Paccar Winch Major Business
- 7.2.3 Paccar Winch Winches Product and Services
- 7.2.4 Paccar Winch Winches Sales, Price, Revenue and Gross Margin (2019-2023)
- 7.3 Ingersoll Rand
- 7.3.1 Ingersoll Rand Details
- 7.3.2 Ingersoll Rand Major Business
- 7.3.3 Ingersoll Rand Winches Product and Services
- 7.3.4 Ingersoll Rand Winches Sales, Price, Revenue and Gross Margin (2019-2023)
- 7.4 WARN Industries
- 7.4.1 WARN Industries Details
- 7.4.2 WARN Industries Major Business
- 7.4.3 WARN Industries Winches Product and Services
- 7.4.4 WARN Industries Winches Sales, Price, Revenue and Gross Margin (2019-2023)
- 7.5 Huisman Group
- 7.5.1 Huisman Group Details
- 7.5.2 Huisman Group Major Business
- 7.5.3 Huisman Group Winches Product and Services
- 7.5.4 Huisman Group Winches Sales, Price, Revenue and Gross Margin (2019-2023)
- 7.6 Dinamic Oil
- 7.6.1 Dinamic Oil Details
- 7.6.2 Dinamic Oil Major Business
- 7.6.3 Dinamic Oil Winches Product and Services
- 7.6.4 Dinamic Oil Winches Sales, Price, Revenue and Gross Margin (2019-2023)
- 7.7 Ramsey Winch
- 7.7.1 Ramsey Winch Details
- 7.7.2 Ramsey Winch Major Business
- 7.7.3 Ramsey Winch Winches Product and Services
- 7.7.4 Ramsey Winch Winches Sales, Price, Revenue and Gross Margin (2019-2023)
- 7.8 Dana
- 7.8.1 Dana Details
- 7.8.2 Dana Major Business
- 7.8.3 Dana Winches Product and Services
- 7.8.4 Dana Winches Sales, Price, Revenue and Gross Margin (2019-2023)
- 7.9 Rotzler Deutschland GmbH Co. KG
- 7.9.1 Rotzler Deutschland GmbH Co. KG Details
- 7.9.2 Rotzler Deutschland GmbH Co. KG Major Business
- 7.9.3 Rotzler Deutschland GmbH Co. KG Winches Product and Services
- 7.9.4 Rotzler Deutschland GmbH Co. KG Winches Sales, Price, Revenue and Gross Margin (2019-2023)
- 7.10 Thern, Inc.
- 7.10.1 Thern, Inc. Details
- 7.10.2 Thern, Inc. Major Business
- 7.10.3 Thern, Inc. Winches Product and Services
- 7.10.4 Thern, Inc. Winches Sales, Price, Revenue and Gross Margin (2019-2023)
- 7.11 ZOLLERN
- 7.11.1 ZOLLERN Details
- 7.11.2 ZOLLERN Major Business
- 7.11.3 ZOLLERN Winches Product and Services
- 7.11.4 ZOLLERN Winches Sales, Price, Revenue and Gross Margin (2019-2023)
- 7.12 PLANETA-Hebetechnik
- 7.12.1 PLANETA-Hebetechnik Details
- 7.12.2 PLANETA-Hebetechnik Major Business
- 7.12.3 PLANETA-Hebetechnik Winches Product and Services
- 7.12.4 PLANETA-Hebetechnik Winches Sales, Price, Revenue and Gross Margin (2019-2023)
- 7.13 INI Hydraulic
- 7.13.1 INI Hydraulic Details
- 7.13.2 INI Hydraulic Major Business
- 7.13.3 INI Hydraulic Winches Product and Services
- 7.13.4 INI Hydraulic Winches Sales, Price, Revenue and Gross Margin (2019-2023)
- 7.14 TMA Srl
- 7.14.1 TMA Srl Details
- 7.14.2 TMA Srl Major Business
- 7.14.3 TMA Srl Winches Product and Services
- 7.14.4 TMA Srl Winches Sales, Price, Revenue and Gross Margin (2019-2023)
- 7.15 EMCE
- 7.15.1 EMCE Details
- 7.15.2 EMCE Major Business
- 7.15.3 EMCE Winches Product and Services
- 7.15.4 EMCE Winches Sales, Price, Revenue and Gross Margin (2019-2023)
- 7.16 Wantong
- 7.16.1 Wantong Details
- 7.16.2 Wantong Major Business
- 7.16.3 Wantong Winches Product and Services
- 7.16.4 Wantong Winches Sales, Price, Revenue and Gross Margin (2019-2023)
- 7.17 Bloom Manufacturing
- 7.17.1 Bloom Manufacturing Details
- 7.17.2 Bloom Manufacturing Major Business
- 7.17.3 Bloom Manufacturing Winches Product and Services
- 7.17.4 Bloom Manufacturing Winches Sales, Price, Revenue and Gross Margin (2019-2023)
- 7.18 Xinhong
- 7.18.1 Xinhong Details
- 7.18.2 Xinhong Major Business
- 7.18.3 Xinhong Winches Product and Services
- 7.18.4 Xinhong Winches Sales, Price, Revenue and Gross Margin (2019-2023)
8 Industry Chain Analysis
- 8.1 Winches Upstream Analysis
- 8.1.1 Key Raw Materials
- 8.1.2 Raw Materials Key Suppliers
- 8.1.3 Manufacturing Cost Structure
- 8.2 Downstream Analysis (Customers Analysis)
- 8.3 Sales Model and Sales Channels
- 8.3.1 Winches Sales Model
- 8.4 Market Positioning
- 8.4.1 Pricing Strategy
- 8.4.2 Brand Strategy
- 8.5 Traders or Distributors with Contact Information of Winches
9 Research Findings and Conclusion
10 Appendix
- 10.1 Research Methodology
- 10.1.1 Methodology/Research Approach
- 10.1.2 Data Source
- 10.2 Author Details
- 10.3 Disclaimer 137
