|
|
市場調査レポート
商品コード
1400623
バーチャルコミッショニングの世界市場(2023年) - カスタマイズ版Global Virtual Commissioning Market Research Report 2023 - Customized Version |
||||||
|
|
|||||||
カスタマイズ可能
適宜更新あり
|
|||||||


| バーチャルコミッショニングの世界市場(2023年) - カスタマイズ版 |
|
出版日: 2024年01月03日
発行: QYResearch
ページ情報: 英文 155 Pages
納期: 2~3営業日
|

- 全表示
- 概要
- 図表
- 目次
世界のバーチャルコミッショニングの市場規模は、2023年の7億2,815万米ドルから2029年までに16億9,870万米ドルに達し、予測期間にCAGRで15.16%の成長が見込まれています。
北米市場は、2023年の2億5,678万米ドルから2029年までに6億220万米ドルに達すると推定され、2024年~2029年の予測期間のCAGRは15.26%です。
中国市場は、2023年の2,520万米ドルから2029年までに8,746万米ドルに達すると推定され、予測期間のCAGRは23.05%です。
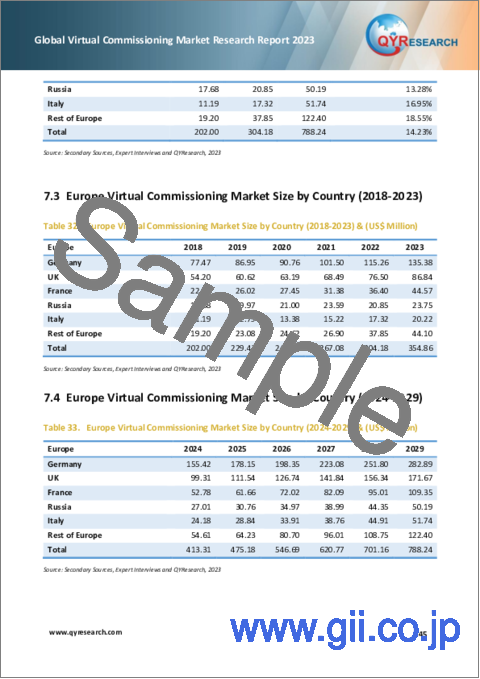
欧州市場は、2023年の3億5,486万米ドルから2029年までに7億8,824万米ドルに達すると推定され、予測期間のCAGRは14.23%です。
当レポートでは、世界のバーチャルコミッショニング市場について調査分析し、各地域の市場規模と予測、市場力学、競合情勢などを提供しています。
目次
第1章 レポートの概要
- 調査範囲
- 市場の分析:タイプ別
- 世界のバーチャルコミッショニングの市場規模、成長率:タイプ別(2018年・2022年・2029年)
- シミュレーション
- OTバーチャルコミッショニング
- ITバーチャルコミッショニング
- 市場:用途別
- 世界のバーチャルコミッショニング市場の成長:用途別(2018年・2022年・2029年)
- 航空宇宙・防衛
- 自動車・輸送
- 機械製造
- エネルギー・公共事業
- その他
- 前提条件と制限
- 調査目的
- 調査年
第2章 世界の成長動向
- 世界のバーチャルコミッショニング市場の見通し(2018年~2029年)
- 世界のバーチャルコミッショニングの成長動向:地域別
- 世界のバーチャルコミッショニングの市場規模:地域別(2018年・2022年・2029年)
- バーチャルコミッショニングの市場規模の実績:地域別(2018年~2023年)
- バーチャルコミッショニングの市場規模の予測:地域別(2024年~2029年)
- バーチャルコミッショニングの市場力学
- バーチャルコミッショニング産業の動向
- バーチャルコミッショニング市場の促進要因
- バーチャルコミッショニング市場の課題、抑制要因
第3章 競合情勢:主要企業別
- 世界の収益のバーチャルコミッショニング:企業別
- 世界のバーチャルコミッショニングの収益:企業別(2019年~2023年)
- 世界のバーチャルコミッショニングの収益の市場シェア:企業別(2019年~2023年)
- 世界のバーチャルコミッショニングの市場シェア:企業タイプ別(Tier 1・Tier 2・Tier 3)
- 世界の主要企業のバーチャルコミッショニングの収益ランキング
- 世界のバーチャルコミッショニングの市場集中度
- 世界のバーチャルコミッショニングの市場集中度(CR5、HHI)
- 世界のバーチャルコミッショニングの収益の上位3社、上位5社(2022年)
- 世界のバーチャルコミッショニングの主要企業の本社、サービス地域
- 世界のバーチャルコミッショニングの主要企業が提供する製品
- 世界のバーチャルコミッショニングの主要企業の設立日
- 合併と買収、拡張計画
第4章 バーチャルコミッショニングの内訳データ:タイプ別
- 世界のバーチャルコミッショニングの市場規模の実績:タイプ別(2018年~2023年)
- 世界のバーチャルコミッショニングの市場規模の予測:タイプ別(2024年~2029年)
第5章 バーチャルコミッショニングの内訳データ:用途別
- 世界のバーチャルコミッショニングの市場規模の実績:用途別(2018年~2023年)
- 世界のバーチャルコミッショニングの市場規模の予測:用途別(2024年~2029年)
第6章 北米
- 北米のバーチャルコミッショニングの市場規模(2018年~2029年)
- 北米のバーチャルコミッショニング市場の成長率:国別(2018年・2022年・2029年)
- 北米のバーチャルコミッショニングの市場規模:国別(2018年~2023年)
- 北米のバーチャルコミッショニングの市場規模:国別(2024年~2029年)
- 米国
- カナダ
第7章 欧州
- 欧州のバーチャルコミッショニングの市場規模(2018年~2029年)
- 欧州のバーチャルコミッショニングの市場規模:国別(2018年・2022年・2029年)
- 欧州のバーチャルコミッショニングの市場規模:国別(2018年~2023年)
- 欧州のバーチャルコミッショニングの市場規模:国別(2024年~2029年)
- ドイツ
- フランス
- 英国
- イタリア
- ロシア
第8章 アジア太平洋
- アジア太平洋のバーチャルコミッショニングの市場規模(2018年~2029年)
- アジア太平洋のバーチャルコミッショニングの市場規模:地域別(2018年・2022年・2029年)
- アジア太平洋のバーチャルコミッショニングの市場規模(2018年~2023年)
- アジア太平洋のバーチャルコミッショニングの市場規模(2024年~2029年)
- 中国
- 日本
- 韓国
- 東南アジア
- インド
- オーストラリア
第9章 ラテンアメリカ
- ラテンアメリカのバーチャルコミッショニングの市場規模(2018年~2029年)
- ラテンアメリカのバーチャルコミッショニングの市場規模:国別(2018年~2023年)
- ラテンアメリカのバーチャルコミッショニングの市場規模:国別(2024年~2029年)
- メキシコ
- ブラジル
第10章 中東・アフリカ
- 中東・アフリカのバーチャルコミッショニングの市場規模(2018年~2029年)
- 中東・アフリカのバーチャルコミッショニングの市場規模:国別(2018年~2023年)
- 中東・アフリカのバーチャルコミッショニングの市場規模:国別(2024年~2029年)
- トルコ
- サウジアラビア
- アラブ首長国連邦
第11章 主要企業のプロファイル
- Siemens
- Rockwell Automation
- Dassault Systemes
- ABB
- Visual Components (incl. Delfoi)
- Maplesoft
- CENIT
- MathWorks
- Beckhoff Automation
- ISG Industrielle Steuerungstechnik
- Robotmaster (Hypertherm)
- ArtiMinds
- OCTOPUZ
- Machineering GmbH
- Xcelgo
- RoboDK
- drag and bot (KEBA)
- FlexSim
- F.EE
- HEITEC
第12章 アナリストの視点/結論
第13章 付録
List of Tables
- Table 1. Global Virtual Commissioning Market Size Growth Rate by Type (US$ Million): 2018 VS 2022 VS 2029
- Table 2. Global Virtual Commissioning Market Size Growth by Application (US$ Million): 2018 VS 2022 VS 2029
- Table 3. Global Virtual Commissioning Market Size Growth Rate (CAGR) by Region (US$ Million): 2018 VS 2022 VS 2029
- Table 4. Global Virtual Commissioning Market Size by Region (2018-2023) & (US$ Million)
- Table 5. Global Virtual Commissioning Market Share by Region (2018-2023)
- Table 6. Global Virtual Commissioning Forecasted Market Size by Region (2024-2029) & (US$ Million)
- Table 7. Global Virtual Commissioning Market Share by Region (2024-2029)
- Table 8. Virtual Commissioning Market Trends
- Table 9. Virtual Commissioning Market Drivers
- Table 10. Virtual Commissioning Market Challenges and Restraints
- Table 11. Global Virtual Commissioning Revenue by Players (2019-2023) & (US$ Million)
- Table 12. Global Virtual Commissioning Market Share by Players (2019-2023)
- Table 13. Global Top Virtual Commissioning Players by Company Type (Tier 1, Tier 2, and Tier 3) & (based on the Revenue in Virtual Commissioning as of 2021)
- Table 14. Ranking of Global Top Virtual Commissioning Companies by Revenue (US$ Million) in 2022
- Table 15. Global 5 Largest Players Market Share by Virtual Commissioning Revenue (CR5 and HHI) & (2019-2023)
- Table 16. Global Key Players of Virtual Commissioning, Headquarters and Area Served
- Table 17. Global Key Players of Virtual Commissioning Product Type
- Table 18. Global Key Players of Virtual Commissioning Established Date
- Table 19. Mergers & Acquisitions, Expansion Plans
- Table 20. Global Virtual Commissioning Market Size by Type (2018-2023) & (US$ Million)
- Table 21. Global Virtual Commissioning Revenue Market Share by Type (2018-2023)
- Table 22. Global Virtual Commissioning Forecasted Market Size by Type (2024-2029) & (US$ Million)
- Table 23. Global Virtual Commissioning Revenue Market Share by Type (2024-2029)
- Table 24. Global Virtual Commissioning Market Size by Application (2018-2023) & (US$ Million)
- Table 25. Global Virtual Commissioning Revenue Market Share by Application (2018-2023)
- Table 26. Global Virtual Commissioning Forecasted Market Size by Application (2024-2029) & (US$ Million)
- Table 27. Global Virtual Commissioning Revenue Market Share by Application (2024-2029)
- Table 28. North America Virtual Commissioning Market Size Growth Rate by Country (US$ Million): 2018 VS 2022 VS 2029
- Table 29. North America Virtual Commissioning Market Size by Country (2018-2023) & (US$ Million)
- Table 30. North America Virtual Commissioning Market Size by Country (2024-2029) & (US$ Million)
- Table 31. Europe Virtual Commissioning Growth Rate (CAGR) by Country (US$ Million): 2018 VS 2022 VS 2029
- Table 32. Europe Virtual Commissioning Market Size by Country (2018-2023) & (US$ Million)
- Table 33. Europe Virtual Commissioning Market Size by Country (2024-2029) & (US$ Million)
- Table 34. Asia-Pacific Virtual Commissioning Growth Rate (CAGR) by Region (US$ Million): 2018 VS 2022 VS 2029
- Table 35. Asia-Pacific Virtual Commissioning Market Size by Region (2018-2023) & (US$ Million)
- Table 36. Asia-Pacific Virtual Commissioning Market Size by Region (2024-2029) & (US$ Million)
- Table 37. Latin America Virtual Commissioning Market Size by Country (2018-2023) & (US$ Million)
- Table 38. Latin America Virtual Commissioning Market Size by Country (2024-2029) & (US$ Million)
- Table 39. Middle East & Africa Virtual Commissioning Market Size by Country (2018-2023) & (US$ Million)
- Table 40. Middle East & Africa Virtual Commissioning Market Size by Country (2024-2029) & (US$ Million)
- Table 41. Siemens Company Details
- Table 42. Siemens Business Overview
- Table 43. Siemens Virtual Commissioning Product
- Table 44. Siemens Revenue in Virtual Commissioning Business (2019-2023) & (US$ Million)
- Table 45. Rockwell Automation Company Details
- Table 46. Rockwell Automation Business Overview
- Table 47. Rockwell Automation Virtual Commissioning Product
- Table 48. Rockwell Automation Revenue in Virtual Commissioning Business (2019-2023) & (US$ Million)
- Table 49. Dassault Systemes Company Details
- Table 50. Dassault Systemes Business Overview
- Table 51. Dassault Systemes Virtual Commissioning Product
- Table 52. Dassault Systemes Revenue in Virtual Commissioning Business (2019-2023) & (US$ Million)
- Table 53. ABB Company Details
- Table 54. ABB Business Overview
- Table 55. ABB Virtual Commissioning Product
- Table 56. ABB Revenue in Virtual Commissioning Business (2019-2023) & (US$ Million)
- Table 57. Visual Components (incl. Delfoi) Company Details
- Table 58. Visual Components (incl. Delfoi) Business Overview
- Table 59. Visual Components (incl. Delfoi) Virtual Commissioning Product
- Table 60. Visual Components (incl. Delfoi) Revenue in Virtual Commissioning Business (2019-2023) & (US$ Million)
- Table 61. Maplesoft Company Details
- Table 62. Maplesoft Business Overview
- Table 63. Maplesoft Virtual Commissioning Product
- Table 64. Maplesoft Revenue in Virtual Commissioning Business (2019-2023) & (US$ Million)
- Table 65. CENIT Company Details
- Table 66. CENIT Business Overview
- Table 67. CENIT Virtual Commissioning Product
- Table 68. CENIT Revenue in Virtual Commissioning Business (2019-2023) & (US$ Million)
- Table 69. MathWorks Company Details
- Table 70. MathWorks Business Overview
- Table 71. MathWorks Virtual Commissioning Product
- Table 72. MathWorks Revenue in Virtual Commissioning Business (2019-2023) & (US$ Million)
- Table 73. Beckhoff Automation Company Details
- Table 74. Beckhoff Automation Business Overview
- Table 75. Beckhoff Automation Virtual Commissioning Product
- Table 76. Beckhoff Automation Revenue in Virtual Commissioning Business (2019-2023) & (US$ Million)
- Table 77. ISG Industrielle Steuerungstechnik Company Details
- Table 78. ISG Industrielle Steuerungstechnik Business Overview
- Table 79. ISG Industrielle Steuerungstechnik Virtual Commissioning Product
- Table 80. ISG Industrielle Steuerungstechnik Revenue in Virtual Commissioning Business (2019-2023) & (US$ Million)
- Table 81. Robotmaster (Hypertherm) Company Details
- Table 82. Robotmaster (Hypertherm) Business Overview
- Table 83. Robotmaster (Hypertherm) Virtual Commissioning Product
- Table 84. Robotmaster (Hypertherm) Revenue in Virtual Commissioning Business (2019-2023) & (US$ Million)
- Table 85. ArtiMinds Company Details
- Table 86. ArtiMinds Business Overview
- Table 87. ArtiMinds Virtual Commissioning Product
- Table 88. ArtiMinds Revenue in Virtual Commissioning Business (2019-2023) & (US$ Million)
- Table 89. OCTOPUZ Company Details
- Table 90. OCTOPUZ Business Overview
- Table 91. OCTOPUZ Virtual Commissioning Product
- Table 92. OCTOPUZ Revenue in Virtual Commissioning Business (2019-2023) & (US$ Million)
- Table 93. Machineering GmbH Company Details
- Table 94. Machineering GmbH Business Overview
- Table 95. Machineering GmbH Virtual Commissioning Product
- Table 96. Machineering GmbH Revenue in Virtual Commissioning Business (2019-2023) & (US$ Million)
- Table 97. Xcelgo Company Details
- Table 98. Xcelgo Business Overview
- Table 99. Xcelgo Virtual Commissioning Product
- Table 100. Xcelgo Revenue in Virtual Commissioning Business (2019-2023) & (US$ Million)
- Table 101. RoboDK Company Details
- Table 102. RoboDK Business Overview
- Table 103. RoboDK Virtual Commissioning Product
- Table 104. RoboDK Revenue in Virtual Commissioning Business (2019-2023) & (US$ Million)
- Table 105. drag and bot (KEBA) Company Details
- Table 106. drag and bot (KEBA) Business Overview
- Table 107. drag and bot (KEBA) Virtual Commissioning Product
- Table 108. drag and bot (KEBA) Revenue in Virtual Commissioning Business (2019-2023) & (US$ Million)
- Table 109. FlexSim Company Details
- Table 110. FlexSim Business Overview
- Table 111. FlexSim Virtual Commissioning Product
- Table 112. FlexSim Revenue in Virtual Commissioning Business (2019-2023) & (US$ Million)
- Table 113. F.EE Company Details
- Table 114. F.EE Business Overview
- Table 115. F.EE Virtual Commissioning Product
- Table 116. F.EE Revenue in Virtual Commissioning Business (2019-2023) & (US$ Million)
- Table 117. HEITEC Company Details
- Table 118. HEITEC Business Overview
- Table 119. HEITEC Virtual Commissioning Product
- Table 120. HEITEC Revenue in Virtual Commissioning Business (2019-2023) & (US$ Million)
- Table 121. Research Programs/Design for This Report
- Table 122. Key Data Information from Secondary Sources
- Table 123. Key Data Information from Primary Sources
- Table 124. Authors List of This Report
- Table 125. QYR Business Unit and Senior & Team Lead Analysts
List of Figures
- Figure 1. Global Virtual Commissioning Market Size Comparison by Type (2023-2029) & (US$ Million)
- Figure 2. Global Virtual Commissioning Market Share by Type: 2022
- Figure 3. Simulation Features
- Figure 4. OT Virtual Commissioning Features
- Figure 5. IT Virtual Commissioning Features
- Figure 6. Global Virtual Commissioning Market Size by Application (2023-2029) & (US$ Million)
- Figure 7. Global Virtual Commissioning Market Share by Application: 2022
- Figure 8. Aerospace & Defense Case Studies
- Figure 9. Automotive & Transportation Case Studies
- Figure 10. Machine Manufacturing Case Studies
- Figure 11. Energy & Utilities Case Studies
- Figure 12. Healthcare Case Studies
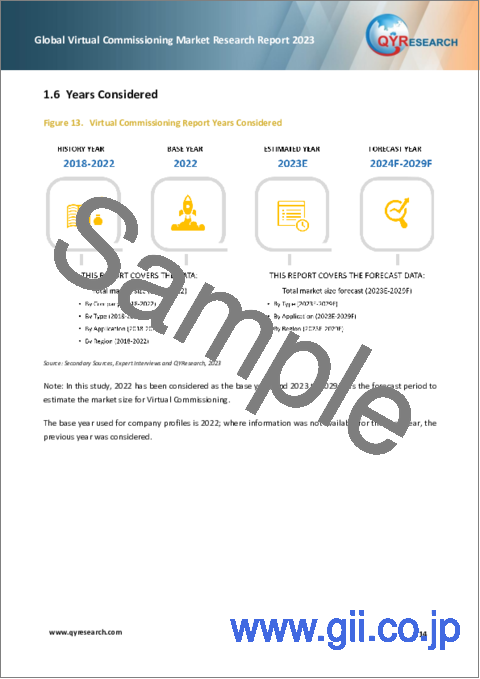
- Figure 13. Virtual Commissioning Report Years Considered
- Figure 14. Global Virtual Commissioning Market Size (US$ Million), Year-over-Year: 2018-2029
- Figure 15. Global Virtual Commissioning Market Size, (US$ Million), 2018 VS 2022 VS 2029
- Figure 16. Global Virtual Commissioning Market Share by Region: 2022 VS 2029
- Figure 17. Global Virtual Commissioning Market Share by Players in 2022
- Figure 18. The Top 3 Players Market Share by Virtual Commissioning Revenue in 2022
- Figure 19. The Top 5 Players Market Share by Virtual Commissioning Revenue in 2022
- Figure 20. North America Virtual Commissioning Market Size YoY Growth (2018-2029) & (US$ Million)
- Figure 21. North America Virtual Commissioning Market Share by Country (2018-2029)
- Figure 22. United States Virtual Commissioning Market Size YoY Growth (2018-2029) & (US$ Million)
- Figure 23. Canada Virtual Commissioning Market Size YoY Growth (2018-2029) & (US$ Million)
- Figure 24. Europe Virtual Commissioning Market Size YoY Growth (2018-2029) & (US$ Million)
- Figure 25. Europe Virtual Commissioning Market Share by Country (2018-2029)
- Figure 26. Germany Virtual Commissioning Market Size YoY Growth (2018-2029) & (US$ Million)
- Figure 27. France Virtual Commissioning Market Size YoY Growth (2018-2029) & (US$ Million)
- Figure 28. U.K. Virtual Commissioning Market Size YoY Growth (2018-2029) & (US$ Million)
- Figure 29. Italy Virtual Commissioning Market Size YoY Growth (2018-2029) & (US$ Million)
- Figure 30. Russia Virtual Commissioning Market Size YoY Growth (2018-2029) & (US$ Million)
- Figure 31. Asia-Pacific Virtual Commissioning Market Size YoY Growth (2018-2029) & (US$ Million)
- Figure 32. Asia-Pacific Virtual Commissioning Market Share by Region (2018-2029)
- Figure 33. China Virtual Commissioning Market Size YoY Growth (2018-2029) & (US$ Million)
- Figure 34. Japan Virtual Commissioning Market Size YoY Growth (2018-2029) & (US$ Million)
- Figure 35. South Korea Virtual Commissioning Market Size YoY Growth (2018-2029) & (US$ Million)
- Figure 36. Southeast Asia Virtual Commissioning Market Size YoY Growth (2018-2029) & (US$ Million)
- Figure 37. India Virtual Commissioning Market Size YoY Growth (2018-2029) & (US$ Million)
- Figure 38. Australia Virtual Commissioning Market Size YoY Growth (2018-2029) & (US$ Million)
- Figure 39. Latin America Virtual Commissioning Market Size YoY Growth (2018-2029) & (US$ Million)
- Figure 40. Latin America Virtual Commissioning Market Share by Country (2018-2029)
- Figure 41. Mexico Virtual Commissioning Market Size YoY Growth (2018-2029) & (US$ Million)
- Figure 42. Brazil Virtual Commissioning Market Size YoY Growth (2018-2029) & (US$ Million)
- Figure 43. Middle East & Africa Virtual Commissioning Market Size YoY Growth (2018-2029) & (US$ Million)
- Figure 44. Middle East & Africa Virtual Commissioning Market Share by Country (2018-2029)
- Figure 45. Turkey Virtual Commissioning Market Size YoY Growth (2018-2029) & (US$ Million)
- Figure 46. Saudi Arabia Virtual Commissioning Market Size YoY Growth (2018-2029) & (US$ Million)
- Figure 47. UAE Virtual Commissioning Market Size YoY Growth (2018-2029) & (US$ Million)
- Figure 48. Siemens Revenue Growth Rate in Virtual Commissioning Business (2019-2023)
- Figure 49. Rockwell Automation Revenue Growth Rate in Virtual Commissioning Business (2019-2023)
- Figure 50. Dassault Systemes Revenue Growth Rate in Virtual Commissioning Business (2019-2023)
- Figure 51. ABB Revenue Growth Rate in Virtual Commissioning Business (2019-2023)
- Figure 52. Visual Components (incl. Delfoi) Revenue Growth Rate in Virtual Commissioning Business (2019-2023)
- Figure 53. Maplesoft Revenue Growth Rate in Virtual Commissioning Business (2019-2023)
- Figure 54. CENIT Revenue Growth Rate in Virtual Commissioning Business (2019-2023)
- Figure 55. MathWorks Revenue Growth Rate in Virtual Commissioning Business (2019-2023)
- Figure 56. Beckhoff Automation Revenue Growth Rate in Virtual Commissioning Business (2019-2023)
- Figure 57. ISG Industrielle Steuerungstechnik Revenue Growth Rate in Virtual Commissioning Business (2019-2023)
- Figure 58. Robotmaster (Hypertherm) Revenue Growth Rate in Virtual Commissioning Business (2019-2023)
- Figure 59. ArtiMinds Revenue Growth Rate in Virtual Commissioning Business (2019-2023)
- Figure 60. OCTOPUZ Revenue Growth Rate in Virtual Commissioning Business (2019-2023)
- Figure 61. Machineering GmbH Revenue Growth Rate in Virtual Commissioning Business (2019-2023)
- Figure 62. Xcelgo Revenue Growth Rate in Virtual Commissioning Business (2019-2023)
- Figure 63. RoboDK Revenue Growth Rate in Virtual Commissioning Business (2019-2023)
- Figure 64. drag and bot (KEBA) Revenue Growth Rate in Virtual Commissioning Business (2019-2023)
- Figure 65. FlexSim Revenue Growth Rate in Virtual Commissioning Business (2019-2023)
- Figure 66. F.EE Revenue Growth Rate in Virtual Commissioning Business (2019-2023)
- Figure 67. HEITEC Revenue Growth Rate in Virtual Commissioning Business (2019-2023)
- Figure 68. Bottom-up and Top-down Approaches for This Report
- Figure 69. Data Triangulation
- Figure 70. Key Executives Interviewed
The global Virtual Commissioning market is projected to grow from US$ 728.15 million in 2023 to US$ 1,698.70 million by 2029, at a Compound Annual Growth Rate (CAGR) of 15.16% during the forecast period.
The North America market for Virtual Commissioning is estimated to increase from $ 256.78 million in 2023 to reach $ 602.2 million by 2029, at a CAGR of 15.26% during the forecast period of 2024 through 2029.
The China market for Virtual Commissioning is estimated to increase from $ 25.2 million in 2023 to reach $ 87.46 million by 2029, at a CAGR of 23.05% during the forecast period of 2024 through 2029.
The Europe market for Virtual Commissioning is estimated to increase from $ 354.86 million in 2023 to reach $ 788.24 million by 2029, at a CAGR of 14.23% during the forecast period of 2024 through 2029.
The global key companies of Virtual Commissioning include Siemens, Rockwell Automation, Dassault Systemes, ABB, Visual Components (incl. Delfoi), Maplesoft, CENIT, MathWorks, and Beckhoff Automation, etc. In 2022, the global top five players had a share approximately 67.97% in terms of revenue.
Report Scope
This report aims to provide a comprehensive presentation of the global market for Virtual Commissioning, with both quantitative and qualitative analysis, to help readers develop business/growth strategies, assess the market competitive situation, analyze their position in the current marketplace, and make informed business decisions regarding Virtual Commissioning.
The Virtual Commissioning market size, estimations, and forecasts are provided in terms of and revenue ($ millions), considering 2022 as the base year, with history and forecast data for the period from 2018 to 2029. This report segments the global Virtual Commissioning market comprehensively. Regional market sizes, concerning products by Type, By Application, and by players, are also provided.
For a more in-depth understanding of the market, the report provides profiles of the competitive landscape, key competitors, and their respective market ranks. The report also discusses technological trends and new product developments.
The report will help the Virtual Commissioning companies, new entrants, and industry chain related companies in this market with information on the revenues for the overall market and the sub-segments across the different segments, by company, by Type, By Application, and by regions.
By Company
- Siemens
- Rockwell Automation
- Dassault Systemes
- ABB
- Visual Components (incl. Delfoi)
- Maplesoft
- CENIT
- MathWorks
- Beckhoff Automation
- ISG Industrielle Steuerungstechnik
- Robotmaster (Hypertherm)
- ArtiMinds
- OCTOPUZ
- machineering GmbH Co. KG
- Xcelgo
- RoboDK
- drag and bot (KEBA)
- FlexSim
- F.EE
- HEITEC
Segment By Type
- Simulation
- OT Virtual Commissioning
- IT Virtual Commissioning
Segment By Application
- Aerospace & Defense
- Automotive & Transportation
- Machine Manufacturing
- Energy & Utilities
- Others
By Region
- North America
- United States
- Canada
- Asia-Pacific
- China
- Japan
- South Korea
- Southeast Asia
- India
- Australia
- Rest of Asia
- Europe
- Germany
- France
- U.K.
- Italy
- Russia
- Rest of Europe
- Latin America
- Mexico
- Brazil
- Rest of Latin America
- Middle East & Africa
- Turkey
- Saudi Arabia
- UAE
- Rest of MEA
Core Chapters
Chapter 1: Introduces the report scope of the report, executive summary of different market segments (by Type, By Application, etc), including the market size of each market segment, future development potential, and so on. It offers a high-level view of the current state of the market and its likely evolution in the short to mid-term, and long term.
Chapter 2: Introduces executive summary of global market size, regional market size, this section also introduces the market dynamics, latest developments of the market, the driving factors and restrictive factors of the market, the challenges and risks faced by companies in the industry, and the analysis of relevant policies in the industry.
Chapter 3: Detailed analysis of Virtual Commissioning companies' competitive landscape, revenue market share, latest development plan, merger, and acquisition information, etc.
Chapter 4: Provides the analysis of various market segments by Type, covering the market size and development potential of each market segment, to help readers find the blue ocean market in different market segments.
Chapter 5: Provides the analysis of various market segments By Application, covering the market size and development potential of each market segment, to help readers find the blue ocean market in different downstream markets.
Chapter 6, 7, 8, 9, 10: North America, Europe, Asia Pacific, Latin America, Middle East and Africa segment by country. It provides a quantitative analysis of the market size and development potential of each region and its main countries and introduces the market development, future development prospects, market space, and capacity of each country in the world.
Chapter 11: Provides profiles of key players, introducing the basic situation of the main companies in the market in detail, including product sales, revenue, price, gross margin, product introduction, recent development, etc.
Chapter 12: The main points and conclusions of the report.
Table of Contents
1 Report Overview
- 1.1 Study Scope
- 1.2 Market Analysis by Type
- 1.2.1 Global Virtual Commissioning Market Size Growth Rate by Type: 2018 VS 2022 VS 2029
- 1.2.2 Simulation
- 1.2.3 OT Virtual Commissioning
- 1.2.4 IT Virtual Commissioning
- 1.3 Market by Application
- 1.3.1 Global Virtual Commissioning Market Growth by Application: 2018 VS 2022 VS 2029
- 1.3.2 Aerospace & Defense
- 1.3.3 Automotive & Transportation
- 1.3.4 Machine Manufacturing
- 1.3.5 Energy & Utilities
- 1.3.6 Others
- 1.4 Assumptions and Limitations
- 1.5 Study Objectives
- 1.6 Years Considered
2 Global Growth Trends
- 2.1 Global Virtual Commissioning Market Perspective (2018-2029)
- 2.2 Global Virtual Commissioning Growth Trends by Region
- 2.2.1 Global Virtual Commissioning Market Size by Region: 2018 VS 2022 VS 2029
- 2.2.2 Virtual Commissioning Historic Market Size by Region (2018-2023)
- 2.2.3 Virtual Commissioning Forecasted Market Size by Region (2024-2029)
- 2.3 Virtual Commissioning Market Dynamics
- 2.3.1 Virtual Commissioning Industry Trends
- 2.3.2 Virtual Commissioning Market Drivers
- 2.3.3 Virtual Commissioning Market Challenges and Restraints
3 Competition Landscape by Key Players
- 3.1 Global Revenue Virtual Commissioning by Players
- 3.1.1 Global Virtual Commissioning Revenue by Players (2019-2023)
- 3.1.2 Global Virtual Commissioning Revenue Market Share by Players (2019-2023)
- 3.2 Global Virtual Commissioning Market Share by Company Type (Tier 1, Tier 2, and Tier 3)
- 3.3 Global Key Players Ranking by Virtual Commissioning Revenue
- 3.4 Global Virtual Commissioning Market Concentration Ratio
- 3.4.1 Global Virtual Commissioning Market Concentration Ratio (CR5 and HHI)
- 3.4.2 Global Top 3 and Top 5 Companies by Virtual Commissioning Revenue in 2022
- 3.5 Global Key Players of Virtual Commissioning Head office and Area Served
- 3.6 Global Key Players of Virtual Commissioning Product Offered
- 3.7 Global Key Players of Virtual Commissioning Established Date
- 3.8 Mergers & Acquisitions, Expansion Plans
4 Virtual Commissioning Breakdown Data by Type
- 4.1 Global Virtual Commissioning Historic Market Size by Type (2018-2023)
- 4.2 Global Virtual Commissioning Forecasted Market Size by Type (2024-2029)
5 Virtual Commissioning Breakdown Data by Application
- 5.1 Global Virtual Commissioning Historic Market Size by Application (2018-2023)
- 5.2 Global Virtual Commissioning Forecasted Market Size by Application (2024-2029)
6 North America
- 6.1 North America Virtual Commissioning Market Size (2018-2029)
- 6.2 North America Virtual Commissioning Market Growth Rate by Country: 2018 VS 2022 VS 2029
- 6.3 North America Virtual Commissioning Market Size by Country (2018-2023)
- 6.4 North America Virtual Commissioning Market Size by Country (2024-2029)
- 6.5 United States
- 6.6 Canada
7 Europe
- 7.1 Europe Virtual Commissioning Market Size (2018-2029)
- 7.2 Europe Virtual Commissioning Market Size by Country: 2018 VS 2022 VS 2029
- 7.3 Europe Virtual Commissioning Market Size by Country (2018-2023)
- 7.4 Europe Virtual Commissioning Market Size by Country (2024-2029)
- 7.5 Germany
- 7.6 France
- 7.7 U.K.
- 7.8 Italy
- 7.9 Russia
8 Asia-Pacific
- 8.1 Asia-Pacific Virtual Commissioning Market Size (2018-2029)
- 8.2 Asia-Pacific Virtual Commissioning Market Size by Region: 2018 VS 2022 VS 2029
- 8.3 Asia-Pacific Virtual Commissioning Market Size by Region (2018-2023)
- 8.4 Asia-Pacific Virtual Commissioning Market Size by Region (2024-2029)
- 8.5 China
- 8.6 Japan
- 8.7 South Korea
- 8.8 Southeast Asia
- 8.9 India
- 8.10 Australia
9 Latin America
- 9.1 Latin America Virtual Commissioning Market Size (2018-2029)
- 9.2 Latin America Virtual Commissioning Market Size by Country (2018-2023)
- 9.3 Latin America Virtual Commissioning Market Size by Country (2024-2029)
- 9.4 Mexico
- 9.5 Brazil
10 Middle East & Africa
- 10.1 Middle East & Africa Virtual Commissioning Market Size (2018-2029)
- 10.2 Middle East & Africa Virtual Commissioning Market Size by Country (2018-2023)
- 10.3 Middle East & Africa Virtual Commissioning Market Size by Country (2024-2029)
- 10.4 Turkey
- 10.5 Saudi Arabia
- 10.6 UAE
11 Key Players Profiles
- 11.1 Siemens
- 11.1.1 Siemens Company Details
- 11.1.2 Siemens Business Overview
- 11.1.3 Siemens Virtual Commissioning Introduction
- 11.1.4 Siemens Revenue in Virtual Commissioning Business (2019-2023)
- 11.2 Rockwell Automation
- 11.2.1 Rockwell Automation Company Details
- 11.2.2 Rockwell Automation Business Overview
- 11.2.3 Rockwell Automation Virtual Commissioning Introduction
- 11.2.4 Rockwell Automation Revenue in Virtual Commissioning Business (2019-2023)
- 11.3 Dassault Systemes
- 11.3.1 Dassault Systemes Company Details
- 11.3.2 Dassault Systemes Business Overview
- 11.3.3 Dassault Systemes Virtual Commissioning Introduction
- 11.3.4 Dassault Systemes Revenue in Virtual Commissioning Business (2019-2023)
- 11.4 ABB
- 11.4.1 ABB Company Details
- 11.4.2 ABB Business Overview
- 11.4.3 ABB Virtual Commissioning Introduction
- 11.4.4 ABB Revenue in Virtual Commissioning Business (2019-2023)
- 11.5 Visual Components (incl. Delfoi)
- 11.5.1 Visual Components (incl. Delfoi) Company Details
- 11.5.2 Visual Components (incl. Delfoi) Business Overview
- 11.5.3 Visual Components (incl. Delfoi) Virtual Commissioning Introduction
- 11.5.4 Visual Components (incl. Delfoi) Revenue in Virtual Commissioning Business (2019-2023)
- 11.6 Maplesoft
- 11.6.1 Maplesoft Company Details
- 11.6.2 Maplesoft Business Overview
- 11.6.3 Maplesoft Virtual Commissioning Introduction
- 11.6.4 Maplesoft Revenue in Virtual Commissioning Business (2019-2023)
- 11.7 CENIT
- 11.7.1 CENIT Company Details
- 11.7.2 CENIT Business Overview
- 11.7.3 CENIT Virtual Commissioning Introduction
- 11.7.4 CENIT Revenue in Virtual Commissioning Business (2019-2023)
- 11.8 MathWorks
- 11.8.1 MathWorks Company Details
- 11.8.2 MathWorks Business Overview
- 11.8.3 MathWorks Virtual Commissioning Introduction
- 11.8.4 MathWorks Revenue in Virtual Commissioning Business (2019-2023)
- 11.9 Beckhoff Automation
- 11.9.1 Beckhoff Automation Company Details
- 11.9.2 Beckhoff Automation Business Overview
- 11.9.3 Beckhoff Automation Virtual Commissioning Introduction
- 11.9.4 Beckhoff Automation Revenue in Virtual Commissioning Business (2019-2023)
- 11.10 ISG Industrielle Steuerungstechnik
- 11.10.1 ISG Industrielle Steuerungstechnik Company Details
- 11.10.2 ISG Industrielle Steuerungstechnik Business Overview
- 11.10.3 ISG Industrielle Steuerungstechnik Virtual Commissioning Introduction
- 11.10.4 ISG Industrielle Steuerungstechnik Revenue in Virtual Commissioning Business (2019-2023)
- 11.11 Robotmaster (Hypertherm)
- 11.11.1 Robotmaster (Hypertherm) Company Details
- 11.11.2 Robotmaster (Hypertherm) Business Overview
- 11.11.3 Robotmaster (Hypertherm) Virtual Commissioning Introduction
- 11.11.4 Robotmaster (Hypertherm) Revenue in Virtual Commissioning Business (2019-2023)
- 11.12 ArtiMinds
- 11.12.1 ArtiMinds Company Details
- 11.12.2 ArtiMinds Business Overview
- 11.12.3 ArtiMinds Virtual Commissioning Introduction
- 11.12.4 ArtiMinds Revenue in Virtual Commissioning Business (2019-2023)
- 11.13 OCTOPUZ
- 11.13.1 OCTOPUZ Company Details
- 11.13.2 OCTOPUZ Business Overview
- 11.13.3 OCTOPUZ Virtual Commissioning Introduction
- 11.13.4 OCTOPUZ Revenue in Virtual Commissioning Business (2019-2023)
- 11.14 Machineering GmbH
- 11.14.1 Machineering GmbH Company Details
- 11.14.2 Machineering GmbH Business Overview
- 11.14.3 Machineering GmbH Virtual Commissioning Introduction
- 11.14.4 Machineering GmbH Revenue in Virtual Commissioning Business (2019-2023)
- 11.15 Xcelgo
- 11.15.1 Xcelgo Company Details
- 11.15.2 Xcelgo Business Overview
- 11.15.3 Xcelgo Virtual Commissioning Introduction
- 11.15.4 Xcelgo Revenue in Virtual Commissioning Business (2019-2023)
- 11.16 RoboDK
- 11.16.1 RoboDK Company Details
- 11.16.2 RoboDK Business Overview
- 11.16.3 RoboDK Virtual Commissioning Introduction
- 11.16.4 RoboDK Revenue in Virtual Commissioning Business (2019-2023)
- 11.17 drag and bot (KEBA)
- 11.17.1 drag and bot (KEBA) Company Details
- 11.17.2 drag and bot (KEBA) Business Overview
- 11.17.3 drag and bot (KEBA) Virtual Commissioning Introduction
- 11.17.4 drag and bot (KEBA) Revenue in Virtual Commissioning Business (2019-2023)
- 11.18 FlexSim
- 11.18.1 FlexSim Company Details
- 11.18.2 FlexSim Business Overview
- 11.18.3 FlexSim Virtual Commissioning Introduction
- 11.18.4 FlexSim Revenue in Virtual Commissioning Business (2019-2023)
- 11.19 F.EE
- 11.19.1 F.EE Company Details
- 11.19.2 F.EE Business Overview
- 11.19.3 F.EE Virtual Commissioning Introduction
- 11.19.4 F.EE Revenue in Virtual Commissioning Business (2019-2023)
- 11.20 HEITEC
- 11.20.1 HEITEC Company Details
- 11.20.2 HEITEC Business Overview
- 11.20.3 HEITEC Virtual Commissioning Introduction
- 11.20.4 HEITEC Revenue in Virtual Commissioning Business (2019-2023)
12 Analyst's Viewpoints/Conclusions
13 Appendix
- 13.1 Research Methodology
- 13.1.1 Methodology/Research Approach
- 13.1.2 Data Source
- 13.2 Author Details
- 13.3 Disclaimer 136
