|
|
市場調査レポート
商品コード
1394263
ベクターデータベースソリューションの世界市場:~2029年Global Vector Database Solution Market Insights, Forecast to 2029 |
||||||
|
|
|||||||
カスタマイズ可能
適宜更新あり
|
|||||||

| ベクターデータベースソリューションの世界市場:~2029年 |
|
出版日: 2023年12月11日
発行: QYResearch
ページ情報: 英文 119 Pages
納期: 2~3営業日
|

全表示
- 概要
- 図表
- 目次
世界のベクターデータベースソリューションの市場規模は、2023年の32億1,825万米ドルから、予測期間中は22.59%のCAGRで推移し、2029年には109億2,193万米ドルの規模に成長すると予測されています。
地域別で見ると、米国・カナダ市場は2023年の11億8,206万米ドルから、22.12%のCAGRで推移し、2029年には39億1,988万米ドルに達すると予測されています。中国市場は、2023年の2億6,003万米ドルから、24.15%のCAGRで推移し、2029年には9億5,239万米ドルに達すると予測されています。欧州市場は、2023年の8億488万米ドルから、21.98%のCAGRで推移し、2029年には26億5,075万米ドルに達すると予測されています。
当レポートでは、世界のベクターデータベースソリューションの市場を調査し、市場の定義と概要、市場成長への各種影響因子の分析、市場規模の推移・予測、タイプ・用途別の内訳、地域・主要国別の詳細分析、競合環境、主要企業のプロファイルなどをまとめています。
目次
第1章 レポートの概要
- 調査範囲
- タイプ別市場分析
- 成長率:2018 vs 2022 vs 2029
- クラウドベース
- オンプレミス
- 用途別の市場
- 市場シェア:2018 vs 2022 vs 2029
- 個人
- 企業
- 前提・制限
- 調査目的
- 調査年数
第2章 世界の成長動向
- 世界市場の展望
- 成長動向:地域別
- 市場規模:2018 vs 2022 vs 2029
- 市場規模の推移
- 市場規模の予測
- 市場力学
- 産業動向
- 市場促進要因
- 市場の課題
- 市場抑制要因
第3章 競合情勢:主要企業別
- 収益・収益シェア:企業別
- 市場シェア:企業タイプ別
- 世界の主要企業:収益ランキング
- 市場集中率
- 世界の主要企業:本社・サービス提供エリア
- 世界の主要企業:製品・用途
- 世界の主要企業:参入日
- 財務情報
第4章 ベクターデータベースソリューションの内訳データ:タイプ別
- 市場規模の推移・予測
第5章 ベクターデータベースソリューションの内訳データ:用途別
- 市場規模の推移・予測
第6章 北米
第7章 欧州
第8章 中国
第9章 アジア (中国を除く)
第10章 中東・アフリカ・ラテンアメリカ
第11章 主要企業のプロファイル
- Zilliz
- Faiss
- Redis
- Tinybird
- Vespa
- Vald
- Pinecone
- Weaviate
第12章 アナリストによる見解・総論
第13章 付録
List of Tables
- Table 1. Global Vector Database Solution Market Size Growth Rate by Type (US$ Million): 2018 VS 2022 VS 2029
- Table 2. Key Players of Cloud Based
- Table 3. Key Players of On-Premises
- Table 4. Global Vector Database Solution Market Size Growth by Application (US$ Million): 2018 VS 2022 VS 2029
- Table 5. Global Vector Database Solution Market Size Growth Rate (CAGR) by Region (US$ Million): 2018 VS 2022 VS 2029
- Table 6. Global Vector Database Solution Market Size by Region (2018-2023) & (US$ Million)
- Table 7. Global Vector Database Solution Market Share by Region (2018-2023)
- Table 8. Global Vector Database Solution Forecasted Market Size by Region (2024-2029) & (US$ Million)
- Table 9. Global Vector Database Solution Market Share by Region (2024-2029)
- Table 10. Vector Database Solution Market Trends
- Table 11. Vector Database Solution Market Drivers
- Table 12. Vector Database Solution Market Challenges
- Table 13. Vector Database Solution Market Restraints
- Table 14. Global Vector Database Solution Revenue by Players (2018-2023) & (US$ Million)
- Table 15. Global Vector Database Solution Market Share by Players (2018-2023)
- Table 16. Global Top Vector Database Solution Players by Company Type (Tier 1, Tier 2, and Tier 3) & (based on the Revenue in Vector Database Solution as of 2022)
- Table 17. Global Vector Database Solution Industry Ranking 2021 VS 2022
- Table 18. Global 5 Largest Players Market Share by Vector Database Solution Revenue (CR3 and HHI) & (2018-2023)
- Table 19. Global Key Players of Vector Database Solution, Headquarters and Area Served
- Table 20. Global Key Players of Vector Database Solution, Product and Application
- Table 21. Global Key Players of Vector Database Solution, Date of Enter into This Industry
- Table 22. Financing Information
- Table 23. Global Vector Database Solution Market Size by Type (2018-2023) & (US$ Million)
- Table 24. Global Vector Database Solution Revenue Market Share by Type (2018-2023)
- Table 25. Global Vector Database Solution Forecasted Market Size by Type (2024-2029) & (US$ Million)
- Table 26. Global Vector Database Solution Revenue Market Share by Type (2024-2029)
- Table 27. Global Vector Database Solution Market Size by Application (2018-2023) & (US$ Million)
- Table 28. Global Vector Database Solution Revenue Market Share by Application (2018-2023)
- Table 29. Global Vector Database Solution Forecasted Market Size by Application (2024-2029) & (US$ Million)
- Table 30. Global Vector Database Solution Revenue Market Share by Application (2024-2029)
- Table 31. North America Vector Database Solution Market Size by Type (2018-2023) & (US$ Million)
- Table 32. North America Vector Database Solution Market Size by Type (2024-2029) & (US$ Million)
- Table 33. North America Vector Database Solution Market Size by Application (2018-2023) & (US$ Million)
- Table 34. North America Vector Database Solution Market Size by Application (2024-2029) & (US$ Million)
- Table 35. North America Vector Database Solution Growth Rate (CAGR) by Country (US$ Million): 2018 VS 2022 VS 2029
- Table 36. North America Vector Database Solution Market Size by Country (2018-2023) & (US$ Million)
- Table 37. North America Vector Database Solution Market Size by Country (2024-2029) & (US$ Million)
- Table 38. Europe Vector Database Solution Market Size by Type (2018-2023) & (US$ Million)
- Table 39. Europe Vector Database Solution Market Size by Type (2024-2029) & (US$ Million)
- Table 40. Europe Vector Database Solution Market Size by Application (2018-2023) & (US$ Million)
- Table 41. Europe Vector Database Solution Market Size by Application (2024-2029) & (US$ Million)
- Table 42. Europe Vector Database Solution Growth Rate (CAGR) by Country (US$ Million): 2018 VS 2022 VS 2029
- Table 43. Europe Vector Database Solution Market Size by Country (2018-2023) & (US$ Million)
- Table 44. Europe Vector Database Solution Market Size by Country (2024-2029) & (US$ Million)
- Table 45. China Vector Database Solution Market Size by Type (2018-2023) & (US$ Million)
- Table 46. China Vector Database Solution Market Size by Type (2024-2029) & (US$ Million)
- Table 47. China Vector Database Solution Market Size by Application (2018-2023) & (US$ Million)
- Table 48. China Vector Database Solution Market Size by Application (2024-2029) & (US$ Million)
- Table 49. Asia Vector Database Solution Market Size by Type (2018-2023) & (US$ Million)
- Table 50. Asia Vector Database Solution Market Size by Type (2024-2029) & (US$ Million)
- Table 51. Asia Vector Database Solution Market Size by Application (2018-2023) & (US$ Million)
- Table 52. Asia Vector Database Solution Market Size by Application (2024-2029) & (US$ Million)
- Table 53. Asia Vector Database Solution Growth Rate (CAGR) by Region (US$ Million): 2018 VS 2022 VS 2029
- Table 54. Asia Vector Database Solution Market Size by Region (2018-2023) & (US$ Million)
- Table 55. Asia Vector Database Solution Market Size by Region (2024-2029) & (US$ Million)
- Table 56. Middle East, Africa, and Latin America Vector Database Solution Market Size by Type (2018-2023) & (US$ Million)
- Table 57. Middle East, Africa, and Latin America Vector Database Solution Market Size by Type (2024-2029) & (US$ Million)
- Table 58. Middle East, Africa, and Latin America Vector Database Solution Market Size by Application (2018-2023) & (US$ Million)
- Table 59. Middle East, Africa, and Latin America Vector Database Solution Market Size by Application (2024-2029) & (US$ Million)
- Table 60. Middle East, Africa, and Latin America Vector Database Solution Growth Rate (CAGR) by Country (US$ Million): 2018 VS 2022 VS 2029
- Table 61. Middle East, Africa, and Latin America Vector Database Solution Market Size by Country (2018-2023) & (US$ Million)
- Table 62. Middle East, Africa, and Latin America Vector Database Solution Market Size by Country (2024-2029) & (US$ Million)
- Table 63. Zilliz Company Details
- Table 64. Zilliz Business Overview
- Table 65. Zilliz Vector Database Solution Product
- Table 66. Zilliz Revenue in Vector Database Solution Business (2018-2023) & (US$ Million)
- Table 67. Zilliz Recent Development
- Table 68. Faiss Company Details
- Table 69. Faiss Business Overview
- Table 70. Faiss Vector Database Solution Product
- Table 71. Faiss Revenue in Vector Database Solution Business (2018-2023) & (US$ Million)
- Table 72. Redis Company Details
- Table 73. Redis Business Overview
- Table 74. Redis Vector Database Solution Product
- Table 75. Redis Revenue in Vector Database Solution Business (2018-2023) & (US$ Million)
- Table 76. Tinybird Company Details
- Table 77. Tinybird Business Overview
- Table 78. Tinybird Vector Database Solution Product
- Table 79. Tinybird Revenue in Vector Database Solution Business (2018-2023) & (US$ Million)
- Table 80. Tinybird Recent Development
- Table 81. Vespa Company Details
- Table 82. Vespa Business Overview
- Table 83. Vespa Vector Database Solution Product
- Table 84. Vespa Revenue in Vector Database Solution Business (2018-2023) & (US$ Million)
- Table 85. Vespa Recent Development
- Table 86. Vald Company Details
- Table 87. Vald Business Overview
- Table 88. Vald Vector Database Solution Product
- Table 89. Vald Revenue in Vector Database Solution Business (2018-2023) & (US$ Million)
- Table 90. Vald Company Details
- Table 91. Pinecone Business Overview
- Table 92. Pinecone Vector Database Solution Product
- Table 93. Pinecone Revenue in Vector Database Solution Business (2018-2023) & (US$ Million)
- Table 94. Vald Company Details
- Table 95. Weaviate Business Overview
- Table 96. Weaviate Vector Database Solution Product
- Table 97. Weaviate Revenue in Vector Database Solution Business (2018-2023) & (US$ Million)
- Table 98. Weaviate Recent Development
- Table 99. Research Programs/Design for This Report
- Table 100. Key Data Information from Secondary Sources
- Table 101. Key Data Information from Primary Sources
- Table 102. QYR Business Unit and Senior & Team Lead Analysts
List of Figures
- Figure 1. Global Vector Database Solution Market Size by Type, 2018-2029 (US$ Million)
- Figure 2. Global Vector Database Solution Market Share by Type: 2022 VS 2029
- Figure 3. Cloud Based Features
- Figure 4. On-Premises Features
- Figure 5. Global Vector Database Solution Market Size by Application, 2018-2029 (US$ Million)
- Figure 6. Global Vector Database Solution Market Share by Application: 2022 VS 2029
- Figure 7. Personal Case Studies
- Figure 8. Enterprise Case Studies
- Figure 9. Vector Database Solution Report Years Considered
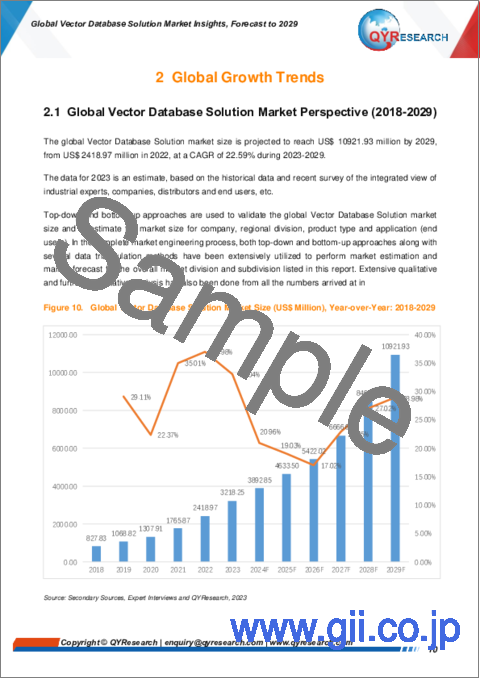
- Figure 10. Global Vector Database Solution Market Size (US$ Million), Year-over-Year: 2018-2029
- Figure 11. Global Vector Database Solution Market Size, (US$ Million), 2018 VS 2022 VS 2029
- Figure 12. Global Vector Database Solution Market Share by Region: 2022 VS 2029
- Figure 13. Global Vector Database Solution Market Share by Players in 2022
- Figure 14. Global Top Vector Database Solution Players by Company Type (Tier 1, Tier 2, and Tier 3) & (based on the Revenue in Vector Database Solution as of 2022)
- Figure 15. The Top 3 Players Market Share by Vector Database Solution Revenue in 2022
- Figure 16. North America Vector Database Solution Market Size YoY Growth (2018-2029) & (US$ Million)
- Figure 17. North America Vector Database Solution Market Share by Type (2018-2029)
- Figure 18. North America Vector Database Solution Market Share by Application (2018-2029)
- Figure 19. North America Vector Database Solution Market Share by Country (2018-2029)
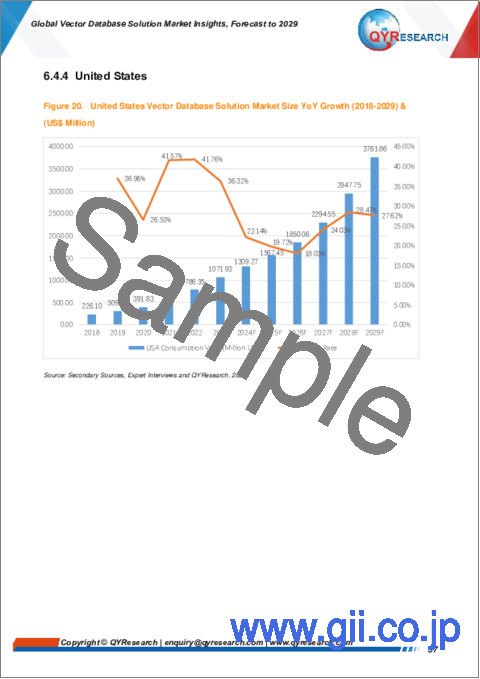
- Figure 20. United States Vector Database Solution Market Size YoY Growth (2018-2029) & (US$ Million)
- Figure 21. Canada Vector Database Solution Market Size YoY Growth (2018-2029) & (US$ Million)
- Figure 22. Europe Vector Database Solution Market Size YoY Growth (2018-2029) & (US$ Million)
- Figure 23. Europe Vector Database Solution Market Share by Type (2018-2029)
- Figure 24. Europe Vector Database Solution Market Share by Application (2018-2029)
- Figure 25. Europe Vector Database Solution Market Share by Country (2018-2029)
- Figure 26. Germany Vector Database Solution Market Size YoY Growth (2018-2029) & (US$ Million)
- Figure 27. France Vector Database Solution Market Size YoY Growth (2018-2029) & (US$ Million)
- Figure 28. U.K. Vector Database Solution Market Size YoY Growth (2018-2029) & (US$ Million)
- Figure 29. Italy Vector Database Solution Market Size YoY Growth (2018-2029) & (US$ Million)
- Figure 30. Russia Vector Database Solution Market Size YoY Growth (2018-2029) & (US$ Million)
- Figure 31. China Vector Database Solution Market Size YoY Growth (2018-2029) & (US$ Million)
- Figure 32. China Vector Database Solution Market Share by Type (2018-2029)
- Figure 33. China Vector Database Solution Market Share by Application (2018-2029)
- Figure 34. Asia Vector Database Solution Market Size YoY Growth (2018-2029) & (US$ Million)
- Figure 35. Asia Vector Database Solution Market Share by Type (2018-2029)
- Figure 36. Asia Vector Database Solution Market Share by Application (2018-2029)
- Figure 37. Asia Vector Database Solution Market Share by Region (2018-2029)
- Figure 38. Japan Vector Database Solution Market Size YoY Growth (2018-2029) & (US$ Million)
- Figure 39. South Korea Vector Database Solution Market Size YoY Growth (2018-2029) & (US$ Million)
- Figure 40. China Taiwan Vector Database Solution Market Size YoY Growth (2018-2029) & (US$ Million)
- Figure 41. Southeast Asia Vector Database Solution Market Size YoY Growth (2018-2029) & (US$ Million)
- Figure 42. India Vector Database Solution Market Size YoY Growth (2018-2029) & (US$ Million)
- Figure 43. Australia Vector Database Solution Market Size YoY Growth (2018-2029) & (US$ Million)
- Figure 44. Middle East, Africa, and Latin America Vector Database Solution Market Size YoY Growth (2018-2029) & (US$ Million)
- Figure 45. Middle East, Africa, and Latin America Vector Database Solution Market Share by Type (2018-2029)
- Figure 46. Middle East, Africa, and Latin America Vector Database Solution Market Share by Application (2018-2029)
- Figure 47. Middle East, Africa, and Latin America Vector Database Solution Market Share by Country (2018-2029)
- Figure 48. Brazil Vector Database Solution Market Size YoY Growth (2018-2029) & (US$ Million)
- Figure 49. Mexico Vector Database Solution Market Size YoY Growth (2018-2029) & (US$ Million)
- Figure 50. Turkey Vector Database Solution Market Size YoY Growth (2018-2029) & (US$ Million)
- Figure 51. GCC Countries Vector Database Solution Market Size YoY Growth (2018-2029) & (US$ Million)
- Figure 52. Zilliz Revenue Growth Rate in Vector Database Solution Business (2018-2023)
- Figure 53. Faiss Revenue Growth Rate in Vector Database Solution Business (2018-2023)
- Figure 54. Redis Revenue Growth Rate in Vector Database Solution Business (2018-2023)
- Figure 55. Tinybird Revenue Growth Rate in Vector Database Solution Business (2018-2023)
- Figure 56. Vespa Revenue Growth Rate in Vector Database Solution Business (2018-2023)
- Figure 57. Vald Revenue Growth Rate in Vector Database Solution Business (2018-2023)
- Figure 58. Pinecone Revenue Growth Rate in Vector Database Solution Business (2018-2023)
- Figure 59. Weaviate Revenue Growth Rate in Vector Database Solution Business (2018-2023)
- Figure 60. Bottom-up and Top-down Approaches for This Report
- Figure 61. Data Triangulation
- Figure 62. Key Executives Interviewed
The global Vector Database Solution market is projected to grow from US$ 3218.25 million in 2023 to US$ 10921.93 million by 2029, at a Compound Annual Growth Rate (CAGR) of 22.59% during the forecast period.
The US & Canada market for Vector Database Solution is estimated to increase from $ 1182.06 million in 2023 to reach $ 3919.88 million by 2029, at a CAGR of 22.12% during the forecast period of 2024 through 2029.
The China market for Vector Database Solution is estimated to increase from $ 260.03 million in 2023 to reach $ 952.39 million by 2029, at a CAGR of 24.15% during the forecast period of 2024 through 2029.
The Europe market for Vector Database Solution is estimated to increase from $ 804.88 million in 2023 to reach $ 2650.75 million by 2029, at a CAGR of 21.98% during the forecast period of 2024 through 2029.
The global key companies of Vector Database Solution include: Zilliz, Faiss, Redis, Tinybird, Vespa, Vald, Pinecone, Weaviate, and etc. In 2022, the global top three players had a share approximately 41.44% in terms of revenue.
Report Includes:
This report presents an overview of global market for Vector Database Solution market size. Analyses of the global market trends, with historic market revenue data for 2018 - 2022, estimates for 2023, and projections of CAGR through 2029.
This report researches the key producers of Vector Database Solution, also provides the revenue of main regions and countries. Highlights of the upcoming market potential for Vector Database Solution, and key regions/countries of focus to forecast this market into various segments and sub-segments. Country specific data and market value analysis for the U.S., Canada, Mexico, Brazil, China, Japan, South Korea, Southeast Asia, India, Germany, the U.K., Italy, Middle East, Africa, and Other Countries.
This report focuses on the Vector Database Solutionrevenue, market share and industry ranking of main companies, data from 2018 to 2023. Identification of the major stakeholders in the global Vector Database Solution market, and analysis of their competitive landscape and market positioning based on recent developments and segmental revenues. This report will help stakeholders to understand the competitive landscape and gain more insights and position their businesses and market strategies in a better way.
This report analyzes the segments data by Type and by Application, revenue, and growth rate, from 2018 to 2029. Evaluation and forecast the market size for Vector Database Solution revenue, projected growth trends, production technology, application and end-user industry.
Descriptive company profiles of the major global players, including Zilliz, Faiss, Redis, Tinybird, Vespa, Vald, Pinecone, Weaviate, and etc.
By Company
- Zilliz
- Faiss
- Redis
- Tinybird
- Vespa
- Vald
- Pinecone
- Weaviate
Segment by Type
- Cloud Based
- On-Premises
Segment by Application
- Personal
- Enterprise
By Region
- North America
- United States
- Canada
- Asia-Pacific
- China
- Japan
- South Korea
- Southeast Asia
- India
- Australia
- Rest of Asia
- Europe
- Germany
- France
- U.K.
- Italy
- Russia
- Rest of Europe
- Latin America
- Mexico
- Brazil
- Rest of Latin America
- Middle East & Africa
- Turkey
- Saudi Arabia
- UAE
- Rest of MEA
Chapter Outline
Chapter 1: Introduces the report scope of the report, executive summary of different market segments (product type, application, etc), including the market size of each market segment, future development potential, and so on. It offers a high-level view of the current state of the market and its likely evolution in the short to mid-term, and long term.
Chapter 2: Revenue of Vector Database Solution in global and regional level. It provides a quantitative analysis of the market size and development potential of each region and its main countries and introduces the market development, future development prospects, market space, and capacity of each country in the world. This section also introduces the market dynamics, latest developments of the market, the driving factors and restrictive factors of the market, the challenges and risks faced by companies in the industry, and the analysis of relevant policies in the industry.
Chapter 3: Detailed analysis of Vector Database Solution companies' competitive landscape, revenue, market share and industry ranking, latest development plan, merger, and acquisition information, etc.
Chapter 4: Provides the analysis of various market segments by Type, covering the revenue, and development potential of each market segment, to help readers find the blue ocean market in different market segments.
Chapter 5: Provides the analysis of various market segments by Application, covering the revenue, and development potential of each market segment, to help readers find the blue ocean market in different downstream markets.
Chapter 6: North America (US & Canada) by Type, by Application and by country, revenue for each segment.
Chapter 7: Europe by Type, by Application and by country, revenue for each segment.
Chapter 8: China by Type, and by Application, revenue for each segment.
Chapter 9: Asia (excluding China) by Type, by Application and by region, revenue for each segment.
Chapter 10: Middle East, Africa, and Latin America by Type, by Application and by country, revenue for each segment.
Chapter 11: Provides profiles of key companies, introducing the basic situation of the main companies in the market in detail, including product descriptions and specifications, Vector Database Solutionrevenue, gross margin, and recent development, etc.
Chapter 12: Analyst's Viewpoints/Conclusions.
Table of Contents
1 Report Overview
- 1.1 Study Scope
- 1.2 Market Analysis by Type
- 1.2.1 Global Vector Database Solution Market Size Growth Rate by Type: 2018 VS 2022 VS 2029
- 1.2.2 Cloud Based
- 1.2.3 On-Premises
- 1.3 Market by Application
- 1.3.1 Global Vector Database Solution Market Share by Application: 2018 VS 2022 VS 2029
- 1.3.2 Personal
- 1.3.3 Enterprise
- 1.4 Assumptions and Limitations
- 1.5 Study Objectives
- 1.6 Years Considered
2 Global Growth Trends
- 2.1 Global Vector Database Solution Market Perspective (2018-2029)
- 2.2 Global Vector Database Solution Growth Trends by Region
- 2.2.1 Global Vector Database Solution Market Size by Region: 2018 VS 2022 VS 2029
- 2.2.2 Vector Database Solution Historic Market Size by Region (2018-2023)
- 2.2.3 Vector Database Solution Forecasted Market Size by Region (2024-2029)
- 2.3 Vector Database Solution Market Dynamics
- 2.3.1 Vector Database Solution Industry Trends
- 2.3.2 Vector Database Solution Market Drivers
- 2.3.3 Vector Database Solution Market Challenges
- 2.3.4 Vector Database Solution Market Restraints
3 Competition Landscape by Key Players
- 3.1 Global Revenue Vector Database Solution by Players
- 3.1.1 Global Vector Database Solution Revenue by Players (2018-2023)
- 3.1.2 Global Vector Database Solution Revenue Market Share by Players (2018-2023)
- 3.2 Global Vector Database Solution Market Share by Company Type (Tier 1, Tier 2, and Tier 3)
- 3.3 Global Key Players of Vector Database Solution, Ranking by Revenue, 2021 VS 2022 VS 2023
- 3.4 Global Vector Database Solution Market Concentration Ratio
- 3.4.1 Global Vector Database Solution Market Concentration Ratio (CR3 and HHI)
- 3.4.2 Global Top 3 Companies by Vector Database Solution Revenue in 2022
- 3.5 Global Key Players of Vector Database Solution Head office and Area Served
- 3.6 Global Key Players of Vector Database Solution, Product and Application
- 3.7 Global Key Players of Vector Database Solution, Date of Enter into This Industry
- 3.8 Financing Information
4 Vector Database Solution Breakdown Data by Type
- 4.1 Global Vector Database Solution Historic Market Size by Type (2018-2023)
- 4.2 Global Vector Database Solution Forecasted Market Size by Type (2024-2029)
5 Vector Database Solution Breakdown Data by Application
- 5.1 Global Vector Database Solution Historic Market Size by Application (2018-2023)
- 5.2 Global Vector Database Solution Forecasted Market Size by Application (2024-2029)
6 North America
- 6.1 North America Vector Database Solution Market Size (2018-2029)
- 6.2 North America Vector Database Solution Market Size by Type
- 6.2.1 North America Vector Database Solution Market Size by Type (2018-2023)
- 6.2.2 North America Vector Database Solution Market Size by Type (2024-2029)
- 6.2.3 North America Vector Database Solution Market Share by Type (2018-2029)
- 6.3 North America Vector Database Solution Market Size by Application
- 6.3.1 North America Vector Database Solution Market Size by Application (2018-2023)
- 6.3.2 North America Vector Database Solution Market Size by Application (2024-2029)
- 6.3.3 North America Vector Database Solution Market Share by Application (2018-2029)
- 6.4 North America Vector Database Solution Market Size by Country
- 6.4.1 North America Vector Database Solution Market Size by Country: 2018 VS 2022 VS 2029
- 6.4.2 North America Vector Database Solution Market Size by Country (2018-2023)
- 6.4.3 North America Vector Database Solution Market Share by Country (2024-2029)
- 6.4.4 United States
- 6.4.5 Canada
7 Europe
- 7.1 Europe Vector Database Solution Market Size (2018-2029)
- 7.2 Europe Vector Database Solution Market Size by Type
- 7.2.1 Europe Vector Database Solution Market Size by Type (2018-2023)
- 7.2.2 Europe Vector Database Solution Market Size by Type (2024-2029)
- 7.2.3 Europe Vector Database Solution Market Share by Type (2018-2029)
- 7.3 Europe Vector Database Solution Market Size by Application
- 7.3.1 Europe Vector Database Solution Market Size by Application (2018-2023)
- 7.3.2 Europe Vector Database Solution Market Size by Application (2024-2029)
- 7.3.3 Europe Vector Database Solution Market Share by Application (2018-2029)
- 7.4 Europe Vector Database Solution Market Size by Country
- 7.4.1 Europe Vector Database Solution Market Size by Country: 2018 VS 2022 VS 2029
- 7.4.2 Europe Vector Database Solution Market Size by Country (2018-2023)
- 7.4.3 Europe Vector Database Solution Market Size by Country (2024-2029)
- 7.4.4 Germany
- 7.4.5 France
- 7.4.6 U.K.
- 7.4.7 Italy
- 7.4.8 Russia
8 China
- 8.1 China Vector Database Solution Market Size (2018-2029)
- 8.2 China Vector Database Solution Market Size by Type
- 8.2.1 China Vector Database Solution Market Size by Type (2018-2023)
- 8.2.2 China Vector Database Solution Market Size by Type (2024-2029)
- 8.2.3 China Vector Database Solution Market Share by Type (2018-2029)
- 8.3 China Vector Database Solution Market Size by Application
- 8.3.1 China Vector Database Solution Market Size by Application (2018-2023)
- 8.3.2 China Vector Database Solution Market Size by Application (2024-2029)
- 8.3.3 China Vector Database Solution Market Share by Application (2018-2029)
9 Asia (excluding China)
- 9.1 Asia Vector Database Solution Market Size (2018-2029)
- 9.2 Asia Vector Database Solution Market Size by Type
- 9.2.1 Asia Vector Database Solution Market Size by Type (2018-2023)
- 9.2.2 Asia Vector Database Solution Market Size by Type (2024-2029)
- 9.2.3 Asia Vector Database Solution Market Share by Type (2018-2029)
- 9.3 Asia Vector Database Solution Market Size by Application
- 9.3.1 Asia Vector Database Solution Market Size by Application (2018-2023)
- 9.3.2 Asia Vector Database Solution Market Size by Application (2024-2029)
- 9.3.3 Asia Vector Database Solution Market Share by Application (2018-2029)
- 9.4 Asia Vector Database Solution Market Size by Region
- 9.4.1 Asia Vector Database Solution Market Size by Region: 2018 VS 2022 VS 2029
- 9.4.2 Asia Vector Database Solution Market Size by Region (2018-2023)
- 9.4.3 Asia Vector Database Solution Market Size by Region (2024-2029)
- 9.4.4 Japan
- 9.4.5 South Korea
- 9.4.6 China Taiwan
- 9.4.7 Southeast Asia
- 9.4.8 India
- 9.4.9 Australia
10 Middle East, Africa, and Latin America
- 10.1 Middle East, Africa, and Latin America Vector Database Solution Market Size (2018-2029)
- 10.2 Middle East, Africa, and Latin America Vector Database Solution Market Size by Type
- 10.2.1 Middle East, Africa, and Latin America Vector Database Solution Market Size by Type (2018-2023)
- 10.2.2 Middle East, Africa, and Latin America Vector Database Solution Market Size by Type (2024-2029)
- 10.2.3 Middle East, Africa, and Latin America Vector Database Solution Market Share by Type (2018-2029)
- 10.3 Middle East, Africa, and Latin America Vector Database Solution Market Size by Application
- 10.3.1 Middle East, Africa, and Latin America Vector Database Solution Market Size by Application (2018-2023)
- 10.3.2 Middle East, Africa, and Latin America Vector Database Solution Market Size by Application (2024-2029)
- 10.3.3 Middle East, Africa, and Latin America Vector Database Solution Market Share by Application (2018-2029)
- 10.4 Middle East, Africa, and Latin America Vector Database Solution Market Size by Country
- 10.4.1 Middle East, Africa, and Latin America Vector Database Solution Market Size by Country: 2018 VS 2022 VS 2029
- 10.4.2 Middle East, Africa, and Latin America Vector Database Solution Market Size by Country (2018-2023)
- 10.4.3 Middle East, Africa, and Latin America Vector Database Solution Market Size by Country (2024-2029)
- 10.4.4 Brazil
- 10.4.5 Mexico
- 10.4.6 Turkey
- 10.4.7 GCC Countries
11 Key Players Profiles
- 11.1 Zilliz
- 11.1.1 Zilliz Company Details
- 11.1.2 Zilliz Business Overview
- 11.1.3 Zilliz Vector Database Solution Introduction
- 11.1.4 Zilliz Revenue in Vector Database Solution Business (2018-2023)
- 11.1.5 Zilliz Recent Development
- 11.2 Faiss
- 11.2.1 Faiss Company Details
- 11.2.2 Faiss Business Overview
- 11.2.3 Faiss Vector Database Solution Introduction
- 11.2.4 Faiss Revenue in Vector Database Solution Business (2018-2023)
- 11.3 Redis
- 11.3.1 Redis Company Details
- 11.3.2 Redis Business Overview
- 11.3.3 Redis Vector Database Solution Introduction
- 11.3.4 Redis Revenue in Vector Database Solution Business (2018-2023)
- 11.4 Tinybird
- 11.4.1 Tinybird Company Details
- 11.4.2 Tinybird Business Overview
- 11.4.3 Tinybird Vector Database Solution Introduction
- 11.4.4 Tinybird Revenue in Vector Database Solution Business (2018-2023)
- 11.4.5 Tinybird Recent Development
- 11.5 Vespa
- 11.5.1 Vespa Company Details
- 11.5.2 Vespa Business Overview
- 11.5.3 Vespa Vector Database Solution Introduction
- 11.5.4 Vespa Revenue in Vector Database Solution Business (2018-2023)
- 11.5.5 Vespa Recent Development
- 11.6 Vald
- 11.6.1 Vald Company Details
- 11.6.2 Vald Business Overview
- 11.6.3 Vald Vector Database Solution Introduction
- 11.6.4 Vald Revenue in Vector Database Solution Business (2018-2023)
- 11.7 Pinecone
- 11.7.1 Pinecone Company Details
- 11.7.2 Pinecone Business Overview
- 11.7.3 Pinecone Vector Database Solution Introduction
- 11.7.4 Pinecone Revenue in Vector Database Solution Business (2018-2023)
- 11.8 Weaviate
- 11.8.1 Weaviate Company Details
- 11.8.2 Weaviate Business Overview
- 11.8.3 Weaviate Vector Database Solution Introduction
- 11.8.4 Weaviate Revenue in Vector Database Solution Business (2018-2023)
- 11.8.5 Weaviate Recent Development
12 Analyst's Viewpoints/Conclusions
13 Appendix
- 13.1 Research Methodology
- 13.1.1 Methodology/Research Approach
- 13.1.2 Data Source
- 13.2 Author Details
- 13.3 Disclaimer

