|
|
市場調査レポート
商品コード
1384355
組込みソフトウェアの世界市場:実績と予測(2023年~2029年)Global Embedded Software Market Report, History and Forecast 2023-2029 |
||||||
|
|
|||||||
カスタマイズ可能
適宜更新あり
|
|||||||


| 組込みソフトウェアの世界市場:実績と予測(2023年~2029年) |
|
出版日: 2023年11月23日
発行: QYResearch
ページ情報: 英文 121 Pages
納期: 2~3営業日
|

- 全表示
- 概要
- 図表
- 目次
世界の組込みソフトウェアの市場規模は、2022年に147億8,000万米ドルとなり、2029年までに239億4,000万米ドルの規模に達するとみられており、2023年~2029年の予測期間中に7.02%のCAGRで成長すると予測されています。
当レポートでは、世界の組込みソフトウェア市場について調査し、市場の概要とともに、企業別、タイプ別、用途別、地域別の動向、および市場に参入する企業のプロファイルなどを提供しています。
目次
第1章 組込みソフトウェアの市場概要
- 組込みソフトウェア市場概要
- 世界の組込みソフトウェア市場規模の概要2018年 VS 2022年 VS 2029年、地域別
- 世界の組込みソフトウェア市場規模(2018年~2029年)、地域別
- 世界の組込みソフトウェア市場規模実績(2018年~2023年)、地域別
- 世界の組込みソフトウェア市場規模予測(2024年~2029年)、地域別
- 主要地域の組込みソフトウェア市場規模(2018年~2029年)、地域別
第2章 組込みソフトウェア市場概要、タイプ別
- 世界の組込みソフトウェア市場規模:2018年 VS 2022年 VS 2029年、タイプ別
- 世界の組込みソフトウェア市場規模実績(2018年~2023年)、タイプ別
- 世界の組込みソフトウェア市場規模予測(2024年~2029年)、タイプ別
- 汎用オペレーティングシステム
- リアルタイムオペレーティングシステム
第3章 組込みソフトウェア市場概要、用途別
- 世界の組込みソフトウェア市場規模:2018年 VS 2022年 VS 2029年、用途別
- 世界の組込みソフトウェア市場規模実績(2018年~2023年)、用途別
- 世界の組込みソフトウェア市場規模予測(2024年~2029年)、用途別
- 自動車
- ヘルスケア
- 通信・IT
- 家電
- 産業用
- 軍事・防衛
第4章 参入企業による組込みソフトウェア競合分析
第5章 企業(主要参入企業)プロファイル
- NXP Semiconductors
- STMicroelectronics
- Texas Instruments
- Infineon Technologies
- Microsoft
- Intel
- IBM
- Microchip Technology
- Siemens
- Advantech
- BlackBerry
- Mitsubishi Electric
- Green Hills Software
第6章 北米
第7章 欧州
第8章 アジア太平洋
第9章 ラテンアメリカ
第10章 中東・アフリカ
第11章 組込みソフトウェア市場力学
- 組込みソフトウェア業界の動向
- 組込みソフトウェア市場の促進要因
- 組込みソフトウェア市場の課題
- 組込みソフトウェア市場の抑制要因
第12章 調査結果/結論
第13章 調査手法とデータソース
List of Tables
- Table 1. Global Market Embedded Software Market Size (US$ Million) Comparison by Region: 2018 VS 2022 VS 2029
- Table 2. Global Embedded Software Market Size by Region (2018-2023) & (US$ Million)
- Table 3. Global Embedded Software Market Size Share by Region (2018-2023)
- Table 4. Global Embedded Software Forecasted Market Size by Region (2024-2029) & (US$ Million)
- Table 5. Global Embedded Software Forecasted Market Size Share by Region (2024-2029)
- Table 6. Global Embedded Software Market Size (US$ Million) by Type: 2018 VS 2022 VS 2029
- Table 7. Global Embedded Software Market Size by Type (2018-2023) & (US$ Million)
- Table 8. Global Embedded Software Revenue Market Share by Type (2018-2023)
- Table 9. Global Embedded Software Forecasted Market Size by Type (2024-2029) & (US$ Million)
- Table 10. Global Embedded Software Revenue Market Share by Type (2024-2029)
- Table 11. Global Embedded Software Market Size by Application: (US$ Million) 2018 VS 2022 VS 2029
- Table 12. Global Embedded Software Market Size by Application (2018-2023) & (US$ Million)
- Table 13. Global Embedded Software Revenue Market Share by Application (2018-2023)
- Table 14. Global Embedded Software Forecasted Market Size by Application (2024-2029) & (US$ Million)
- Table 15. Global Embedded Software Revenue Market Share by Application (2024-2029)
- Table 16. Global Embedded Software Revenue by Players (2019-2023) & (US$ Million)
- Table 17. Global Embedded Software Revenue Market Share by Players (2019-2023)
- Table 18. Global Top Players Market Share by Company Type (Tier 1, Tier 2, and Tier 3) & (based on the Revenue in Embedded Software as of 2022)
- Table 19. Global Key Players of Embedded Software, Headquarters and Area Served
- Table 20. Global Key Players of Embedded Software, Product and Application
- Table 21. Established Date of Major Players
- Table 22. Global Embedded Software Players Market Concentration Ratio (CR5)
- Table 23. Mergers & Acquisitions, Expansion Plans
- Table 24. NXP Semiconductors Basic Information List
- Table 25. NXP Semiconductors Embedded Software Products, Services and Solutions
- Table 26. Revenue (US$ Million) in Embedded Software Business of NXP Semiconductors (2019-2023)
- Table 27. NXP Semiconductors Recent Developments
- Table 28. STMicroelectronics Basic Information List
- Table 29. STMicroelectronics Embedded Software Products, Services and Solutions
- Table 30. Revenue (US$ Million) in Embedded Software Business of STMicroelectronics (2019-2023)
- Table 31. STMicroelectronics Recent Developments
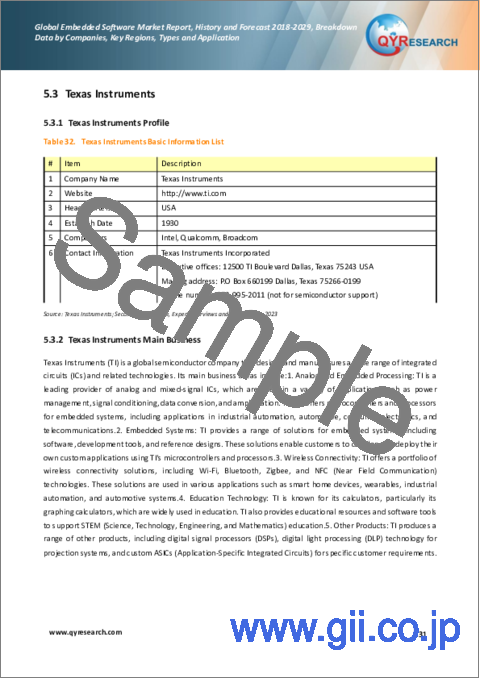
- Table 32. Texas Instruments Basic Information List
- Table 33. Texas Instruments Embedded Software Products, Services and Solutions
- Table 34. Revenue (US$ Million) in Embedded Software Business of Texas Instruments (2019-2023)
- Table 35. Texas Instruments Recent Developments
- Table 36. Infineon Technologies Basic Information List
- Table 37. Infineon Technologies Embedded Software Products, Services and Solutions
- Table 38. Revenue (US$ Million) in Embedded Software Business of Infineon Technologies (2019-2023)
- Table 39. Infineon Technologies Recent Developments
- Table 40. Microsoft Basic Information List
- Table 41. Microsoft Embedded Software Products, Services and Solutions
- Table 42. Revenue (US$ Million) in Embedded Software Business of Microsoft (2019-2023)
- Table 43. Microsoft Recent Developments
- Table 44. Intel Basic Information List
- Table 45. Intel Embedded Software Products, Services and Solutions
- Table 46. Revenue (US$ Million) in Embedded Software Business of Intel (2019-2023)
- Table 47. Intel Recent Developments
- Table 48. IBM Basic Information List
- Table 49. IBM Embedded Software Products, Services and Solutions
- Table 50. Revenue (US$ Million) in Embedded Software Business of IBM (2019-2023)
- Table 51. IBM Recent Developments
- Table 52. Microchip Technology Basic Information List
- Table 53. Microchip Technology Embedded Software Products, Services and Solutions
- Table 54. Revenue (US$ Million) in Embedded Software Business of Microchip Technology (2019-2023)
- Table 55. Microchip Technology Recent Developments
- Table 56. Siemens Basic Information List
- Table 57. Siemens Embedded Software Products, Services and Solutions
- Table 58. Revenue (US$ Million) in Embedded Software Business of Siemens (2019-2023)
- Table 59. Siemens Recent Developments
- Table 60. Advantech Basic Information List
- Table 61. Advantech Embedded Software Products, Services and Solutions
- Table 62. Revenue (US$ Million) in Embedded Software Business of Advantech (2019-2023)
- Table 63. Advantech Recent Developments
- Table 64. BlackBerry Basic Information List
- Table 65. BlackBerry Embedded Software Products, Services and Solutions
- Table 66. Revenue (US$ Million) in Embedded Software Business of BlackBerry (2019-2023)
- Table 67. BlackBerry Recent Developments
- Table 68. Mitsubishi Electric Basic Information List
- Table 69. Mitsubishi Electric Embedded Software Products, Services and Solutions
- Table 70. Revenue (US$ Million) in Embedded Software Business of Mitsubishi Electric (2019-2023)
- Table 71. Mitsubishi Electric Recent Developments
- Table 72. Green Hills Software Basic Information List
- Table 73. Green Hills Software Embedded Software Products, Services and Solutions
- Table 74. Revenue (US$ Million) in Embedded Software Business of Green Hills Software (2019-2023)
- Table 75. Green Hills Software Recent Developments
- Table 76. North America Embedded Software Market Size Growth Rate (CAGR) by Country (US$ Million): 2018 VS 2022 VS 2029
- Table 77. North America Embedded Software Market Size by Country (2019-2023) & (US$ Million)
- Table 78. North America Embedded Software Market Size by Country (2024-2029) & (US$ Million)
- Table 79. Europe Embedded Software Market Size Growth Rate (CAGR) by Country (US$ Million): 2018 VS 2022 VS 2029
- Table 80. Europe Embedded Software Market Size by Country (2018-2023) & (US$ Million)
- Table 81. Europe Embedded Software Market Size by Country (2024-2029) & (US$ Million)
- Table 82. Europe Embedded Software Market Share by Country (2018-2023)
- Table 83. Europe Embedded Software Market Share by Country (2024-2029)
- Table 84. Asia-Pacific Embedded Software Market Size Growth Rate (CAGR) by Region (US$ Million): 2018 VS 2022 VS 2029
- Table 85. Asia-Pacific Embedded Software Market Size by Region (2018-2023) & (US$ Million)
- Table 86. Asia-Pacific Embedded Software Market Size by Region (2024-2029) & (US$ Million)
- Table 87. Asia-Pacific Embedded Software Market Share by Region (2018-2023)
- Table 88. Asia-Pacific Embedded Software Market Share by Region (2024-2029)
- Table 89. Asia-Pacific Embedded Software Market Share by Region (2018-2029)
- Table 90. China Embedded Software Market Size (2018-2029) & (US$ Million)
- Table 91. Japan Embedded Software Market Size (2018-2029) & (US$ Million)
- Table 92. South Korea Embedded Software Market Size (2018-2029) & (US$ Million)
- Table 93. India Embedded Software Market Size (2018-2029) & (US$ Million)
- Table 94. Southeast Asia Embedded Software Market Size (2018-2029) & (US$ Million)
- Table 95. Australia Embedded Software Market Size (2018-2029) & (US$ Million)
- Table 96. Rest of Asia-Pacific Embedded Software Market Size (2018-2029) & (US$ Million)
- Table 97. Latin America Embedded Software Market Size Growth Rate (CAGR) by Country (US$ Million): 2018 VS 2022 VS 2029
- Table 98. Latin America Embedded Software Market Size by Country (2018-2023) & (US$ Million)
- Table 99. Latin America Embedded Software Market Size by Country (2024-2029) & (US$ Million)
- Table 100. Latin America Embedded Software Market Share by Country (2018-2029)
- Table 101. Brazil Embedded Software Market Size (2018-2029) & (US$ Million)
- Table 102. Argentina Embedded Software Market Size (2018-2029) & (US$ Million)
- Table 103. Colombia Embedded Software Market Size (2018-2029) & (US$ Million)
- Table 104. Rest of Latin America Embedded Software Market Size (2018-2029) & (US$ Million)
- Table 105. Middle East and Africa Embedded Software Market Size Growth Rate (CAGR) by Country (US$ Million): 2018 VS 2022 VS 2029
- Table 106. Middle East & Africa Embedded Software Market Size by Country (2018-2023) & (US$ Million)
- Table 107. Middle East & Africa Embedded Software Market Size by Country (2024-2029) & (US$ Million)
- Table 108. Middle East & Africa Embedded Software Market Share by Country (2018-2029)
- Table 109. Middle East Embedded Software Market Size (2018-2029) & (US$ Million)
- Table 110. Africa Embedded Software Market Size (2018-2029) & (US$ Million)
- Table 111. Embedded Software Market Trends
- Table 112. Embedded Software Market Drivers
- Table 113. Embedded Software Market Challenges
- Table 114. Embedded Software Market Restraints
- Table 115. Research Programs/Design for This Report
- Table 116. Key Data Information from Secondary Sources
- Table 117. Key Data Information from Primary Sources
- Table 118. QYR Business Unit and Senior & Team Lead Analysts
List of Figures
- Figure 1. Embedded Software Product
- Figure 2. Global Embedded Software Market Size Year-over-Year (2018-2029) & (US$ Million)
- Figure 3. Global Embedded Software Market Size, (US$ Million), 2018 VS 2022 VS 2029
- Figure 4. Global Embedded Software Market Share by Region in 2022
- Figure 5. Global Embedded Software Forecasted Market Size Share by Region (2018-2029)
- Figure 6. North America Embedded Software Market Size Growth Rate (2018-2029) & (US$ Million)
- Figure 7. Europe Embedded Software Market Size Growth Rate (2018-2029) & (US$ Million)
- Figure 8. Asia-Pacific Embedded Software Market Size Growth Rate (2018-2029) & (US$ Million)
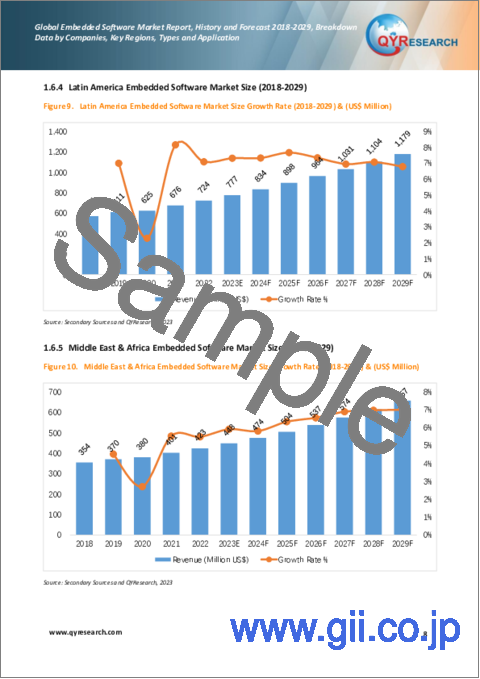
- Figure 9. Latin America Embedded Software Market Size Growth Rate (2018-2029) & (US$ Million)
- Figure 10. Middle East & Africa Embedded Software Market Size Growth Rate (2018-2029) & (US$ Million)
- Figure 11. Global Embedded Software Market Size Share by Type in 2022
- Figure 12. Global Embedded Software Market Size Share by Application in 2022
- Figure 13. The Top 5 Players Market Share by Embedded Software Sales in 2022
- Figure 14. The Top 10 Players Market Share by Embedded Software Sales in 2022
- Figure 15. North America Embedded Software Market Share by Country (2018-2029)
- Figure 16. United States Embedded Software Market Size (2018-2029) & (US$ Million)
- Figure 17. Canada Embedded Software Market Size (2018-2029) & (US$ Million)
- Figure 18. Mexico Embedded Software Market Size (2018-2029) & (US$ Million)
- Figure 19. Germany Embedded Software Market Size (2018-2029) & (US$ Million)
- Figure 20. France Embedded Software Market Size (2018-2029) & (US$ Million)
- Figure 21. U.K. Embedded Software Market Size (2018-2029) & (US$ Million)
- Figure 22. Italy Embedded Software Market Size (2018-2029) & (US$ Million)
- Figure 23. Russia Embedded Software Market Size (2018-2029) & (US$ Million)
- Figure 24. Rest of Europe Embedded Software Market Size (2018-2029) & (US$ Million)
- Figure 25. Bottom-up and Top-down Approaches for This Report
- Figure 26. Data Triangulation
The global market for Embedded Software estimated was at US$ 14.78 billion in the year 2022, is projected to reach a revised size of US$ 23.94 billion by 2029, growing at a CAGR of 7.02% during the forecast period 2023-2029.
Report Scope
This report aims to provide a comprehensive presentation of the global market for Embedded Software, with both quantitative and qualitative analysis, to help readers develop business/growth strategies, assess the market competitive situation, analyze their position in the current marketplace, and make informed business decisions regarding Embedded Software.
The Embedded Software market size, estimations, and forecasts are provided in terms of revenue ($ millions), considering 2022 as the base year, with history and forecast data for the period from 2018 to 2029. This report segments the global Embedded Software market comprehensively. Regional market sizes, concerning products by Type, by Application, and by players, are also provided. The influence of COVID-19 and the Russia-Ukraine War were considered while estimating market sizes.
For a more in-depth understanding of the market, the report provides profiles of the competitive landscape, key competitors, and their respective market ranks. The report also discusses technological trends and new product developments.
This report will help the readers to understand the competition within the industries and strategies for the competitive environment to enhance the potential profit. The report also focuses on the competitive landscape of the global Embedded Software market, and introduces in detail the market share, industry ranking, competitor ecosystem, market performance, new product development, operation situation, expansion, and acquisition. etc. of the main players, which helps the readers to identify the main competitors and deeply understand the competition pattern of the market.
Market Segmentation
This report covers the Embedded Software segments by company, by Type, by Application, by region and country, and provides market size and CAGR for the history and forecast period (2018-2023, 2024-2029), considering 2022 as the base year. It elucidates potential revenue opportunities across different segments and explains attractive investment proposition matrices for this market.
By Company
- NXP Semiconductors
- STMicroelectronics
- Texas Instruments
- Infineon Technologies
- Microsoft
- Intel
- IBM
- Microchip Technology
- Siemens
- Advantech
- BlackBerry
- Mitsubishi Electric
- Green Hills Software
Segment by Type
- General-Purpose Operating System
- Real-Time Operating System
Segment by Application
- Automotive
- Healthcare
- Consumer Electronics
- Military & Defense
- Industrial
- Telecom & IT
- Other
By Region
- North America
- United States
- Canada
- Mexico
- Asia-Pacific
- China
- Japan
- Korea
- India
- Southeast Asia
- Australia
- Rest of Asia-Pacific
- Europe
- Germany
- France
- U.K.
- Italy
- Russia
- Rest of Europe
- Latin America
- Brazil
- Argentina
- Colombia
- Rest of Latin America
- Middle East & Africa
- Middle East
- Africa
Core Chapters
Chapter One: Introduces the report scope of the report, executive summary of global and regional market size and CAGR for the history and forecast period (2018-2023, 2024-2029). It offers a high-level view of the current state of the market and its likely evolution in the short to mid-term, and long term.
Chapter Two: Provides the analysis of various market segments by Type, covering the market size and development potential of each market segment, to help readers find the blue ocean market in different market segments.
Chapter Three: Provides the analysis of various market segments by Application, covering the market size and development potential of each market segment, to help readers find the blue ocean market in different downstream markets.
Chapter Four: Detailed analysis of Embedded Software companies's competitive landscape, revenue, market share and ranking, latest development plan, merger, and acquisition information, etc.
Chapter Five: Provides profiles of key players, introducing the basic situation of the main companies in the market in detail, including product introduction, revenue, recent development, etc.
Chapter Six, Seven, Eight, Nine and Ten: North America, Europe, Asia Pacific, Latin America, Middle East & Africa, revenue by country.
Chapter Eleven: this section also introduces the market dynamics, latest developments of the market, the driving factors and restrictive factors of the market, the challenges and risks faced by companies in the industry, and the analysis of relevant policies in the industry.
Chapter Twelve: Research Finding/Conclusion.
Table of Contents
1 Market Overview of Embedded Software
- 1.1 Embedded Software Market Overview
- 1.1.1 Embedded Software Product Scope
- 1.1.2 Embedded Software Market Status and Outlook
- 1.2 Global Embedded Software Market Size Overview by Region 2018 VS 2022 VS 2029
- 1.3 Global Embedded Software Market Size by Region (2018-2029)
- 1.4 Global Embedded Software Historic Market Size by Region (2018-2023)
- 1.5 Global Embedded Software Market Size Forecast by Region (2024-2029)
- 1.6 Key Regions Embedded Software Market Size (2018-2029)
- 1.6.1 North America Embedded Software Market Size (2018-2029)
- 1.6.2 Europe Embedded Software Market Size (2018-2029)
- 1.6.3 Asia-Pacific Embedded Software Market Size (2018-2029)
- 1.6.4 Latin America Embedded Software Market Size (2018-2029)
- 1.6.5 Middle East & Africa Embedded Software Market Size (2018-2029)
2 Embedded Software Market Overview by Type
- 2.1 Global Embedded Software Market Size by Type: 2018 VS 2022 VS 2029
- 2.2 Global Embedded Software Historic Market Size by Type (2018-2023)
- 2.3 Global Embedded Software Forecasted Market Size by Type (2024-2029)
- 2.4 General-Purpose Operating System
- 2.5 Real-Time Operating System
3 Embedded Software Market Overview by Application
- 3.1 Global Embedded Software Market Size by Application: 2018 VS 2022 VS 2029
- 3.2 Global Embedded Software Historic Market Size by Application (2018-2023)
- 3.3 Global Embedded Software Forecasted Market Size by Application (2024-2029)
- 3.4 Automotive
- 3.5 Healthcare
- 3.6 Telecom & IT
- 3.7 Consumer Electronics
- 3.8 Industrial
- 3.9 Military & Defense
4 Embedded Software Competition Analysis by Players
- 4.1 Global Embedded Software Market Size by Players (2019-2023)
- 4.2 Global Top Players by Company Type (Tier 1, Tier 2, and Tier 3) & (based on the Revenue in Embedded Software as of 2022)
- 4.3 Global Key Players of Embedded Software Head office and Area Served
- 4.4 Global Key Players of Embedded Software, Product and Application
- 4.5 Established Date of Major Players
- 4.6 Competitive Status
- 4.6.1 Embedded Software Market Concentration Rate
- 4.6.2 Mergers & Acquisitions, Expansion Plans
5 Company (Top Players) Profiles
- 5.1 NXP Semiconductors
- 5.1.1 NXP Semiconductors Profile
- 5.1.2 NXP Semiconductors Main Business
- 5.1.3 NXP Semiconductors Embedded Software Products, Services and Solutions
- 5.1.4 NXP Semiconductors Embedded Software Revenue (US$ Million) & (2019-2023)
- 5.1.5 NXP Semiconductors Recent Developments
- 5.2 STMicroelectronics
- 5.2.1 STMicroelectronics Profile
- 5.2.2 STMicroelectronics Main Business
- 5.2.3 STMicroelectronics Embedded Software Products, Services and Solutions
- 5.2.4 STMicroelectronics Embedded Software Revenue (US$ Million) & (2019-2023)
- 5.2.5 STMicroelectronics Recent Developments
- 5.3 Texas Instruments
- 5.3.1 Texas Instruments Profile
- 5.3.2 Texas Instruments Main Business
- 5.3.3 Texas Instruments Embedded Software Products, Services and Solutions
- 5.3.4 Texas Instruments Embedded Software Revenue (US$ Million) & (2019-2023)
- 5.3.5 Texas Instruments Recent Developments
- 5.4 Infineon Technologies
- 5.4.1 Infineon Technologies Profile
- 5.4.2 Infineon Technologies Main Business
- 5.4.3 Infineon Technologies Embedded Software Products, Services and Solutions
- 5.4.4 Infineon Technologies Embedded Software Revenue (US$ Million) & (2019-2023)
- 5.4.5 Infineon Technologies Recent Developments
- 5.5 Microsoft
- 5.5.1 Microsoft Profile
- 5.5.2 Microsoft Main Business
- 5.5.3 Microsoft Embedded Software Products, Services and Solutions
- 5.5.4 Microsoft Embedded Software Revenue (US$ Million) & (2019-2023)
- 5.5.5 Microsoft Recent Developments
- 5.6 Intel
- 5.6.1 Intel Profile
- 5.6.2 Intel Main Business
- 5.6.3 Intel Embedded Software Products, Services and Solutions
- 5.6.4 Intel Embedded Software Revenue (US$ Million) & (2019-2023)
- 5.6.5 Intel Recent Developments
- 5.7 IBM
- 5.7.1 IBM Profile
- 5.7.2 IBM Main Business
- 5.7.3 IBM Embedded Software Products, Services and Solutions
- 5.7.4 IBM Embedded Software Revenue (US$ Million) & (2019-2023)
- 5.7.5 IBM Recent Developments
- 5.8 Microchip Technology
- 5.8.1 Microchip Technology Profile
- 5.8.2 Microchip Technology Main Business
- 5.8.3 Microchip Technology Embedded Software Products, Services and Solutions
- 5.8.4 Microchip Technology Embedded Software Revenue (US$ Million) & (2019-2023)
- 5.8.5 Microchip Technology Recent Developments
- 5.9 Siemens
- 5.9.1 Siemens Profile
- 5.9.2 Siemens Main Business
- 5.9.3 Siemens Embedded Software Products, Services and Solutions
- 5.9.4 Siemens Embedded Software Revenue (US$ Million) & (2019-2023)
- 5.9.5 Siemens Recent Developments
- 5.10 Advantech
- 5.10.1 Advantech Profile
- 5.10.2 Advantech Main Business
- 5.10.3 Advantech Embedded Software Products, Services and Solutions
- 5.10.4 Advantech Embedded Software Revenue (US$ Million) & (2019-2023)
- 5.10.5 Advantech Recent Developments
- 5.11 BlackBerry
- 5.11.1 BlackBerry Profile
- 5.11.2 BlackBerry Main Business
- 5.11.3 BlackBerry Embedded Software Products, Services and Solutions
- 5.11.4 BlackBerry Embedded Software Revenue (US$ Million) & (2019-2023)
- 5.11.5 BlackBerry Recent Developments
- 5.12 Mitsubishi Electric
- 5.12.1 Mitsubishi Electric Profile
- 5.12.2 Mitsubishi Electric Main Business
- 5.12.3 Mitsubishi Electric Embedded Software Products, Services and Solutions
- 5.12.4 Mitsubishi Electric Embedded Software Revenue (US$ Million) & (2019-2023)
- 5.12.5 Mitsubishi Electric Recent Developments
- 5.13 Green Hills Software
- 5.13.1 Green Hills Software Profile
- 5.13.2 Green Hills Software Main Business
- 5.13.3 Green Hills Software Embedded Software Products, Services and Solutions
- 5.13.4 Green Hills Software Embedded Software Revenue (US$ Million) & (2019-2023)
- 5.13.5 Green Hills Software Recent Developments
6 North America
- 6.1 North America Embedded Software Market Size by Country (2018-2029)
- 6.2 United States
- 6.3 Canada
- 6.4 Mexico
7 Europe
- 7.1 Europe Embedded Software Market Size by Country (2018-2029)
- 7.2 Germany
- 7.3 France
- 7.4 U.K.
- 7.5 Italy
- 7.6 Russia
- 7.7 Rest of Europe
8 Asia-Pacific
- 8.1 Asia-Pacific Embedded Software Market Size by Region (2018-2029)
- 8.2 China
- 8.3 Japan
- 8.4 South Korea
- 8.5 India
- 8.6 Southeast Asia
- 8.7 Australia
- 8.8 Rest of Asia-Pacific
9 Latin America
- 9.1 Latin America Embedded Software Market Size by Country (2018-2029)
- 9.2 Brazil
- 9.3 Argentina
- 9.4 Colombia
- 9.5 Rest of Latin America
10 Middle East & Africa
- 10.1 Middle East & Africa Embedded Software Market Size by Country
- 10.2 Middle East
- 10.3 Africa
11 Embedded Software Market Dynamics
- 11.1 Embedded Software Industry Trends
- 11.2 Embedded Software Market Drivers
- 11.3 Embedded Software Market Challenges
- 11.4 Embedded Software Market Restraints
12 Research Finding/Conclusion
13 Methodology and Data Source
- 13.1 Methodology/Research Approach
- 13.1.1 Research Programs/Design
- 13.1.2 Market Size Estimation
- 13.1.3 Market Breakdown and Data Triangulation
- 13.2 Data Source
- 13.2.1 Secondary Sources
- 13.2.2 Primary Sources
- 13.3 Author List
- 13.4 Disclaimer
