|
|
市場調査レポート
商品コード
1381250
フルオレセインナトリウム点眼用ストリップの世界市場: 2029年までの予測Global Fluorescein Sodium Ophthalmic Strip Market Insights, Forecast to 2029 |
||||||
|
|
|||||||
カスタマイズ可能
適宜更新あり
|
|||||||


| フルオレセインナトリウム点眼用ストリップの世界市場: 2029年までの予測 |
|
出版日: 2023年11月16日
発行: QYResearch
ページ情報: 英文 171 Pages
納期: 2~3営業日
|

- 全表示
- 概要
- 図表
- 目次
世界のフルオレセインナトリウム点眼用ストリップの市場規模は、2023年の2,379万米ドルから、予測期間中は5.95%のCAGRで推移し、2029年には3,366万米ドルの規模に成長すると予測されています。
当レポートでは、世界のフルオレセインナトリウム点眼用ストリップの市場を調査し、市場および製品の概要、競合情勢、市場規模の推移・予測、各種区分・地域/主要国別の詳細分析、価格動向、市場成長への各種影響因子の分析、主要企業の分析などをまとめています。
目次
第1章 調査内容
- 製品概要
- タイプ別市場
- 成長率:2018 vs 2023 vs 2029
- 1mg
- その他(0.5mg、0.6mg)
- 用途別市場
- 市場規模:2018 vs 2023 vs 2029
- 病院
- 診療所
- 検眼センター
- 前提・制限
- 調査目的
- 調査年数
第2章 エグゼクティブサマリー
- 収益の推計・予測:2018-2029
- 収益の推移・予測・市場シェア:地域別
- 販売量の推計・予測:2018-2029
- 販売量の推移・予測・市場シェア:地域別
- 北米
- 欧州
- アジア太平洋
- ラテンアメリカ
- 中東・アフリカ
第3章 競合情勢:製造業者別
- 販売量の推移・市場シェア:製造業者別
- 収益の推移・市場シェア・トップ10およびトップ5社:製造業者別
- 世界の主要企業:業界ランキング
- 販売価格:製造業者別
- 競合情勢の分析
- 世界の主要製造業者:製造拠点の分布・本社
- 世界の主要製造業者:提供製品・用途
第4章 市場規模:タイプ別
- 販売量の推移・予測・市場シェア
- 収益の推移・予測・市場シェア
- 価格の推移・予測
第5章 市場規模:用途別
- 販売量の推移・予測・市場シェア
- 収益の推移・予測・市場シェア
- 価格の推移・予測
第6章 北米
第7章 欧州
第8章 アジア太平洋
第9章 ラテンアメリカ
第10章 中東・アフリカ
第11章 企業概要
- Biotech Vision Care Pvt. Ltd.
- Madhu Instruments Pvt. Ltd.
- Care Group Sight Solution
- DIOPTIC Pharmaceuticals Inc.
- Amcon Labs(Nomax Inc)
- Tianjin Jingming Electronic Materials Co
- Ophtechnics Unlimited
- Liaoning Meizilin
- Entod Research Cell UK Ltd
- Sidapharm
- AIESI Hospital Service
- Optitech Eye Care
第12章 産業チェーン・販売チャネルの分析
- 産業チェーン分析
- 主要な原材料
- 販売およびマーケティング
- 顧客
第13章 フルオレセインナトリウム点眼用ストリップ:市場力学
- 産業動向
- 市場促進要因
- 市場課題
第14章 世界のフルオレセインナトリウム点眼用ストリップ市場:主要調査結果
第15章 付録
List of Tables
- Table 1. Global Fluorescein Sodium Ophthalmic Strip Market Size Growth Rate by Type, 2018 VS 2023 VS 2029 (US$ Million)
- Table 2. Major Manufacturers of Other (0.5 mg, 0.6 mg)
- Table 3. Global Fluorescein Sodium Ophthalmic Strip Market Size Growth Rate by Application, 2018 VS 2023 VS 2029 (US$ Million)
- Table 4. Global Fluorescein Sodium Ophthalmic Strip Revenue Grow Rate (CAGR) by Region: 2018 VS 2023 VS 2029 (US$ Million)
- Table 5. Global Fluorescein Sodium Ophthalmic Strip Revenue by Region (2018-2023) & (US$ Million)
- Table 6. Global Fluorescein Sodium Ophthalmic Strip Revenue by Region (2024-2029) & (US$ Million)
- Table 7. Global Fluorescein Sodium Ophthalmic Strip Revenue Market Share by Region (2018-2023)
- Table 8. Global Fluorescein Sodium Ophthalmic Strip Revenue Market Share by Region (2024-2029)
- Table 9. Global Fluorescein Sodium Ophthalmic Strip Sales Grow Rate (CAGR) by Region: 2018 VS 2023 VS 2029 (K Units)
- Table 10. Global Fluorescein Sodium Ophthalmic Strip Sales by Region (2018-2023) & (K Units)
- Table 11. Global Fluorescein Sodium Ophthalmic Strip Sales by Region (2024-2029) & (K Units)
- Table 12. Global Fluorescein Sodium Ophthalmic Strip Sales Market Share by Region (2018-2023)
- Table 13. Global Fluorescein Sodium Ophthalmic Strip Sales Market Share by Region (2024-2029)
- Table 14. Global Fluorescein Sodium Ophthalmic Strip Sales by Manufacturers (2018-2023) & (K Units)
- Table 15. Global Fluorescein Sodium Ophthalmic Strip Sales Share by Manufacturers (2018-2023)
- Table 16. Global Fluorescein Sodium Ophthalmic Strip Revenue by Manufacturers (2018-2023) & (US$ Million)
- Table 17. Global Fluorescein Sodium Ophthalmic Strip Revenue Market Share by Manufacturers (2018-2023)
- Table 18. Global Key Players of Fluorescein Sodium Ophthalmic Strip, Industry Ranking, 2021 VS 2022 VS 2023
- Table 19. Fluorescein Sodium Ophthalmic Strip Price by Manufacturers (2018-2023) & (US$/Unit)
- Table 20. Global Fluorescein Sodium Ophthalmic Strip Manufacturers Market Concentration Ratio (CR5 and HHI)
- Table 21. Global Fluorescein Sodium Ophthalmic Strip by Company Type (Tier 1, Tier 2, and Tier 3) & (based on the Revenue in Fluorescein Sodium Ophthalmic Strip as of 2022)
- Table 22. Global Key Manufacturers of Fluorescein Sodium Ophthalmic Strip, Manufacturing Base Distribution and Headquarters
- Table 23. Global Key Manufacturers of Fluorescein Sodium Ophthalmic Strip, Product Offered and Application
- Table 24. Global Fluorescein Sodium Ophthalmic Strip Sales by Type (2018-2023) & (K Units)
- Table 25. Global Fluorescein Sodium Ophthalmic Strip Sales by Type (2024-2029) & (K Units)
- Table 26. Global Fluorescein Sodium Ophthalmic Strip Sales Share by Type (2018-2023)
- Table 27. Global Fluorescein Sodium Ophthalmic Strip Sales Share by Type (2024-2029)
- Table 28. Global Fluorescein Sodium Ophthalmic Strip Revenue by Type (2018-2023) & (US$ Million)
- Table 29. Global Fluorescein Sodium Ophthalmic Strip Revenue by Type (2024-2029) & (US$ Million)
- Table 30. Global Fluorescein Sodium Ophthalmic Strip Revenue Share by Type (2018-2023)
- Table 31. Global Fluorescein Sodium Ophthalmic Strip Revenue Share by Type (2024-2029)
- Table 32. Fluorescein Sodium Ophthalmic Strip Price by Type (2018-2023) & (US$/Unit)
- Table 33. Global Fluorescein Sodium Ophthalmic Strip Price Forecast by Type (2024-2029) & (US$/Unit)
- Table 34. Global Fluorescein Sodium Ophthalmic Strip Sales by Application (2018-2023) & (K Units)
- Table 35. Global Fluorescein Sodium Ophthalmic Strip Sales by Application (2024-2029) & (K Units)
- Table 36. Global Fluorescein Sodium Ophthalmic Strip Sales Share by Application (2018-2023)
- Table 37. Global Fluorescein Sodium Ophthalmic Strip Sales Share by Application (2024-2029)
- Table 38. Global Fluorescein Sodium Ophthalmic Strip Revenue by Application (2018-2023) & (US$ Million)
- Table 39. Global Fluorescein Sodium Ophthalmic Strip Revenue by Application (2024-2029) & (US$ Million)
- Table 40. Global Fluorescein Sodium Ophthalmic Strip Revenue Share by Application (2018-2023)
- Table 41. Global Fluorescein Sodium Ophthalmic Strip Revenue Share by Application (2024-2029)
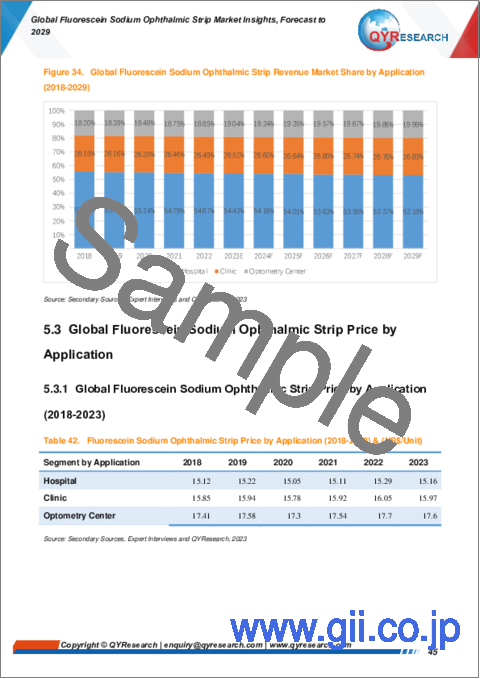
- Table 42. Fluorescein Sodium Ophthalmic Strip Price by Application (2018-2023) & (US$/Unit)
- Table 43. Global Fluorescein Sodium Ophthalmic Strip Price Forecast by Application (2024-2029) & (US$/Unit)
- Table 44. North America Fluorescein Sodium Ophthalmic Strip Sales by Type (2018-2023) & (K Units)
- Table 45. North America Fluorescein Sodium Ophthalmic Strip Sales by Type (2024-2029) & (K Units)
- Table 46. North America Fluorescein Sodium Ophthalmic Strip Revenue by Type (2018-2023) & (US$ Million)
- Table 47. North America Fluorescein Sodium Ophthalmic Strip Revenue by Type (2024-2029) & (US$ Million)
- Table 48. North America Fluorescein Sodium Ophthalmic Strip Sales by Application (2018-2023) & (K Units)
- Table 49. North America Fluorescein Sodium Ophthalmic Strip Sales by Application (2024-2029) & (K Units)
- Table 50. North America Fluorescein Sodium Ophthalmic Strip Revenue by Application (2018-2023) & (US$ Million)
- Table 51. North America Fluorescein Sodium Ophthalmic Strip Revenue by Application (2024-2029) & (US$ Million)
- Table 52. North America Fluorescein Sodium Ophthalmic Strip Revenue Grow Rate (CAGR) by Country: 2018 VS 2023 VS 2029 (US$ Million)
- Table 53. North America Fluorescein Sodium Ophthalmic Strip Revenue by Country (2018-2023) & (US$ Million)
- Table 54. North America Fluorescein Sodium Ophthalmic Strip Revenue by Country (2024-2029) & (US$ Million)
- Table 55. North America Fluorescein Sodium Ophthalmic Strip Sales by Country (2018-2023) & (K Units)
- Table 56. North America Fluorescein Sodium Ophthalmic Strip Sales by Country (2024-2029) & (K Units)
- Table 57. Europe Fluorescein Sodium Ophthalmic Strip Sales by Type (2018-2023) & (K Units)
- Table 58. Europe Fluorescein Sodium Ophthalmic Strip Sales by Type (2024-2029) & (K Units)
- Table 59. Europe Fluorescein Sodium Ophthalmic Strip Revenue by Type (2018-2023) & (US$ Million)
- Table 60. Europe Fluorescein Sodium Ophthalmic Strip Revenue by Type (2024-2029) & (US$ Million)
- Table 61. Europe Fluorescein Sodium Ophthalmic Strip Sales by Application (2018-2023) & (K Units)
- Table 62. Europe Fluorescein Sodium Ophthalmic Strip Sales by Application (2024-2029) & (K Units)
- Table 63. Europe Fluorescein Sodium Ophthalmic Strip Revenue by Application (2018-2023) & (US$ Million)
- Table 64. Europe Fluorescein Sodium Ophthalmic Strip Revenue by Application (2024-2029) & (US$ Million)
- Table 65. Europe Fluorescein Sodium Ophthalmic Strip Revenue Grow Rate (CAGR) by Country: 2018 VS 2023 VS 2029 (US$ Million)
- Table 66. Europe Fluorescein Sodium Ophthalmic Strip Revenue by Country (2018-2023) & (US$ Million)
- Table 67. Europe Fluorescein Sodium Ophthalmic Strip Revenue by Country (2024-2029) & (US$ Million)
- Table 68. Europe Fluorescein Sodium Ophthalmic Strip Sales by Country (2018-2023) & (K Units)
- Table 69. Europe Fluorescein Sodium Ophthalmic Strip Sales by Country (2024-2029) & (K Units)
- Table 70. Asia-Pacific Fluorescein Sodium Ophthalmic Strip Sales by Type (2018-2023) & (K Units)
- Table 71. Asia-Pacific Fluorescein Sodium Ophthalmic Strip Sales by Type (2024-2029) & (K Units)
- Table 72. Asia-Pacific Fluorescein Sodium Ophthalmic Strip Revenue by Type (2018-2023) & (US$ Million)
- Table 73. Asia-Pacific Fluorescein Sodium Ophthalmic Strip Revenue by Type (2024-2029) & (US$ Million)
- Table 74. Asia-Pacific Fluorescein Sodium Ophthalmic Strip Sales by Application (2018-2023) & (K Units)
- Table 75. Asia-Pacific Fluorescein Sodium Ophthalmic Strip Sales by Application (2024-2029) & (K Units)
- Table 76. Asia-Pacific Fluorescein Sodium Ophthalmic Strip Revenue by Application (2018-2023) & (US$ Million)
- Table 77. Asia-Pacific Fluorescein Sodium Ophthalmic Strip Revenue by Application (2024-2029) & (US$ Million)
- Table 78. Asia-Pacific Fluorescein Sodium Ophthalmic Strip Revenue Grow Rate (CAGR) by Region: 2018 VS 2023 VS 2029 (US$ Million)
- Table 79. Asia-Pacific Fluorescein Sodium Ophthalmic Strip Revenue by Region (2018-2023) & (US$ Million)
- Table 80. Asia-Pacific Fluorescein Sodium Ophthalmic Strip Revenue by Region (2024-2029) & (US$ Million)
- Table 81. Asia-Pacific Fluorescein Sodium Ophthalmic Strip Sales by Region (2018-2023) & (K Units)
- Table 82. Asia-Pacific Fluorescein Sodium Ophthalmic Strip Sales by Region (2024-2029) & (K Units)
- Table 83. Latin America Fluorescein Sodium Ophthalmic Strip Sales by Type (2018-2023) & (K Units)
- Table 84. Latin America Fluorescein Sodium Ophthalmic Strip Sales by Type (2024-2029) & (K Units)
- Table 85. Latin America Fluorescein Sodium Ophthalmic Strip Revenue by Type (2018-2023) & (US$ Million)
- Table 86. Latin America Fluorescein Sodium Ophthalmic Strip Revenue by Type (2024-2029) & (US$ Million)
- Table 87. Latin America Fluorescein Sodium Ophthalmic Strip Sales by Application (2018-2023) & (K Units)
- Table 88. Latin America Fluorescein Sodium Ophthalmic Strip Sales by Application (2024-2029) & (K Units)
- Table 89. Latin America Fluorescein Sodium Ophthalmic Strip Revenue by Application (2018-2023) & (US$ Million)
- Table 90. Latin America Fluorescein Sodium Ophthalmic Strip Revenue by Application (2024-2029) & (US$ Million)
- Table 91. Latin America Fluorescein Sodium Ophthalmic Strip Revenue Grow Rate (CAGR) by Country: 2018 VS 2023 VS 2029 (US$ Million)
- Table 92. Latin America Fluorescein Sodium Ophthalmic Strip Revenue by Country (2018-2023) & (US$ Million)
- Table 93. Latin America Fluorescein Sodium Ophthalmic Strip Revenue by Country (2024-2029) & (US$ Million)
- Table 94. Latin America Fluorescein Sodium Ophthalmic Strip Sales by Country (2018-2023) & (K Units)
- Table 95. Latin America Fluorescein Sodium Ophthalmic Strip Sales by Country (2024-2029) & (K Units)
- Table 96. Middle East and Africa Fluorescein Sodium Ophthalmic Strip Sales by Type (2018-2023) & (K Units)
- Table 97. Middle East and Africa Fluorescein Sodium Ophthalmic Strip Sales by Type (2024-2029) & (K Units)
- Table 98. Middle East and Africa Fluorescein Sodium Ophthalmic Strip Revenue by Type (2018-2023) & (US$ Million)
- Table 99. Middle East and Africa Fluorescein Sodium Ophthalmic Strip Revenue by Type (2024-2029) & (US$ Million)
- Table 100. Middle East and Africa Fluorescein Sodium Ophthalmic Strip Sales by Application (2018-2023) & (K Units)
- Table 101. Middle East and Africa Fluorescein Sodium Ophthalmic Strip Sales by Application (2024-2029) & (K Units)
- Table 102. Middle East and Africa Fluorescein Sodium Ophthalmic Strip Revenue by Application (2018-2023) & (US$ Million)
- Table 103. Middle East and Africa Fluorescein Sodium Ophthalmic Strip Revenue by Application (2024-2029) & (US$ Million)
- Table 104. Middle East and Africa Fluorescein Sodium Ophthalmic Strip Revenue Grow Rate (CAGR) by Country: 2018 VS 2023 VS 2029 (US$ Million)
- Table 105. Middle East and Africa Fluorescein Sodium Ophthalmic Strip Revenue by Country (2018-2023) & (US$ Million)
- Table 106. Middle East and Africa Fluorescein Sodium Ophthalmic Strip Revenue by Country (2024-2029) & (US$ Million)
- Table 107. Middle East and Africa Fluorescein Sodium Ophthalmic Strip Sales by Country (2018-2023) & (K Units)
- Table 108. Middle East and Africa Fluorescein Sodium Ophthalmic Strip Sales by Country (2024-2029) & (K Units)
- Table 109. Biotech Vision Care Pvt. Ltd. Company Information
- Table 110. Biotech Vision Care Pvt. Ltd. Description and Major Businesses
- Table 111. Biotech Vision Care Pvt. Ltd. Fluorescein Sodium Ophthalmic Strip Sales (K Units), Revenue (US$ Million), Price (US$/Unit) and Gross Margin (2018-2023)
- Table 112. Biotech Vision Care Pvt. Ltd. Fluorescein Sodium Ophthalmic Strip Product Model Numbers, Pictures, Descriptions and Specifications
- Table 113. Madhu Instruments Pvt. Ltd. Company Information
- Table 114. Madhu Instruments Pvt. Ltd. Description and Major Businesses
- Table 115. Madhu Instruments Pvt. Ltd. Fluorescein Sodium Ophthalmic Strip Sales (K Units), Revenue (US$ Million), Price (US$/Unit) and Gross Margin (2018-2023)
- Table 116. Madhu Instruments Pvt. Ltd. Fluorescein Sodium Ophthalmic Strip Product Model Numbers, Pictures, Descriptions and Specifications
- Table 117. Care Group Sight Solution Company Information
- Table 118. Care Group Sight Solution Description and Major Businesses
- Table 119. Care Group Sight Solution Fluorescein Sodium Ophthalmic Strip Sales (K Units), Revenue (US$ Million), Price (US$/Unit) and Gross Margin (2018-2023)
- Table 120. Care Group Sight Solution Fluorescein Sodium Ophthalmic Strip Product Model Numbers, Pictures, Descriptions and Specifications
- Table 121. DIOPTIC Pharmaceuticals Inc. Company Information
- Table 122. DIOPTIC Pharmaceuticals Inc. Description and Major Businesses
- Table 123. DIOPTIC Pharmaceuticals Inc. Fluorescein Sodium Ophthalmic Strip Sales (K Units), Revenue (US$ Million), Price (US$/Unit) and Gross Margin (2018-2023)
- Table 124. DIOPTIC Pharmaceuticals Inc. Fluorescein Sodium Ophthalmic Strip Product Model Numbers, Pictures, Descriptions and Specifications
- Table 125. Amcon Labs Company Information
- Table 126. Amcon Labs Description and Major Businesses
- Table 127. Amcon Labs Fluorescein Sodium Ophthalmic Strip Sales (K Units), Revenue (US$ Million), Price (US$/Unit) and Gross Margin (2018-2023)
- Table 128. Amcon Labs Fluorescein Sodium Ophthalmic Strip Product Model Numbers, Pictures, Descriptions and Specifications
- Table 129. Tianjin Jingming Electronic Materials Co Company Information
- Table 130. Tianjin Jingming Electronic Materials Co Description and Major Businesses
- Table 131. Tianjin Jingming Electronic Materials Co Fluorescein Sodium Ophthalmic Strip Sales (K Units), Revenue (US$ Million), Price (US$/Unit) and Gross Margin (2018-2023)
- Table 132. Tianjin Jingming Electronic Materials Co Fluorescein Sodium Ophthalmic Strip Product Model Numbers, Pictures, Descriptions and Specifications
- Table 133. Ophtechnics Unlimited Company Information
- Table 134. Ophtechnics Unlimited Description and Major Businesses
- Table 135. Ophtechnics Unlimited Fluorescein Sodium Ophthalmic Strip Sales (K Units), Revenue (US$ Million), Price (US$/Unit) and Gross Margin (2018-2023)
- Table 136. Ophtechnics Unlimited Fluorescein Sodium Ophthalmic Strip Product Model Numbers, Pictures, Descriptions and Specifications
- Table 137. Liaoning Meizilin Company Information
- Table 138. Liaoning Meizilin Description and Major Businesses
- Table 139. Liaoning Meizilin Fluorescein Sodium Ophthalmic Strip Sales (K Units), Revenue (US$ Million), Price (US$/Unit) and Gross Margin (2018-2023)
- Table 140. Liaoning Meizilin Fluorescein Sodium Ophthalmic Strip Product Model Numbers, Pictures, Descriptions and Specifications
- Table 141. Entod Research Cell UK Ltd Company Information
- Table 142. Entod Research Cell UK Ltd Description and Major Businesses
- Table 143. Entod Research Cell UK Ltd Fluorescein Sodium Ophthalmic Strip Sales (K Units), Revenue (US$ Million), Price (US$/Unit) and Gross Margin (2018-2023)
- Table 144. Entod Research Cell UK Ltd Fluorescein Sodium Ophthalmic Strip Product Model Numbers, Pictures, Descriptions and Specifications
- Table 145. Sidapharm Company Information
- Table 146. Sidapharm Description and Major Businesses
- Table 147. Sidapharm Fluorescein Sodium Ophthalmic Strip Sales (K Units), Revenue (US$ Million), Price (US$/Unit) and Gross Margin (2018-2023)
- Table 148. Sidapharm Fluorescein Sodium Ophthalmic Strip Product Model Numbers, Pictures, Descriptions and Specifications
- Table 149. AIESI Hospital Service Company Information
- Table 150. AIESI Hospital Service Description and Major Businesses
- Table 151. AIESI Hospital Service Fluorescein Sodium Ophthalmic Strip Sales (K Units), Revenue (US$ Million), Price (US$/Unit) and Gross Margin (2018-2023)
- Table 152. AIESI Hospital Service Fluorescein Sodium Ophthalmic Strip Product Model Numbers, Pictures, Descriptions and Specifications
- Table 153. Optitech Eye Care Company Information
- Table 154. Optitech Eye Care Description and Major Businesses
- Table 155. Optitech Eye Care Fluorescein Sodium Ophthalmic Strip Sales (K Units), Revenue (US$ Million), Price (US$/Unit) and Gross Margin (2018-2023)
- Table 156. Optitech Eye Care Fluorescein Sodium Ophthalmic Strip Product Model Numbers, Pictures, Descriptions and Specifications
- Table 157. Key Raw Materials Lists
- Table 158. Raw Materials Key Suppliers Lists
- Table 159. Fluorescein Sodium Ophthalmic Strip Distributors List
- Table 160. Fluorescein Sodium Ophthalmic Strip Customers List
- Table 161. Fluorescein Sodium Ophthalmic Strip Market Trends
- Table 162. Fluorescein Sodium Ophthalmic Strip Market Drivers
- Table 163. Fluorescein Sodium Ophthalmic Strip Market Challenges
- Table 164. Research Programs/Design for This Report
- Table 165. Key Data Information from Secondary Sources
- Table 166. Key Data Information from Primary Sources
- Table 167. QYR Business Unit and Senior & Team Lead Analysts
List of Figures
- Figure 1. Fluorescein Sodium Ophthalmic Strip Product Picture
- Figure 2. Global Fluorescein Sodium Ophthalmic Strip Market Size Growth Rate by Type, 2018 - 2029 (US$ Million)
- Figure 3. Global Fluorescein Sodium Ophthalmic Strip Market Share by Type: 2022 & 2029
- Figure 4. 1 mg Product Picture
- Figure 5. Major Manufacturers of 1 mg
- Figure 6. Other (0.5 mg, 0.6 mg) Product Picture
- Figure 7. Global Fluorescein Sodium Ophthalmic Strip Market Size Growth Rate by Application, 2018 - 2029 (US$ Million)
- Figure 8. Global Fluorescein Sodium Ophthalmic Strip Market Share by Application: 2022 & 2029
- Figure 9. Hospital
- Figure 10. Clinic
- Figure 11. Optometry Center
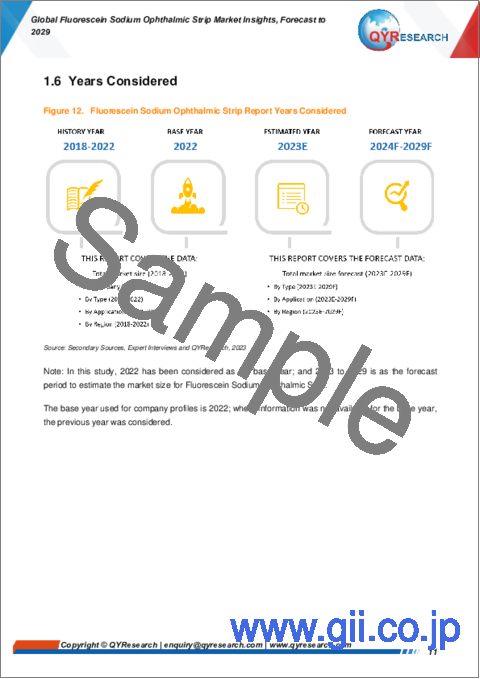
- Figure 12. Fluorescein Sodium Ophthalmic Strip Report Years Considered
- Figure 13. Global Fluorescein Sodium Ophthalmic Strip Revenue, (US$ Million), 2018 VS 2023 VS 2029
- Figure 14. Global Fluorescein Sodium Ophthalmic Strip Revenue 2018-2029 (US$ Million)
- Figure 15. Global Fluorescein Sodium Ophthalmic Strip Revenue Market Share by Region in Percentage: 2022 Versus 2029
- Figure 16. Global Fluorescein Sodium Ophthalmic Strip Revenue Market Share by Region (2018-2029)
- Figure 17. Global Fluorescein Sodium Ophthalmic Strip Sales 2018-2029 (K Units)
- Figure 18. Global Fluorescein Sodium Ophthalmic Strip Sales Market Share by Region (2018-2029)
- Figure 19. North America Fluorescein Sodium Ophthalmic Strip Sales YoY (2018-2029) & (K Units)
- Figure 20. North America Fluorescein Sodium Ophthalmic Strip Revenue YoY (2018-2029) & (US$ Million)
- Figure 21. Europe Fluorescein Sodium Ophthalmic Strip Sales YoY (2018-2029) & (K Units)
- Figure 22. Europe Fluorescein Sodium Ophthalmic Strip Revenue YoY (2018-2029) & (US$ Million)
- Figure 23. Asia-Pacific Fluorescein Sodium Ophthalmic Strip Sales YoY (2018-2029) & (K Units)
- Figure 24. Asia-Pacific Fluorescein Sodium Ophthalmic Strip Revenue YoY (2018-2029) & (US$ Million)
- Figure 25. Latin America Fluorescein Sodium Ophthalmic Strip Sales YoY (2018-2029) & (K Units)
- Figure 26. Latin America Fluorescein Sodium Ophthalmic Strip Revenue YoY (2018-2029) & (US$ Million)
- Figure 27. Middle East and Africa Fluorescein Sodium Ophthalmic Strip Sales YoY (2018-2029) & (K Units)
- Figure 28. Middle East and Africa Fluorescein Sodium Ophthalmic Strip Revenue YoY (2018-2029) & (US$ Million)
- Figure 29. The Top 5 and 10 Largest Manufacturers of Fluorescein Sodium Ophthalmic Strip in the World: Market Share by Fluorescein Sodium Ophthalmic Strip Revenue in 2022
- Figure 30. Global Fluorescein Sodium Ophthalmic Strip Market Share by Company Type (Tier 1, Tier 2, and Tier 3): 2018 VS 2022
- Figure 31. Global Fluorescein Sodium Ophthalmic Strip Sales Market Share by Type (2018-2029)
- Figure 32. Global Fluorescein Sodium Ophthalmic Strip Revenue Market Share by Type (2018-2029)
- Figure 33. Global Fluorescein Sodium Ophthalmic Strip Sales Market Share by Application (2018-2029)
- Figure 34. Global Fluorescein Sodium Ophthalmic Strip Revenue Market Share by Application (2018-2029)
- Figure 35. North America Fluorescein Sodium Ophthalmic Strip Sales Market Share by Type (2018-2029)
- Figure 36. North America Fluorescein Sodium Ophthalmic Strip Revenue Market Share by Type (2018-2029)
- Figure 37. North America Fluorescein Sodium Ophthalmic Strip Sales Market Share by Application (2018-2029)
- Figure 38. North America Fluorescein Sodium Ophthalmic Strip Revenue Market Share by Application (2018-2029)
- Figure 39. North America Fluorescein Sodium Ophthalmic Strip Revenue Share by Country (2018-2029)
- Figure 40. North America Fluorescein Sodium Ophthalmic Strip Sales Share by Country (2018-2029)
- Figure 41. US Fluorescein Sodium Ophthalmic Strip Revenue (2018-2029) & (US$ Million)
- Figure 42. Canada Fluorescein Sodium Ophthalmic Strip Revenue (2018-2029) & (US$ Million)
- Figure 43. Europe Fluorescein Sodium Ophthalmic Strip Sales Market Share by Type (2018-2029)
- Figure 44. Europe Fluorescein Sodium Ophthalmic Strip Revenue Market Share by Type (2018-2029)
- Figure 45. Europe Fluorescein Sodium Ophthalmic Strip Sales Market Share by Application (2018-2029)
- Figure 46. Europe Fluorescein Sodium Ophthalmic Strip Revenue Market Share by Application (2018-2029)
- Figure 47. Europe Fluorescein Sodium Ophthalmic Strip Revenue Share by Country (2018-2029)
- Figure 48. Europe Fluorescein Sodium Ophthalmic Strip Sales Share by Country (2018-2029)
- Figure 49. Germany Fluorescein Sodium Ophthalmic Strip Revenue (2018-2029) & (US$ Million)
- Figure 50. France Fluorescein Sodium Ophthalmic Strip Revenue (2018-2029) & (US$ Million)
- Figure 51. U.K. Fluorescein Sodium Ophthalmic Strip Revenue (2018-2029) & (US$ Million)
- Figure 52. Italy Fluorescein Sodium Ophthalmic Strip Revenue (2018-2029) & (US$ Million)
- Figure 53. Russia Fluorescein Sodium Ophthalmic Strip Revenue (2018-2029) & (US$ Million)
- Figure 54. Asia-Pacific Fluorescein Sodium Ophthalmic Strip Sales Market Share by Type (2018-2029)
- Figure 55. Asia-Pacific Fluorescein Sodium Ophthalmic Strip Revenue Market Share by Type (2018-2029)
- Figure 56. Asia-Pacific Fluorescein Sodium Ophthalmic Strip Sales Market Share by Application (2018-2029)
- Figure 57. Asia-Pacific Fluorescein Sodium Ophthalmic Strip Revenue Market Share by Application (2018-2029)
- Figure 58. Asia-Pacific Fluorescein Sodium Ophthalmic Strip Revenue Share by Region (2018-2029)
- Figure 59. Asia-Pacific Fluorescein Sodium Ophthalmic Strip Sales Share by Region (2018-2029)
- Figure 60. China Fluorescein Sodium Ophthalmic Strip Revenue (2018-2029) & (US$ Million)
- Figure 61. Japan Fluorescein Sodium Ophthalmic Strip Revenue (2018-2029) & (US$ Million)
- Figure 62. South Korea Fluorescein Sodium Ophthalmic Strip Revenue (2018-2029) & (US$ Million)
- Figure 63. Southeast Asia Fluorescein Sodium Ophthalmic Strip Revenue (2018-2029) & (US$ Million)
- Figure 64. India Fluorescein Sodium Ophthalmic Strip Revenue (2018-2029) & (US$ Million)
- Figure 65. Australia Fluorescein Sodium Ophthalmic Strip Revenue (2018-2029) & (US$ Million)
- Figure 66. Latin America Fluorescein Sodium Ophthalmic Strip Sales Market Share by Type (2018-2029)
- Figure 67. Latin America Fluorescein Sodium Ophthalmic Strip Revenue Market Share by Type (2018-2029)
- Figure 68. Latin America Fluorescein Sodium Ophthalmic Strip Sales Market Share by Application (2018-2029)
- Figure 69. Latin America Fluorescein Sodium Ophthalmic Strip Revenue Market Share by Application (2018-2029)
- Figure 70. Latin America Fluorescein Sodium Ophthalmic Strip Revenue Share by Country (2018-2029)
- Figure 71. Latin America Fluorescein Sodium Ophthalmic Strip Sales Share by Country (2018-2029)
- Figure 72. Mexico Fluorescein Sodium Ophthalmic Strip Revenue (2018-2029) & (US$ Million)
- Figure 73. Brazil Fluorescein Sodium Ophthalmic Strip Revenue (2018-2029) & (US$ Million)
- Figure 74. Middle East and Africa Fluorescein Sodium Ophthalmic Strip Sales Market Share by Type (2018-2029)
- Figure 75. Middle East and Africa Fluorescein Sodium Ophthalmic Strip Revenue Market Share by Type (2018-2029)
- Figure 76. Middle East and Africa Fluorescein Sodium Ophthalmic Strip Sales Market Share by Application (2018-2029)
- Figure 77. Middle East and Africa Fluorescein Sodium Ophthalmic Strip Revenue Market Share by Application (2018-2029)
- Figure 78. Middle East and Africa Fluorescein Sodium Ophthalmic Strip Revenue Share by Country (2018-2029)
- Figure 79. Middle East and Africa Fluorescein Sodium Ophthalmic Strip Sales Share by Country (2018-2029)
- Figure 80. Middle East Fluorescein Sodium Ophthalmic Strip Revenue (2018-2029) & (US$ Million)
- Figure 81. Africa Fluorescein Sodium Ophthalmic Strip Revenue (2018-2029) & (US$ Million)
- Figure 82. Fluorescein Sodium Ophthalmic Strip Value Chain
- Figure 83. Distributors Profiles
- Figure 84. Bottom-up and Top-down Approaches for This Report
- Figure 85. Data Triangulation
- Figure 86. Key Executives Interviewed
The global Fluorescein Sodium Ophthalmic Strip market is projected to grow from US$ 23.79 million in 2023 to US$ 33.66 million by 2029, at a Compound Annual Growth Rate (CAGR) of 5.95% during the forecast period.
The representative players in global Fluorescein Sodium Ophthalmic Strip market are: Biotech Healthcare Group, Madhu Instruments Pvt. Ltd., Care Group Sight Solution, DIOPTIC Pharmaceuticals Inc and Amcon Labs, etc. In 2022, the world's top five vendors accounted for approximately 67.26% of the revenue.
Report Includes:
This report presents an overview of global market for Fluorescein Sodium Ophthalmic Strip, sales, revenue and price. Analyses of the global market trends, with historic market revenue/sales data for 2018 - 2022, estimates for 2023, and projections of CAGR through 2029.
This report researches the key producers of Fluorescein Sodium Ophthalmic Strip, also provides the sales of main regions and countries. Highlights of the upcoming market potential for Fluorescein Sodium Ophthalmic Strip, and key regions/countries of focus to forecast this market into various segments and sub-segments. Country specific data and market value analysis for the U.S., Canada, Mexico, Brazil, China, Japan, South Korea, Southeast Asia, India, Germany, the U.K., Italy, Middle East, Africa, and Other Countries.
This report focuses on the Fluorescein Sodium Ophthalmic Strip sales, revenue, market share and industry ranking of main manufacturers, data from 2018 to 2023. Identification of the major stakeholders in the global Fluorescein Sodium Ophthalmic Strip market, and analysis of their competitive landscape and market positioning based on recent developments and segmental revenues. This report will help stakeholders to understand the competitive landscape and gain more insights and position their businesses and market strategies in a better way.
This report analyzes the segments data by Type, and by Application, sales, revenue, and price, from 2018 to 2029. Evaluation and forecast the market size for Fluorescein Sodium Ophthalmic Strip sales, projected growth trends, production technology, application and end-user industry.
Descriptive company profiles of the major global players, including Madhu Instruments Pvt. Ltd., Amcon Labs, Biotech Vision Care Pvt. Ltd., Liaoning Meizilin, Optitech Eye Care, Ophtechnics Unlimited, Entod Research Cell UK Ltd, Care Group Sight Solution, and DIOPTIC Pharmaceuticals Inc., etc.
By Company
- Biotech Healthcare Group
- Madhu Instruments Pvt. Ltd.
- Care Group Sight Solution
- DIOPTIC Pharmaceuticals Inc
- Amcon Labs
- Tianjin Jingming Electronic Materials Co
- Ophtechnics Unlimited
- Liaoning Meizilin
- Entod Research Cell UK Ltd
- Sidapharm
- AIESI Hospital Service
- Optitech Eye Care
Segment by Type
- 1 mg
- Other (0.5 mg, 0.6 mg)
Segment by Application
- Hospital
- Clinic
- Optometry Center
Segment by Region
- North America
- U.S.
- Canada
- Asia-Pacific
- China
- Japan
- South Korea
- Southeast Asia
- India
- Australia
- Europe
- Germany
- France
- U.K.
- Italy
- Russia
- Latin America
- Mexico
- Brazil
- Middle East & Africa
- Middle East
- Africa
Chapter Outline
Chapter 1: Introduces the report scope of the report, executive summary of different market segments (by Type, and by Application, etc), including the market size of each market segment, future development potential, and so on. It offers a high-level view of the current state of the market and its likely evolution in the short to mid-term, and long term.
Chapter 2: Sales (consumption), revenue of Fluorescein Sodium Ophthalmic Strip in global, regional level and country level. It provides a quantitative analysis of the market size and development potential of each region and its main countries and introduces the market development, future development prospects, market space, and capacity of each country in the world.
Chapter 3: Detailed analysis of Fluorescein Sodium Ophthalmic Strip manufacturers competitive landscape, price, sales, revenue, market share and industry ranking, latest development plan, merger, and acquisition information, etc.
Chapter 4: Provides the analysis of various market segments by Type, covering the sales, revenue, average price, and development potential of each market segment, to help readers find the blue ocean market in different market segments.
Chapter 5: Provides the analysis of various market segments by Application, covering the sales, revenue, average price, and development potential of each market segment, to help readers find the blue ocean market in different downstream markets.
Chapter 6: North America (North America) by Type, by Application and by country, sales, and revenue for each segment.
Chapter 7: Europe by Type, by Application and by country, sales, and revenue for each segment.
Chapter 8: Asia-Pacific by Type, and by Application, sales, and revenue for each segment.
Chapter 9: Latin America by Type, by Application and by region, sales, and revenue for each segment.
Chapter 10: Middle East, Africa by Type, by Application and by country, sales, and revenue for each segment.
Chapter 11: Provides profiles of key manufacturers, introducing the basic situation of the main companies in the market in detail, including product descriptions and specifications, Fluorescein Sodium Ophthalmic Strip sales, revenue, price, gross margin, and recent development, etc.
Chapter 12: Analysis of industrial chain, sales channel, key raw materials, distributors and customers.
Chapter 13: Introduces the market dynamics, latest developments of the market, the driving factors and restrictive factors of the market, the challenges and risks faced by manufacturers in the industry, and the analysis of relevant policies in the industry.
Chapter 14: The main points and conclusions of the report.
TABLE OF CONTENTS
1 STUDY COVERAGE
- 1.1 Fluorescein Sodium Ophthalmic Strip Product Introduction
- 1.2 Market by Type
- 1.2.1 Global Fluorescein Sodium Ophthalmic Strip Market Size Growth Rate by Type, 2018 VS 2023 VS 2029
- 1.2.2 1 mg
- 1.2.3 Other (0.5 mg, 0.6 mg)
- 1.3 Market by Application
- 1.3.1 Global Fluorescein Sodium Ophthalmic Strip Market Size Growth Rate by Application, 2018 VS 2023 VS 2029
- 1.3.2 Hospital
- 1.3.3 Clinic
- 1.3.4 Optometry Center
- 1.4 Assumptions and Limitations
- 1.5 Study Objectives
- 1.6 Years Considered
2 EXECUTIVE SUMMARY
- 2.1 Global Fluorescein Sodium Ophthalmic Strip Revenue Estimates and Forecasts 2018-2029
- 2.2 Global Fluorescein Sodium Ophthalmic Strip Revenue by Region
- 2.2.1 Global Fluorescein Sodium Ophthalmic Strip Revenue by Region: 2018 VS 2023 VS 2029
- 2.2.2 Global Fluorescein Sodium Ophthalmic Strip Revenue by Region (2018-2023)
- 2.2.3 Global Fluorescein Sodium Ophthalmic Strip Revenue by Region (2024-2029)
- 2.2.4 Global Fluorescein Sodium Ophthalmic Strip Revenue Market Share by Region (2018-2029)
- 2.3 Global Fluorescein Sodium Ophthalmic Strip Sales Estimates and Forecasts 2018-2029
- 2.4 Global Fluorescein Sodium Ophthalmic Strip Sales by Region
- 2.4.1 Global Fluorescein Sodium Ophthalmic Strip Sales by Region: 2018 VS 2023 VS 2029
- 2.4.2 Global Fluorescein Sodium Ophthalmic Strip Sales by Region (2018-2023)
- 2.4.3 Global Fluorescein Sodium Ophthalmic Strip Sales by Region (2024-2029)
- 2.4.4 Global Fluorescein Sodium Ophthalmic Strip Sales Market Share by Region (2018-2029)
- 2.5 North America
- 2.6 Europe
- 2.7 Asia-Pacific
- 2.8 Latin America
- 2.9 Middle East and Africa
3 COMPETITION BY MANUFACTURERS
- 3.1 Global Fluorescein Sodium Ophthalmic Strip Sales by Manufacturers
- 3.1.1 Global Fluorescein Sodium Ophthalmic Strip Sales by Manufacturers (2018-2023)
- 3.1.2 Global Fluorescein Sodium Ophthalmic Strip Sales Market Share by Manufacturers (2018-2023)
- 3.2 Global Fluorescein Sodium Ophthalmic Strip Revenue by Manufacturers
- 3.2.1 Global Fluorescein Sodium Ophthalmic Strip Revenue by Manufacturers (2018-2023)
- 3.2.2 Global Fluorescein Sodium Ophthalmic Strip Revenue Market Share by Manufacturers (2018-2023)
- 3.2.3 Global Top 10 and Top 5 Companies by Fluorescein Sodium Ophthalmic Strip Revenue in 2022
- 3.3 Global Key Players of Fluorescein Sodium Ophthalmic Strip, Industry Ranking, 2021 VS 2022
- 3.4 Global Fluorescein Sodium Ophthalmic Strip Sales Price by Manufacturers (2018-2023)
- 3.5 Analysis of Competitive Landscape
- 3.5.1 Manufacturers Market Concentration Ratio (CR5 and HHI)
- 3.5.2 Global Fluorescein Sodium Ophthalmic Strip Market Share by Company Type (Tier 1, Tier 2, and Tier 3)
- 3.6 Global Key Manufacturers of Fluorescein Sodium Ophthalmic Strip, Manufacturing Base Distribution and Headquarters
- 3.7 Global Key Manufacturers of Fluorescein Sodium Ophthalmic Strip, Product Offered and Application
4 MARKET SIZE BY TYPE
- 4.1 Global Fluorescein Sodium Ophthalmic Strip Sales by Type
- 4.1.1 Global Fluorescein Sodium Ophthalmic Strip Historical Sales by Type (2018-2023)
- 4.1.2 Global Fluorescein Sodium Ophthalmic Strip Forecasted Sales by Type (2024-2029)
- 4.1.3 Global Fluorescein Sodium Ophthalmic Strip Sales Market Share by Type (2018-2029)
- 4.2 Global Fluorescein Sodium Ophthalmic Strip Revenue by Type
- 4.2.1 Global Fluorescein Sodium Ophthalmic Strip Historical Revenue by Type (2018-2023)
- 4.2.2 Global Fluorescein Sodium Ophthalmic Strip Forecasted Revenue by Type (2024-2029)
- 4.2.3 Global Fluorescein Sodium Ophthalmic Strip Revenue Market Share by Type (2018-2029)
- 4.3 Global Fluorescein Sodium Ophthalmic Strip Price by Type
- 4.3.1 Global Fluorescein Sodium Ophthalmic Strip Price by Type (2018-2023)
- 4.3.2 Global Fluorescein Sodium Ophthalmic Strip Price Forecast by Type (2024-2029)
5 MARKET SIZE BY APPLICATION
- 5.1 Global Fluorescein Sodium Ophthalmic Strip Sales by Application
- 5.1.1 Global Fluorescein Sodium Ophthalmic Strip Historical Sales by Application (2018-2023)
- 5.1.2 Global Fluorescein Sodium Ophthalmic Strip Forecasted Sales by Application (2024-2029)
- 5.1.3 Global Fluorescein Sodium Ophthalmic Strip Sales Market Share by Application (2018-2029)
- 5.2 Global Fluorescein Sodium Ophthalmic Strip Revenue by Application
- 5.2.1 Global Fluorescein Sodium Ophthalmic Strip Historical Revenue by Application (2018-2023)
- 5.2.2 Global Fluorescein Sodium Ophthalmic Strip Forecasted Revenue by Application (2024-2029)
- 5.2.3 Global Fluorescein Sodium Ophthalmic Strip Revenue Market Share by Application (2018-2029)
- 5.3 Global Fluorescein Sodium Ophthalmic Strip Price by Application
- 5.3.1 Global Fluorescein Sodium Ophthalmic Strip Price by Application (2018-2023)
- 5.3.2 Global Fluorescein Sodium Ophthalmic Strip Price Forecast by Application (2024-2029)
6 NORTH AMERICA
- 6.1 North America Fluorescein Sodium Ophthalmic Strip Market Size by Type
- 6.1.1 North America Fluorescein Sodium Ophthalmic Strip Sales by Type (2018-2029)
- 6.1.2 North America Fluorescein Sodium Ophthalmic Strip Revenue by Type (2018-2029)
- 6.2 North America Fluorescein Sodium Ophthalmic Strip Market Size by Application
- 6.2.1 North America Fluorescein Sodium Ophthalmic Strip Sales by Application (2018-2029)
- 6.2.2 North America Fluorescein Sodium Ophthalmic Strip Revenue by Application (2018-2029)
- 6.3 North America Fluorescein Sodium Ophthalmic Strip Market Size by Country
- 6.3.1 North America Fluorescein Sodium Ophthalmic Strip Revenue by Country: 2018 VS 2023 VS 2029
- 6.3.2 North America Fluorescein Sodium Ophthalmic Strip Revenue by Country (2018-2029)
- 6.3.3 North America Fluorescein Sodium Ophthalmic Strip Sales by Country (2018-2029)
- 6.3.4 US
- 6.3.5 Canada
7 EUROPE
- 7.1 Europe Fluorescein Sodium Ophthalmic Strip Market Size by Type
- 7.1.1 Europe Fluorescein Sodium Ophthalmic Strip Sales by Type (2018-2029)
- 7.1.2 Europe Fluorescein Sodium Ophthalmic Strip Revenue by Type (2018-2029)
- 7.2 Europe Fluorescein Sodium Ophthalmic Strip Market Size by Application
- 7.2.1 Europe Fluorescein Sodium Ophthalmic Strip Sales by Application (2018-2029)
- 7.2.2 Europe Fluorescein Sodium Ophthalmic Strip Revenue by Application (2018-2029)
- 7.3 Europe Fluorescein Sodium Ophthalmic Strip Market Size by Country
- 7.3.1 Europe Fluorescein Sodium Ophthalmic Strip Revenue by Country: 2018 VS 2023 VS 2029
- 7.3.2 Europe Fluorescein Sodium Ophthalmic Strip Revenue by Country (2018-2029)
- 7.3.3 Europe Fluorescein Sodium Ophthalmic Strip Sales by Country (2018-2029)
- 7.3.4 Germany
- 7.3.5 France
- 7.3.6 U.K.
- 7.3.7 Italy
- 7.3.8 Russia
8 ASIA-PACIFIC
- 8.1 Asia-Pacific Fluorescein Sodium Ophthalmic Strip Market Size by Type
- 8.1.1 Asia-Pacific Fluorescein Sodium Ophthalmic Strip Sales by Type (2018-2029)
- 8.1.2 Asia-Pacific Fluorescein Sodium Ophthalmic Strip Revenue by Type (2018-2029)
- 8.2 Asia-Pacific Fluorescein Sodium Ophthalmic Strip Market Size by Application
- 8.2.1 Asia-Pacific Fluorescein Sodium Ophthalmic Strip Sales by Application (2018-2029)
- 8.2.2 Asia-Pacific Fluorescein Sodium Ophthalmic Strip Revenue by Application (2018-2029)
- 8.3 Asia-Pacific Fluorescein Sodium Ophthalmic Strip Market Size by Region
- 8.3.1 Asia-Pacific Fluorescein Sodium Ophthalmic Strip Revenue by Region: 2018 VS 2023 VS 2029
- 8.3.2 Asia-Pacific Fluorescein Sodium Ophthalmic Strip Revenue by Region (2018-2029)
- 8.3.3 Asia-Pacific Fluorescein Sodium Ophthalmic Strip Sales by Region (2018-2029)
- 8.3.4 China
- 8.3.5 Japan
- 8.3.6 South Korea
- 8.3.7 Southeast Asia
- 8.3.8 India
- 8.3.9 Australia
9 LATIN AMERICA
- 9.1 Latin America Fluorescein Sodium Ophthalmic Strip Market Size by Type
- 9.1.1 Latin America Fluorescein Sodium Ophthalmic Strip Sales by Type (2018-2029)
- 9.1.2 Latin America Fluorescein Sodium Ophthalmic Strip Revenue by Type (2018-2029)
- 9.2 Latin America Fluorescein Sodium Ophthalmic Strip Market Size by Application
- 9.2.1 Latin America Fluorescein Sodium Ophthalmic Strip Sales by Application (2018-2029)
- 9.2.2 Latin America Fluorescein Sodium Ophthalmic Strip Revenue by Application (2018-2029)
- 9.3 Latin America Fluorescein Sodium Ophthalmic Strip Market Size by Country
- 9.3.1 Latin America Fluorescein Sodium Ophthalmic Strip Revenue by Country: 2018 VS 2023 VS 2029
- 9.3.2 Latin America Fluorescein Sodium Ophthalmic Strip Revenue by Country (2018-2029)
- 9.3.3 Latin America Fluorescein Sodium Ophthalmic Strip Sales by Country (2018-2029)
- 9.3.4 Mexico
- 9.3.5 Brazil
10 MIDDLE EAST AND AFRICA
- 10.1 Middle East and Africa Fluorescein Sodium Ophthalmic Strip Market Size by Type
- 10.1.1 Middle East and Africa Fluorescein Sodium Ophthalmic Strip Sales by Type (2018-2029)
- 10.1.2 Middle East and Africa Fluorescein Sodium Ophthalmic Strip Revenue by Type (2018-2029)
- 10.2 Middle East and Africa Fluorescein Sodium Ophthalmic Strip Market Size by Application
- 10.2.1 Middle East and Africa Fluorescein Sodium Ophthalmic Strip Sales by Application (2018-2029)
- 10.2.2 Middle East and Africa Fluorescein Sodium Ophthalmic Strip Revenue by Application (2018-2029)
- 10.3 Middle East and Africa Fluorescein Sodium Ophthalmic Strip Market Size by Country
- 10.3.1 Middle East and Africa Fluorescein Sodium Ophthalmic Strip Revenue by Country: 2018 VS 2023 VS 2029
- 10.3.2 Middle East and Africa Fluorescein Sodium Ophthalmic Strip Revenue by Country (2018-2029)
- 10.3.3 Middle East and Africa Fluorescein Sodium Ophthalmic Strip Sales by Country (2018-2029)
- 10.3.4 Middle East
- 10.3.5 Africa
11 CORPORATE PROFILE
- 11.1 Biotech Vision Care Pvt. Ltd.
- 11.1.1 Biotech Vision Care Pvt. Ltd. Company Information
- 11.1.2 Biotech Vision Care Pvt. Ltd. Overview
- 11.1.3 Biotech Vision Care Pvt. Ltd. Fluorescein Sodium Ophthalmic Strip Sales, Price, Revenue and Gross Margin (2018-2023)
- 11.1.4 Biotech Vision Care Pvt. Ltd. Fluorescein Sodium Ophthalmic Strip Product Model Numbers, Pictures, Descriptions and Specifications
- 11.2 Madhu Instruments Pvt. Ltd.
- 11.2.1 Madhu Instruments Pvt. Ltd. Company Information
- 11.2.2 Madhu Instruments Pvt. Ltd. Overview
- 11.2.3 Madhu Instruments Pvt. Ltd. Fluorescein Sodium Ophthalmic Strip Sales, Price, Revenue and Gross Margin (2018-2023)
- 11.2.4 Madhu Instruments Pvt. Ltd. Fluorescein Sodium Ophthalmic Strip Product Model Numbers, Pictures, Descriptions and Specifications
- 11.3 Care Group Sight Solution
- 11.3.1 Care Group Sight Solution Company Information
- 11.3.2 Care Group Sight Solution Overview
- 11.3.3 Care Group Sight Solution Fluorescein Sodium Ophthalmic Strip Sales, Price, Revenue and Gross Margin (2018-2023)
- 11.3.4 Care Group Sight Solution Fluorescein Sodium Ophthalmic Strip Product Model Numbers, Pictures, Descriptions and Specifications
- 11.4 DIOPTIC Pharmaceuticals Inc.
- 11.4.1 DIOPTIC Pharmaceuticals Inc. Company Information
- 11.4.2 DIOPTIC Pharmaceuticals Inc. Overview
- 11.4.3 DIOPTIC Pharmaceuticals Inc. Fluorescein Sodium Ophthalmic Strip Sales, Price, Revenue and Gross Margin (2018-2023)
- 11.4.4 DIOPTIC Pharmaceuticals Inc. Fluorescein Sodium Ophthalmic Strip Product Model Numbers, Pictures, Descriptions and Specifications
- 11.5 Amcon Labs (Nomax Inc)
- 11.5.1 Amcon Labs Company Information
- 11.5.2 Amcon Labs Overview
- 11.5.3 Amcon Labs Fluorescein Sodium Ophthalmic Strip Sales, Price, Revenue and Gross Margin (2018-2023)
- 11.5.4 Amcon Labs Fluorescein Sodium Ophthalmic Strip Product Model Numbers, Pictures, Descriptions and Specifications
- 11.6 Tianjin Jingming Electronic Materials Co
- 11.6.1 Tianjin Jingming Electronic Materials Co Company Information
- 11.6.2 Tianjin Jingming Electronic Materials Co Overview
- 11.6.3 Tianjin Jingming Electronic Materials Co Fluorescein Sodium Ophthalmic Strip Sales, Price, Revenue and Gross Margin (2018-2023)
- 11.6.4 Tianjin Jingming Electronic Materials Co Fluorescein Sodium Ophthalmic Strip Product Model Numbers, Pictures, Descriptions and Specifications
- 11.7 Ophtechnics Unlimited
- 11.7.1 Ophtechnics Unlimited Company Information
- 11.7.2 Ophtechnics Unlimited Overview
- 11.7.3 Ophtechnics Unlimited Fluorescein Sodium Ophthalmic Strip Sales, Price, Revenue and Gross Margin (2018-2023)
- 11.7.4 Ophtechnics Unlimited Fluorescein Sodium Ophthalmic Strip Product Model Numbers, Pictures, Descriptions and Specifications
- 11.8 Liaoning Meizilin
- 11.8.1 Liaoning Meizilin Company Information
- 11.8.2 Liaoning Meizilin Overview
- 11.8.3 Liaoning Meizilin Fluorescein Sodium Ophthalmic Strip Sales, Price, Revenue and Gross Margin (2018-2023)
- 11.8.4 Liaoning Meizilin Fluorescein Sodium Ophthalmic Strip Product Model Numbers, Pictures, Descriptions and Specifications
- 11.9 Entod Research Cell UK Ltd
- 11.9.1 Entod Research Cell UK Ltd Company Information
- 11.9.2 Entod Research Cell UK Ltd Overview
- 11.9.3 Entod Research Cell UK Ltd Fluorescein Sodium Ophthalmic Strip Sales, Price, Revenue and Gross Margin (2018-2023)
- 11.9.4 Entod Research Cell UK Ltd Fluorescein Sodium Ophthalmic Strip Product Model Numbers, Pictures, Descriptions and Specifications
- 11.10 Sidapharm
- 11.10.1 Sidapharm Company Information
- 11.10.2 Sidapharm Overview
- 11.10.3 Sidapharm Fluorescein Sodium Ophthalmic Strip Sales, Price, Revenue and Gross Margin (2018-2023)
- 11.10.4 Sidapharm Fluorescein Sodium Ophthalmic Strip Product Model Numbers, Pictures, Descriptions and Specifications
- 11.11 AIESI Hospital Service
- 11.11.1 AIESI Hospital Service Company Information
- 11.11.2 AIESI Hospital Service Overview
- 11.11.3 AIESI Hospital Service Fluorescein Sodium Ophthalmic Strip Sales, Price, Revenue and Gross Margin (2018-2023)
- 11.11.4 AIESI Hospital Service Fluorescein Sodium Ophthalmic Strip Product Model Numbers, Pictures, Descriptions and Specifications
- 11.12 Optitech Eye Care
- 11.12.1 Optitech Eye Care Company Information
- 11.12.2 Optitech Eye Care Overview
- 11.12.3 Optitech Eye Care Fluorescein Sodium Ophthalmic Strip Sales, Price, Revenue and Gross Margin (2018-2023)
- 11.12.4 Optitech Eye Care Fluorescein Sodium Ophthalmic Strip Product Model Numbers, Pictures, Descriptions and Specifications
12 INDUSTRY CHAIN AND SALES CHANNELS ANALYSIS
- 12.1 Fluorescein Sodium Ophthalmic Strip Industry Chain Analysis
- 12.2 Fluorescein Sodium Ophthalmic Strip Key Raw Materials
- 12.2.1 Key Raw Materials
- 12.2.2 Raw Materials Key Suppliers
- 12.3 Fluorescein Sodium Ophthalmic Strip Sales and Marketing
- 12.3.1 Fluorescein Sodium Ophthalmic Strip Sales Channels
- 12.3.2 Fluorescein Sodium Ophthalmic Strip Distributors
- 12.4 Fluorescein Sodium Ophthalmic Strip Customers
13 FLUORESCEIN SODIUM OPHTHALMIC STRIP MARKET DYNAMICS
- 13.1.1 Fluorescein Sodium Ophthalmic Strip Industry Trends
- 13.1.2 Fluorescein Sodium Ophthalmic Strip Market Drivers
- 13.1.3 Fluorescein Sodium Ophthalmic Strip Market Challenges
14 KEY FINDINGS IN THE GLOBAL FLUORESCEIN SODIUM OPHTHALMIC STRIP STUDY
15 APPENDIX
- 15.1 Research Methodology
- 15.1.1 Methodology/Research Approach
- 15.1.2 Data Source
- 15.2 Author Details
- 15.3 Disclaimer
