|
|
市場調査レポート
商品コード
1370664
世界および北米のスポーツライフル市場:2023-2029年Global and North America Sports Rifle Market Report & Forecast 2023-2029 |
||||||
|
|
|||||||
カスタマイズ可能
適宜更新あり
|
|||||||


| 世界および北米のスポーツライフル市場:2023-2029年 |
|
出版日: 2023年10月30日
発行: QYResearch
ページ情報: 英文 161 Pages
納期: 2~3営業日
|

- 全表示
- 概要
- 図表
- 目次
世界のスポーツライフルの市場規模は、2022年の16億7,490万米ドルから、予測期間中は6.50%のCAGRで推移し、2029年には25億8,917万米ドルの規模となると予測されています。
地域別で見ると、南北アメリカ市場は2022年の11億8567万米ドルから、同期間中6.70%のCAGRで推移し、2029年には18億5617万米ドルの規模になると予測されています。
当レポートでは、世界および北米のスポーツライフルの市場を調査し、市場および製品の概要、競合情勢、市場規模の推移・予測、各種区分・地域/主要国別の詳細分析、価格動向、市場成長への各種影響因子の分析、主要企業の分析などをまとめています。
目次
第1章 調査範囲
- スポーツライフルの製品:イントロダクション
- 世界のスポーツライフルの見通し:2018 vs 2022 vs 2029
- 北米のスポーツライフルの見通し:2018 vs 2022 vs 2029
- 市場規模:北米 vs 世界:2018 vs 2022 vs 2029
- 市場力学
- 産業動向
- 市場促進要因
- 市場課題
- 市場抑制要因
- 前提・制約
- 調査目的
- 調査年数
第2章 スポーツライフル市場:タイプ別
- スポーツライフル市場:タイプ別
- センターファイアボルトアクションライフル
- センターファイア半自動ライフル
- リムファイアボルトアクションライフル
- リムファイア半自動ライフル
- レバーアクションライフル
- 世界市場の規模
- 販売数
- 販売額
- 平均販売価格(ASP)
- 北米市場の規模
- 販売数
- 販売額
- 平均販売価格(ASP)
第3章 スポーツライフル市場:用途別
- スポーツライフル市場:用途別
- 狩猟
- シューティングスポーツ
- その他
- 世界市場の規模
- 販売数
- 販売額
- 平均販売価格(ASP)
- 北米市場の規模
- 販売数
- 販売額
- 平均販売価格(ASP)
- 世界市場の規模:女性ユーザー
第4章 世界のスポーツライフル市場の競合情勢:企業別
- 市場規模:企業別
- 市場集中率(CR)
- 世界の主要製造業者:製造拠点の分布および本社
- 世界の主要製造業者:提供製品
- 世界の主要製造業者:設立日
- M&A・拡張計画
- 北米市場の規模:企業別
第5章 世界のスポーツライフル市場の規模:地域別
- 地域別の市場規模:2018 vs 2022 vs 2029
- 販売数の推移・予測
- 販売額の推移・予測
第6章 南北アメリカ
第7章 欧州・中東・アフリカ
第8章 中国
第9章 アジア太平洋
第10章 企業プロファイル
- Howa Machinery
- J G. Anschutz
- Beretta Holding
- Browning Arms
- Smith &Wesson
- Sturm, Ruger &Co.
- Colt CZ Group
- (Winchester)Olin Corporation
- Sig Sauer
- Henry Repeating Arms
- Bushmaster
- Daniel Defense
- Diamondback Firearms
第11章 産業チェーンと販売チャネルの分析
- 産業チェーン分析
- 主な原材料
- 製造モードとプロセス
- 販売およびマーケティング
- 顧客
第12章 調査結果・総論
第13章 付録
List of Tables
- Table 1. Sports Rifle CAGR in Value, North America VS Global, 2018 VS 2022 VS 2029
- Table 2. Sports Rifle Market Trends
- Table 3. Sports Rifle Market Drivers
- Table 4. Sports Rifle Market Challenges
- Table 5. Sports Rifle Market Restraints
- Table 6. Global Sports Rifle Sales Growth Rate (CAGR) by Type: 2018 VS 2022 VS 2029 (US$ Million)
- Table 7. Global Sports Rifle Price by Type (2018-2023) & (US$/Unit)
- Table 8. Global Sports Rifle Price by Type (2024-2029) & (US$/Unit)
- Table 9. North America Sports Rifle Sales Growth Rate (CAGR) by Type: 2018 VS 2022 VS 2029 (US$ Million)
- Table 10. North America Sports Rifle Price by Type (2018-2023) & (US$/Unit)
- Table 11. North America Sports Rifle Price by Type (2024-2029) & (US$/Unit)
- Table 12. Global Sports Rifle Sales Growth Rate (CAGR) by Application: 2018 VS 2022 VS 2029 (US$ Million)
- Table 13. Global Sports Rifle Price by Application (2018-2023) & (US$/Unit)
- Table 14. Global Sports Rifle Price by Application (2024-2029) & (US$/Unit)
- Table 15. North America Sports Rifle Sales Growth Rate (CAGR) by Application: 2018 VS 2022 VS 2029 (US$ Million)
- Table 16. North America Sports Rifle Price by Application (2018-2023) & (US$/Unit)
- Table 17. North America Sports Rifle Price by Application (2024-2029) & (US$/Unit)
- Table 18. Global Key Manufacturers of Sports Rifle, Ranked by Revenue (2022) & (US$ Million)
- Table 19. Global Sports Rifle Revenue by Manufacturer, (US$ Million) & (2018-2023)
- Table 20. Global Sports Rifle Revenue Share by Manufacturer, 2018-2023
- Table 21. Global Sports Rifle Sales by Manufacturer, (K Units), 2018-2023
- Table 22. Global Sports Rifle Sales Share by Manufacturer, 2018-2023
- Table 23. Global Sports Rifle Price by Manufacturer (2018-2023) & (US$/Unit)
- Table 24. Global Sports Rifle Manufacturers Market Concentration Ratio (CR5)
- Table 25. Global Sports Rifle by Company Type (Tier 1, Tier 2, and Tier 3) & (based on the Revenue in Sports Rifle as of 2022)
- Table 26. Global Key Manufacturers of Sports Rifle, Manufacturing Base Distribution and Headquarters
- Table 27. Global Key Manufacturers of Sports Rifle, Product Offered
- Table 28. Global Key Manufacturers of Sports Rifle, Founded Date
- Table 29. Manufacturers Mergers & Acquisitions, Expansion Plans
- Table 30. Key Players of Sports Rifle in North America, Ranked by Revenue (2022) & (US$ million)
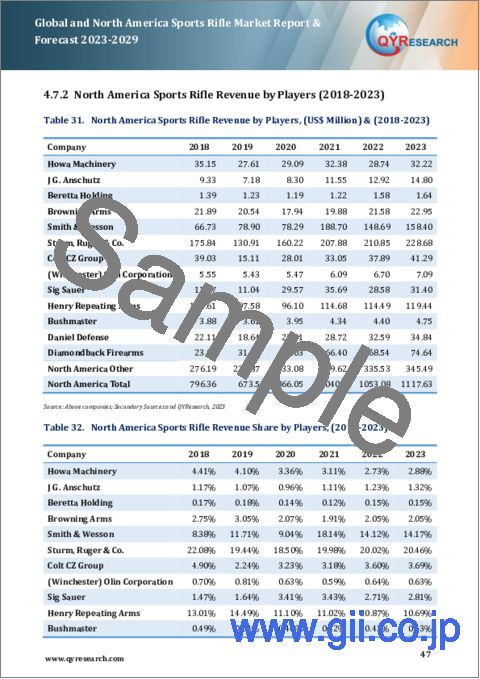
- Table 31. North America Sports Rifle Revenue by Players, (US$ Million) & (2018-2023)
- Table 32. North America Sports Rifle Revenue Share by Players, (2018-2023)
- Table 33. North America Sports Rifle Sales by Players, (K Units) & (2018-2023)
- Table 34. North America Sports Rifle Sales Share by Players, (2018-2023)
- Table 35. Global Sports Rifle Market Size Growth Rate (CAGR) by Region (US$ Million): 2018 VS 2022 VS 2029
- Table 36. Global Sports Rifle Sales in Volume by Region (2018-2023) & (K Units)
- Table 37. Global Sports Rifle Sales in Volume Forecast by Region (2023-2029) & (K Units)
- Table 38. Global Sports Rifle Sales in Value by Region (2018-2023) & (US$ Million)
- Table 39. Global Sports Rifle Sales in Value Forecast by Region (2023-2029) & (US$ Million)
- Table 40. Americas Sports Rifle Market Size Growth Rate (CAGR) by Country (US$ Million): 2018 VS 2022 VS 2029
- Table 41. Americas Sports Rifle Sales in Value by Country (2018-2023) & (US$ Million)
- Table 42. Americas Sports Rifle Sales in Value by Country (2024-2029) & (US$ Million)
- Table 43. Americas Sports Rifle Sales in Volume by Country (2018-2023) & (K Units)
- Table 44. Americas Sports Rifle Sales in Volume by Country (2024-2029) & (K Units)
- Table 45. EMEA Sports Rifle Market Size Growth Rate (CAGR) by Country (US$ Million): 2018 VS 2022 VS 2029
- Table 46. EMEA Sports Rifle Sales in Value by Country (2018-2023) & (US$ Million)
- Table 47. EMEA Sports Rifle Sales in Value by Country (2024-2029) & (US$ Million)
- Table 48. EMEA Sports Rifle Sales in Volume by Country (2018-2023) & (K Units)
- Table 49. EMEA Sports Rifle Sales in Volume by Country (2024-2029) & (K Units)
- Table 50. APAC Sports Rifle Market Size Growth Rate (CAGR) by Country (US$ Million): 2018 VS 2022 VS 2029
- Table 51. APAC Sports Rifle Sales in Value by Country (2018-2023) & (US$ Million)
- Table 52. APAC Sports Rifle Sales in Value by Country (2024-2029) & (US$ Million)
- Table 53. APAC Sports Rifle Sales in Volume by Country (2018-2023) & (K Units)
- Table 54. APAC Sports Rifle Sales in Volume by Country (2024-2029) & (K Units)
- Table 55. Howa Machinery Company Information
- Table 56. Howa Machinery Sports Rifle Sales (K Units), Revenue (US$ Million), Price (US$/Unit) and Gross Margin (2018-2023)
- Table 57. Howa Machinery Sports Rifle Product
- Table 58. J G. Anschutz Company Information
- Table 59. J G. Anschutz Sports Rifle Sales (K Units), Revenue (US$ Million), Price (US$/Unit) and Gross Margin (2018-2023)
- Table 60. J G. Anschutz Sports Rifle Product
- Table 61. Beretta Holding Company Information
- Table 62. Beretta Holding Sports Rifle Sales (K Units), Revenue (US$ Million), Price (US$/Unit) and Gross Margin (2018-2023)
- Table 63. Beretta Holding Sports Rifle Product
- Table 64. Beretta Holding Recent Development
- Table 65. Browning Arms Company Information
- Table 66. Browning Arms Sports Rifle Sales (K Units), Revenue (US$ Million), Price (US$/Unit) and Gross Margin (2018-2023)
- Table 67. Browning Arms Sports Rifle Product
- Table 68. Smith & Wesson Company Information
- Table 69. Smith & Wesson Sports Rifle Sales (K Units), Revenue (US$ Million), Price (US$/Unit) and Gross Margin (2018-2023)
- Table 70. Smith & Wesson Sports Rifle Product
- Table 71. Smith & Wesson Recent Development
- Table 72. Sturm, Ruger & Co. Company Information
- Table 73. Sturm, Ruger & Co. Sports Rifle Sales (K Units), Revenue (US$ Million), Price (US$/Unit) and Gross Margin (2018-2023)
- Table 74. Sturm, Ruger & Co. Sports Rifle Product
- Table 75. Sturm, Ruger & Co. Recent Development
- Table 76. Colt CZ Group Company Information
- Table 77. Colt CZ Group Sports Rifle Sales (K Units), Revenue (US$ Million), Price (US$/Unit) and Gross Margin (2018-2023)
- Table 78. Colt CZ Group Sports Rifle Product
- Table 79. Colt CZ Group Recent Development
- Table 80. (Winchester) Olin Corporation Company Information
- Table 81. (Winchester) Olin Corporation Sports Rifle Sales (K Units), Revenue (US$ Million), Price (US$/Unit) and Gross Margin (2018-2023)
- Table 82. (Winchester) Olin Corporation Sports Rifle Product
- Table 83. Sig Sauer Company Information
- Table 84. Sig Sauer Sports Rifle Sales (K Units), Revenue (US$ Million), Price (US$/Unit) and Gross Margin (2018-2023)
- Table 85. Sig Sauer Sports Rifle Product
- Table 86. Sig Sauer Recent Development
- Table 87. Henry Repeating Arms Company Information
- Table 88. Henry Repeating Arms Sports Rifle Sales (K Units), Revenue (US$ Million), Price (US$/Unit) and Gross Margin (2018-2023)
- Table 89. Henry Repeating Arms Sports Rifle Product
- Table 90. Henry Repeating Arms Recent Development
- Table 91. Bushmaster Company Information
- Table 92. Bushmaster Sports Rifle Sales (K Units), Revenue (US$ Million), Price (US$/Unit) and Gross Margin (2018-2023)
- Table 93. Bushmaster Sports Rifle Product
- Table 94. Daniel Defense Company Information
- Table 95. Daniel Defense Sports Rifle Sales (K Units), Revenue (US$ Million), Price (US$/Unit) and Gross Margin (2018-2023)
- Table 96. Daniel Defense Sports Rifle Product
- Table 97. Diamondback Firearms Company Information
- Table 98. Diamondback Firearms Sports Rifle Sales (K Units), Revenue (US$ Million), Price (US$/Unit) and Gross Margin (2018-2023)
- Table 99. Diamondback Firearms Sports Rifle Product
- Table 100. Key Raw Materials Lists
- Table 101. Raw Materials Key Suppliers Lists
- Table 102. Sports Rifle Distributors List
- Table 103. Sports Rifle Customers List
- Table 104. Research Programs/Design for This Report
- Table 105. Key Data Information from Secondary Sources
- Table 106. Key Data Information from Primary Sources
- Table 107. QYR Business Unit and Senior & Team Lead Analysts
List of Figures
- Figure 1. Sports Rifle Product Picture
- Figure 2. Global Sports Rifle Revenue, (US$ Million), 2018 VS 2022 VS 2029
- Figure 3. Global Sports Rifle Market Size 2018-2029 (US$ Million)
- Figure 4. Global Sports Rifle Sales 2018-2029 (K Units)
- Figure 5. North America Sports Rifle Revenue, (US$ Million), 2018 VS 2022 VS 2029
- Figure 6. North America Sports Rifle Market Size 2018-2029 (US$ Million)
- Figure 7. North America Sports Rifle Sales 2018-2029 (K Units)
- Figure 8. North America Sports Rifle Market Share in Global, in Value (US$ Million) 2018-2029
- Figure 9. North America Sports Rifle Market Share in Global, in Volume (K Units) 2018-2029
- Figure 10. Sports Rifle Report Years Considered
- Figure 11. Product Picture of Center fire bolt action rifle
- Figure 12. Product Picture of Center fire semi-automatic rifle
- Figure 13. Product Picture of Rimfire bolt action rifle
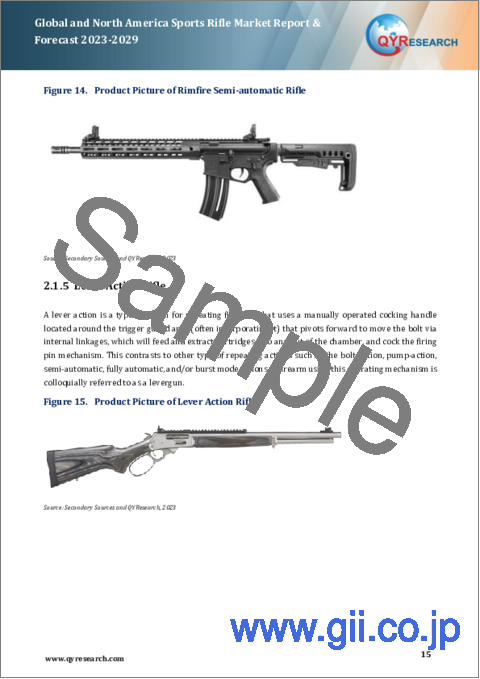
- Figure 14. Product Picture of Rimfire semi-automatic rifle
- Figure 15. Product Picture of Lever action rifle
- Figure 16. Global Sports Rifle Market Share by Type in 2022 & 2029
- Figure 17. Global Sports Rifle Sales in Value by Type (2018-2029) & (US$ Million)
- Figure 18. Global Sports Rifle Sales Market Share in Value by Type (2018-2029)
- Figure 19. Global Sports Rifle Sales by Type (2018-2029) & (K Units)
- Figure 20. Global Sports Rifle Sales Market Share in Volume by Type (2018-2029)
- Figure 21. North America Sports Rifle Market Share by Type in 2022 & 2029
- Figure 22. North America Sports Rifle Sales in Value by Type (2018-2029) & (US$ Million)
- Figure 23. North America Sports Rifle Sales Market Share in Value by Type (2018-2029)
- Figure 24. North America Sports Rifle Sales by Type (2018-2029) & (K Units)
- Figure 25. North America Sports Rifle Sales Market Share in Volume by Type (2018-2029)
- Figure 26. Product Picture of Hunting
- Figure 27. Product Picture of Shooting Sports
- Figure 28. Global Sports Rifle Market Share by Application in 2022 & 2029
- Figure 29. Global Sports Rifle Sales in Value by Application (2018-2029) & (US$ Million)
- Figure 30. Global Sports Rifle Sales Market Share in Value by Application (2018-2029)
- Figure 31. Global Sports Rifle Sales by Application (2018-2029) & (K Units)
- Figure 32. Global Sports Rifle Sales Market Share in Volume by Application (2018-2029)
- Figure 33. North America Sports Rifle Market Share by Application in 2022 & 2029
- Figure 34. North America Sports Rifle Sales in Value by Application (2018-2029) & (US$ Million)
- Figure 35. North America Sports Rifle Sales Market Share in Value by Application (2018-2029)
- Figure 36. North America Sports Rifle Sales by Application (2018-2029) & (K Units)
- Figure 37. North America Sports Rifle Sales Market Share in Volume by Application (2018-2029)
- Figure 38. Global Sports Rifle Sales by Female Users (2018-2029) & (K Units)
- Figure 39. Global Sports Rifle Sales Market Share in Volume by Female Users (2018-2029)
- Figure 40. The Top 5 and 10 Largest Manufacturers of Sports Rifle in the World: Market Share by Sports Rifle Revenue in 2022
- Figure 41. Global Sports Rifle Market Size Market Share by Region: 2018 VS 2022 VS 2029
- Figure 42. Global Sports Rifle Sales in Volume Market Share by Region (2018-2029)
- Figure 43. Global Sports Rifle Sales in Value Market Share by Region (2018-2029)
- Figure 44. Americas Sports Rifle Sales in Volume Growth Rate 2018-2029 (K Units)
- Figure 45. Americas Sports Rifle Sales in Value Growth Rate 2018-2029 (US$ Million)
- Figure 46. Americas Sports Rifle Sales by Type (2018-2029) & (K Units)
- Figure 47. Americas Sports Rifle Sales Market Share in Volume by Type (2018-2029)
- Figure 48. Americas Sports Rifle Sales by Application (2018-2029) & (K Units)
- Figure 49. Americas Sports Rifle Sales Market Share in Volume by Application (2018-2029)
- Figure 50. United States Sports Rifle Sales in Value Growth Rate (2018-2029) & (US$ Million)
- Figure 51. Canada Sports Rifle Sales in Value Growth Rate (2018-2029) & (US$ Million)
- Figure 52. Mexico Sports Rifle Sales in Value Growth Rate (2018-2029) & (US$ Million)
- Figure 53. Brazil Sports Rifle Sales in Value Growth Rate (2018-2029) & (US$ Million)
- Figure 54. EMEA Sports Rifle Sales in Volume Growth Rate 2018-2029 (K Units)
- Figure 55. EMEA Sports Rifle Sales in Value Growth Rate 2018-2029 (US$ Million)
- Figure 56. EMEA Sports Rifle Sales by Type (2018-2029) & (K Units)
- Figure 57. EMEA Sports Rifle Sales Market Share in Volume by Type (2018-2029)
- Figure 58. EMEA Sports Rifle Sales by Application (2018-2029) & (K Units)
- Figure 59. EMEA Sports Rifle Sales Market Share in Volume by Application (2018-2029)
- Figure 60. Europe Sports Rifle Sales in Value Growth Rate (2018-2029) & (US$ Million)
- Figure 61. Middle East Sports Rifle Sales in Value Growth Rate (2018-2029) & (US$ Million)
- Figure 62. Africa Sports Rifle Sales in Value Growth Rate (2018-2029) & (US$ Million)
- Figure 63. China Sports Rifle Sales in Volume Growth Rate 2018-2029 (K Units)
- Figure 64. China Sports Rifle Sales in Value Growth Rate 2018-2029 (US$ Million)
- Figure 65. China Sports Rifle Sales by Type (2018-2029) & (K Units)
- Figure 66. China Sports Rifle Sales Market Share in Volume by Type (2018-2029)
- Figure 67. China Sports Rifle Sales by Application (2018-2029) & (K Units)
- Figure 68. China Sports Rifle Sales Market Share in Volume by Application (2018-2029)
- Figure 69. APAC Sports Rifle Sales in Volume Growth Rate 2018-2029 (K Units)
- Figure 70. APAC Sports Rifle Sales in Value Growth Rate 2018-2029 (US$ Million)
- Figure 71. APAC Sports Rifle Sales by Type (2018-2029) & (K Units)
- Figure 72. APAC Sports Rifle Sales Market Share in Volume by Type (2018-2029)
- Figure 73. APAC Sports Rifle Sales by Application (2018-2029) & (K Units)
- Figure 74. APAC Sports Rifle Sales Market Share in Volume by Application (2018-2029)
- Figure 75. Japan Sports Rifle Sales in Value Growth Rate (2018-2029) & (US$ Million)
- Figure 76. South Korea Sports Rifle Sales in Value Growth Rate (2018-2029) & (US$ Million)
- Figure 77. China Taiwan Sports Rifle Sales in Value Growth Rate (2018-2029) & (US$ Million)
- Figure 78. Southeast Asia Sports Rifle Sales in Value Growth Rate (2018-2029) & (US$ Million)
- Figure 79. India Sports Rifle Sales in Value Growth Rate (2018-2029) & (US$ Million)
- Figure 80. Sports Rifle Value Chain
- Figure 81. Sports Rifle Production Process
- Figure 82. Channels of Distribution
- Figure 83. Distributors Profiles
- Figure 84. Bottom-up and Top-down Approaches for This Report
- Figure 85. Data Triangulation
- Figure 86. Key Executives Interviewed
Market Analysis and Insights
This report focuses on global and North America Sports Rifle market, also covers the segmentation data of other regions in regional level and county level.
The global Sports Rifle revenue was US$ 1,674.90 million in 2022 and is forecast to a readjusted size of US$ 2,589.17 million by 2029 with a CAGR of 6.50% during the review period (2023-2029).
In Americas the Sports Rifle revenue is expected to grow from US$ 1,185.67 million in 2022 to US$ 1,856.17 million by 2029, at a CAGR of 6.70% during the forecast period (2023-2029).
The global key players of Sports Rifle include: Howa Machinery, J G. Anschutz, Beretta Holding, Browning Arms, Smith & Wesson, Sturm, Ruger & Co., Colt CZ Group, (Winchester) Olin Corporation, and Sig Sauer, etc. The global five biggest players hold a share of 38.22% in 2022.
Scope and Market Size
Sports Rifle market is segmented in regional and country level, by players, by Type, and by Application. Companies, stakeholders, and other participants in the global Sports Rifle market will be able to gain the upper hand as they use the report as a powerful resource. The segmental analysis focuses on sales, revenue and forecast by Type and by Application for the period 2018-2029.
For North America market, this report focuses on the Sports Rifle market size by players, by Type, and by Application, for the period 2018-2029. The key players include the global and local players which play important roles in North America.
By Company
- Howa Machinery
- J G. Anschutz
- Beretta Holding
- Browning Arms
- Smith & Wesson
- Sturm, Ruger & Co
- Colt CZ Group
- (Winchester) Olin Corporation
- Sig Sauer
- Henry Repeating Arms
- Bushmaster
- Daniel Defense
- Diamondback Firearms
Segment by Type
- Center fire bolt action rifle
- Center fire semi-automatic rifle
- Rimfire bolt action rifle
- Rimfire semi-automatic rifle
- Lever action rifle
- Others
Segment by Application
- Hunting
- Shooting Sports
- Others
By Region
- Americas
- United States
- Canada
- Mexico
- Brazil
- China
- APAC (excluding China)
- Japan
- South Korea
- China Taiwan
- Southeast Asia
- India
- EMEA
- Europe
- Middle East
- Africa
Chapter Introduction
Chapter 1: Introduces Sports Rifle definition, global sales (volume and revenue), North America market size, North America percentage in global market. This section also introduces the market dynamics, latest developments of the market, the driving factors and restrictive factors of the market, the challenges and risks faced by companies in the industry, and the analysis of relevant policies in the industry.
Chapter 2: Provides the analysis of various market segments by Type, covering the volume, price, revenue, and development potential of each market segment, to help readers find the blue ocean market in different market segments.
Chapter 3: Provides the analysis of various market segments by Application, covering the revenue, price, volume, and development potential of each market segment, to help readers find the blue ocean market in different downstream markets.
Chapter 4: Detailed analysis of Sports Rifle companies's competitive landscape, revenue, market share and industry ranking, latest development plan, merger, and acquisition information, etc.
Chapter 5: Revenue and volume of Sports Rifle in global and regional level. It provides a quantitative analysis of the market size and development potential of each region and introduces the market development, future development prospects, market space, and capacity of each country in the world.
Chapter 6: Americas by Type, by Application and by country, sales, and revenue for each segment.
Chapter 7: EMEA by Type, by Application and by region, sales, and revenue for each segment.
Chapter 8: China by Type, and by Application, sales, and revenue for each segment.
Chapter 9: APAC (excluding China) by Type, by Application and by region, sales, and revenue for each segment.
Chapter 10: Provides profiles of key companies, introducing the basic situation of the main companies in the market in detail, including product descriptions and specifications, Sports Rifle sales, revenue, gross margin, and recent development, etc.
Chapter 11: Analysis of industrial chain, sales channel, key raw materials, distributors, and customers.
Chapter 12: research findings and conclusion.
Table of Contents
1 Study Coverage
- 1.1 Sports Rifle Product Introduction
- 1.2 Global Sports Rifle Outlook 2018 VS 2022 VS 2029
- 1.2.1 Global Sports Rifle Sales in US$ Million for the Year 2018-2029
- 1.2.2 Global Sports Rifle Sales in Volume for the Year 2018-2029
- 1.3 North America Sports Rifle Outlook 2018 VS 2022 VS 2029
- 1.3.1 North America Sports Rifle Sales in US$ Million for the Year 2018-2029
- 1.3.2 North America Sports Rifle Sales in Volume for the Year 2018-2029
- 1.4 Sports Rifle Market Size, North America VS Global, 2018 VS 2022 VS 2029
- 1.4.1 The Market Share of North America Sports Rifle in Global, 2018 VS 2022 VS 2029
- 1.4.2 The Growth Rate of Sports Rifle Market Size, North America VS Global, 2018 VS 2022 VS 2029
- 1.5 Sports Rifle Market Dynamics
- 1.5.1 Sports Rifle Industry Trends
- 1.5.2 Sports Rifle Market Drivers
- 1.5.3 Sports Rifle Market Challenges
- 1.5.4 Sports Rifle Market Restraints
- 1.6 Assumptions and Limitations
- 1.7 Study Objectives
- 1.8 Years Considered
2 Sports Rifle by Type
- 2.1 Sports Rifle Market by Type
- 2.1.1 Center fire bolt action rifle
- 2.1.2 Center fire semi-automatic rifle
- 2.1.3 Rimfire bolt action rifle
- 2.1.4 Rimfire semi-automatic rifle
- 2.1.5 Lever action rifle
- 2.2 Global Sports Rifle Market Size by Type
- 2.2.1 Global Sports Rifle Sales in Value, by Type (2018, 2022 & 2029)
- 2.2.2 Global Sports Rifle Sales in Volume, by Type (2018, 2022 & 2029)
- 2.2.3 Global Sports Rifle Average Selling Price (ASP) by Type (2018, 2022 & 2029)
- 2.3 North America Sports Rifle Market Size by Type
- 2.3.1 North America Sports Rifle Sales in Value, by Type (2018, 2022 & 2029)
- 2.3.2 North America Sports Rifle Sales in Volume, by Type (2018, 2022 & 2029)
- 2.3.3 North America Sports Rifle Average Selling Price (ASP) by Type (2018, 2022 & 2029)
3 Sports Rifle by Application
- 3.1 Sports Rifle Market by Application
- 3.1.1 Hunting
- 3.1.2 Shooting Sports
- 3.1.3 Others
- 3.2 Global Sports Rifle Market Size by Application
- 3.2.1 Global Sports Rifle Sales in Value, by Application (2018, 2022 & 2029)
- 3.2.2 Global Sports Rifle Sales in Volume, by Application (2018, 2022 & 2029)
- 3.2.3 Global Sports Rifle Average Selling Price (ASP) by Application (2018, 2022 & 2029)
- 3.3 North America Sports Rifle Market Size by Application
- 3.3.1 North America Sports Rifle Sales in Value, by Application (2018, 2022 & 2029)
- 3.3.2 North America Sports Rifle Sales in Volume, by Application (2018, 2022 & 2029)
- 3.3.3 North America Sports Rifle Average Selling Price (ASP) by Application (2018, 2022 & 2029)
- 3.4 Global Sports Rifle Market Size by Female Users
4 Global Sports Rifle Competitor Landscape by Company
- 4.1 Global Sports Rifle Market Size by Company
- 4.1.1 Global Key Manufacturers of Sports Rifle, Ranked by Revenue (2022)
- 4.1.2 Global Sports Rifle Revenue by Manufacturer (2018-2023)
- 4.1.3 Global Sports Rifle Sales by Manufacturer (2018-2023)
- 4.1.4 Global Sports Rifle Price by Manufacturer (2018-2023)
- 4.2 Global Sports Rifle Concentration Ratio (CR)
- 4.2.1 Sports Rifle Market Concentration Ratio (CR) (2018-2023)
- 4.2.2 Global Top 5 and Top 10 Largest Manufacturers of Sports Rifle in 2022
- 4.2.3 Global Sports Rifle Market Share by Company Type (Tier 1, Tier 2, and Tier 3)
- 4.3 Global Key Manufacturers of Sports Rifle, Manufacturing Base Distribution and Headquarters
- 4.4 Global Key Manufacturers of Sports Rifle, Product Offered
- 4.5 Global Key Manufacturers of Sports Rifle, Founded Date of
- 4.6 Manufacturers Mergers & Acquisitions, Expansion Plans
- 4.7 North America Sports Rifle Market Size by Company
- 4.7.1 Key Players of Sports Rifle in North America, Ranked by Revenue (2022)
- 4.7.2 North America Sports Rifle Revenue by Players (2018-2023)
- 4.7.3 North America Sports Rifle Sales by Players (2018-2023)
5 Global Sports Rifle Market Size by Region
- 5.1 Global Sports Rifle Market Size by Region: 2018 VS 2022 VS 2029
- 5.2 Global Sports Rifle Market Size in Volume by Region (2018-2029)
- 5.2.1 Global Sports Rifle Sales in Volume by Region: 2018-2023
- 5.2.2 Global Sports Rifle Sales in Volume Forecast by Region (2023-2029)
- 5.3 Global Sports Rifle Market Size in Value by Region (2018-2029)
- 5.3.1 Global Sports Rifle Sales in Value by Region: 2018-2023
- 5.3.2 Global Sports Rifle Sales in Value by Region: 2023-2029
6 Americas
- 6.1 Americas Sports Rifle Market Size YoY Growth 2018-2029
- 6.2 Americas Sports Rifle Sales in Volume, by Type (2018, 2022 & 2029)
- 6.3 Americas Sports Rifle Sales in Volume, by Application (2018, 2022 & 2029)
- 6.4 Americas Sports Rifle Market Facts & Figures by Country (2018, 2022 & 2029)
- 6.4.1 Americas Sports Rifle Sales in Value by Country (2018, 2022 & 2029)
- 6.4.2 Americas Sports Rifle Sales in Volume by Country (2018, 2022 & 2029)
- 6.4.3 United States
- 6.4.4 Canada
- 6.4.5 Mexico
- 6.4.6 Brazil
7 EMEA
- 7.1 EMEA Sports Rifle Market Size YoY Growth 2018-2029
- 7.2 EMEA Sports Rifle Sales in Volume, by Type (2018, 2022 & 2029)
- 7.3 EMEA Sports Rifle Sales in Volume, by Application (2018, 2022 & 2029)
- 7.4 EMEA Sports Rifle Market Facts & Figures by Country (2018, 2022 & 2029)
- 7.4.1 EMEA Sports Rifle Sales in Value by Country (2018, 2022 & 2029)
- 7.4.2 EMEA Sports Rifle Sales in Volume by Country (2018, 2022 & 2029)
- 7.4.3 Europe
- 7.4.4 Middle East
- 7.4.5 Africa
8 China
- 8.1 China Sports Rifle Market Size YoY Growth 2018-2029
- 8.2 China Sports Rifle Sales in Volume, by Type (2018, 2022 & 2029)
- 8.3 China Sports Rifle Sales in Volume, by Application (2018, 2022 & 2029)
9 APAC
- 9.1 APAC Sports Rifle Market Size YoY Growth 2018-2029
- 9.2 APAC Sports Rifle Sales in Volume, by Type (2018, 2022 & 2029)
- 9.3 APAC Sports Rifle Sales in Volume, by Application (2018, 2022 & 2029)
- 9.4 APAC Sports Rifle Market Facts & Figures by Country (2018, 2022 & 2029)
- 9.4.1 APAC Sports Rifle Sales in Value by Country (2018, 2022 & 2029)
- 9.4.2 APAC Sports Rifle Sales in Volume by Country (2018, 2022 & 2029)
- 9.4.3 Japan
- 9.4.4 South Korea
- 9.4.5 China Taiwan
- 9.4.6 Southeast Asia
- 9.4.7 India
10 Company Profiles
- 10.1 Howa Machinery
- 10.1.1 Howa Machinery Company Information
- 10.1.2 Howa Machinery Description and Business Overview
- 10.1.3 Howa Machinery Sports Rifle Sales, Revenue and Gross Margin (2018-2023)
- 10.1.4 Howa Machinery Sports Rifle Products Offered
- 10.2 J G. Anschutz
- 10.2.1 J G. Anschutz Company Information
- 10.2.2 J G. Anschutz Description and Business Overview
- 10.2.3 J G. Anschutz Sports Rifle Sales, Revenue and Gross Margin (2018-2023)
- 10.2.4 J G. Anschutz Sports Rifle Products Offered
- 10.3 Beretta Holding
- 10.3.1 Beretta Holding Company Information
- 10.3.2 Beretta Holding Description and Business Overview
- 10.3.3 Beretta Holding Sports Rifle Sales, Revenue and Gross Margin (2018-2023)
- 10.3.4 Beretta Holding Sports Rifle Products Offered
- 10.3.5 Beretta Holding Recent Development
- 10.4 Browning Arms
- 10.4.1 Browning Arms Company Information
- 10.4.2 Browning Arms Description and Business Overview
- 10.4.3 Browning Arms Sports Rifle Sales, Revenue and Gross Margin (2018-2023)
- 10.4.4 Browning Arms Sports Rifle Products Offered
- 10.5 Smith & Wesson
- 10.5.1 Smith & Wesson Company Information
- 10.5.2 Smith & Wesson Description and Business Overview
- 10.5.3 Smith & Wesson Sports Rifle Sales, Revenue and Gross Margin (2018-2023)
- 10.5.4 Smith & Wesson Sports Rifle Products Offered
- 10.5.5 Smith & Wesson Recent Development
- 10.6 Sturm, Ruger & Co.
- 10.6.1 Sturm, Ruger & Co. Company Information
- 10.6.2 Sturm, Ruger & Co. Description and Business Overview
- 10.6.3 Sturm, Ruger & Co. Sports Rifle Sales, Revenue and Gross Margin (2018-2023)
- 10.6.4 Sturm, Ruger & Co. Sports Rifle Products Offered
- 10.6.5 Sturm, Ruger & Co. Recent Development
- 10.7 Colt CZ Group
- 10.7.1 Colt CZ Group Company Information
- 10.7.2 Colt CZ Group Description and Business Overview
- 10.7.3 Colt CZ Group Sports Rifle Sales, Revenue and Gross Margin (2018-2023)
- 10.7.4 Colt CZ Group Sports Rifle Products Offered
- 10.7.5 Colt CZ Group Recent Development
- 10.8 (Winchester) Olin Corporation
- 10.8.1 (Winchester) Olin Corporation Company Information
- 10.8.2 (Winchester) Olin Corporation Description and Business Overview
- 10.8.3 (Winchester) Olin Corporation Sports Rifle Sales, Revenue and Gross Margin (2018-2023)
- 10.8.4 (Winchester) Olin Corporation Sports Rifle Products Offered
- 10.9 Sig Sauer
- 10.9.1 Sig Sauer Company Information
- 10.9.2 Sig Sauer Description and Business Overview
- 10.9.3 Sig Sauer Sports Rifle Sales, Revenue and Gross Margin (2018-2023)
- 10.9.4 Sig Sauer Sports Rifle Products Offered
- 10.9.5 Sig Sauer Recent Development
- 10.10 Henry Repeating Arms
- 10.10.1 Henry Repeating Arms Company Information
- 10.10.2 Henry Repeating Arms Description and Business Overview
- 10.10.3 Henry Repeating Arms Sports Rifle Sales, Revenue and Gross Margin (2018-2023)
- 10.10.4 Henry Repeating Arms Sports Rifle Products Offered
- 10.10.5 Henry Repeating Arms Recent Development
- 10.11 Bushmaster
- 10.11.1 Bushmaster Company Information
- 10.11.2 Bushmaster Description and Business Overview
- 10.11.3 Bushmaster Sports Rifle Sales, Revenue and Gross Margin (2018-2023)
- 10.11.4 Bushmaster Sports Rifle Products Offered
- 10.12 Daniel Defense
- 10.12.1 Daniel Defense Company Information
- 10.12.2 Daniel Defense Description and Business Overview
- 10.12.3 Daniel Defense Sports Rifle Sales, Revenue and Gross Margin (2018-2023)
- 10.12.4 Daniel Defense Sports Rifle Products Offered
- 10.13 Diamondback Firearms
- 10.13.1 Diamondback Firearms Company Information
- 10.13.2 Diamondback Firearms Description and Business Overview
- 10.13.3 Diamondback Firearms Sports Rifle Sales, Revenue and Gross Margin (2018-2023)
- 10.13.4 Diamondback Firearms Sports Rifle Products Offered
11 Industry Chain and Sales Channels Analysis
- 11.1 Sports Rifle Industry Chain Analysis
- 11.2 Sports Rifle Key Raw Materials
- 11.2.1 Key Raw Materials
- 11.2.2 Raw Materials Key Suppliers
- 11.3 Sports Rifle Production Mode & Process
- 11.4 Sports Rifle Sales and Marketing
- 11.4.1 Sports Rifle Sales Channels
- 11.4.2 Sports Rifle Distributors
- 11.5 Sports Rifle Customers
12 Research Findings and Conclusion
13 Appendix
- 13.1 Research Methodology
- 13.1.1 Methodology/Research Approach
- 13.1.2 Data Source
- 13.2 Author Details
- 13.3 Disclaimer
