|
|
市場調査レポート
商品コード
1363905
汎用視聴覚信号機器の世界市場(2023年)Global Versatile Visual and Audible Signaling Devices Market Research Report 2023 |
||||||
|
|
|||||||
カスタマイズ可能
適宜更新あり
|
|||||||


| 汎用視聴覚信号機器の世界市場(2023年) |
|
出版日: 2023年10月17日
発行: QYResearch
ページ情報: 英文 176 Pages
納期: 2~3営業日
|

- 全表示
- 概要
- 図表
- 目次
世界の汎用視聴覚信号機器の市場規模は、2022年の8億8,145万米ドルから2029年までに12億米ドルに達し、予測期間の2023年~2029年にCAGRで4.70%の成長が予測されています。
北米市場は2023年に2億5,406万米ドル、2029年までに3億2,831万米ドルに達する見込みで、予測期間のCAGRは4.37%です。
アジア太平洋市場は2023年に3億405万米ドル、2029年までに4億1,834万米ドルに達する見込みで、予測期間のCAGRは5.46%です。
当レポートでは、世界の汎用視聴覚信号機器市場について調査分析し、生産と消費の予測、地域とセグメントの分析、企業プロファイルなどを提供しています。
目次
第1章 汎用視聴覚信号機器市場の概要
- 製品の定義
- 汎用視聴覚信号機器:タイプ別
- 汎用視聴覚信号機器:用途別
- 世界市場の成長の見通し
- 世界の汎用視聴覚信号機器生産金額の推計と予測(2018年~2029年)
- 世界の汎用視聴覚信号機器生産の推計と予測(2018年~2029年)
- 世界の汎用視聴覚信号機器市場の平均価格の推計と予測(2018年~2029年)
- 前提条件と制限
第2章 市場競合:メーカー別
- 世界の汎用視聴覚信号機器の売上の市場シェア:メーカー別(2019年~2023年)
- 世界の汎用視聴覚信号機器の収益の市場シェア:メーカー別(2019年~2023年)
- 世界の汎用視聴覚信号機器の主要企業、産業ランキング(2021年・2022年)
- 世界の汎用視聴覚信号機器の市場シェア:企業タイプ別(Tier 1・Tier 2・Tier 3)
- 世界の汎用視聴覚信号機器の平均価格:メーカー別(2019年~2023年)
- 世界の汎用視聴覚信号機器の主要メーカーの製造施設、本社
- 世界の汎用視聴覚信号機器の主要メーカーの製品タイプ
- 世界の汎用視聴覚信号機器の主要メーカーの販売地域
- 世界の汎用視聴覚信号機器市場の競合状況と動向
- 世界の汎用視聴覚信号機器の市場集中度
- 世界の5大・10大汎用視聴覚信号機器企業の市場シェア(収益)
第3章 汎用視聴覚信号機器の生産:地域別
- 世界の汎用視聴覚信号機器生産金額の推計と予測:地域別(2018年・2022年・2029年)
- 世界の汎用視聴覚信号機器生産金額:地域別(2018年~2029年)
- 世界の汎用視聴覚信号機器生産金額の市場シェア:地域別(2018年~2023年)
- 世界の汎用視聴覚信号機器生産金額の予測:地域別(2024年~2029年)
- 世界の汎用視聴覚信号機器生産の推計と予測:地域別(2018年・2022年・2029年)
- 世界の汎用視聴覚信号機器生産:地域別(2018年~2029年)
- 世界の汎用視聴覚信号機器生産の市場シェア:地域別(2018年~2023年)
- 世界の汎用視聴覚信号機器生産の予測:地域別(2024年~2029年)
- 世界の汎用視聴覚信号機器市場の価格分析:地域別(2018年~2023年)
- 世界の汎用視聴覚信号機器の生産と金額、前年比成長
- 北米の汎用視聴覚信号機器生産金額の推計と予測(2018年~2029年)
- 欧州の汎用視聴覚信号機器生産金額の推計と予測(2018年~2029年)
- 中国の汎用視聴覚信号機器生産金額の推計と予測(2018年~2029年)
- 日本の汎用視聴覚信号機器生産金額の推計と予測(2018年~2029年)
第4章 汎用視聴覚信号機器消費:地域別
- 世界の汎用視聴覚信号機器消費の推計と予測:地域別(2018年・2022年・2029年)
- 世界の汎用視聴覚信号機器消費:地域別(2018年~2029年)
- 世界の汎用視聴覚信号機器消費:地域別(2018年~2029年)
- 世界の汎用視聴覚信号機器消費の予測:地域別(2024年~2029年)
- 北米
- 北米の汎用視聴覚信号機器消費の成長率:国別(2018年・2022年・2029年)
- 北米の汎用視聴覚信号機器消費:国別(2018年~2029年)
- 米国
- カナダ
- 欧州
- 欧州の汎用視聴覚信号機器消費の成長率:国別(2018年・2022年・2029年)
- 欧州の汎用視聴覚信号機器消費:国別(2018年~2029年)
- ドイツ
- 英国
- フランス
- ロシア
- イタリア
- アジア太平洋
- アジア太平洋の汎用視聴覚信号機器消費の成長率:国別(2018年・2022年・2029年)
- アジア太平洋の汎用視聴覚信号機器消費:国別(2018年~2029年)
- 中国
- 日本
- 韓国
- 東南アジア
- インド
- 台湾
- オーストラリア
- ラテンアメリカ
- ラテンアメリカの汎用視聴覚信号機器消費の成長率:国別(2018年・2022年・2029年)
- ラテンアメリカの汎用視聴覚信号機器消費:国別(2018年~2029年)
- メキシコ
- ブラジル
- アルゼンチン
- 中東・アフリカ
- 中東・アフリカの汎用視聴覚信号機器消費の成長率:国別(2018年・2022年・2029年)
- 中東・アフリカの汎用視聴覚信号機器消費:国別(2018年~2029年)
- 中東
- アフリカ
第5章 セグメント:タイプ別
- 世界の汎用視聴覚信号機器の売上:タイプ別(2018年~2029年)
- 世界の汎用視聴覚信号機器の売上:タイプ別(2018年~2023年)
- 世界の汎用視聴覚信号機器の売上:タイプ別(2024年~2029年)
- 世界の汎用視聴覚信号機器の売上の市場シェア:タイプ別(2018年~2029年)
- 世界の汎用視聴覚信号機器の収益:タイプ別(2018年~2029年)
- 世界の汎用視聴覚信号機器の収益:タイプ別(2018年~2023年)
- 世界の汎用視聴覚信号機器の収益:タイプ別(2024年~2029年)
- 世界の汎用視聴覚信号機器の収益の市場シェア:タイプ別(2018年~2029年)
- 世界の汎用視聴覚信号機器の価格:タイプ別(2018年~2029年)
第6章 セグメント:用途別
- 世界の汎用視聴覚信号機器の売上:用途別(2018年~2029年)
- 世界の汎用視聴覚信号機器の売上:用途別(2018年~2023年)
- 世界の汎用視聴覚信号機器の売上:用途別(2024年~2029年)
- 世界の汎用視聴覚信号機器の売上の市場シェア:用途別(2018年~2029年)
- 世界の汎用視聴覚信号機器の収益:用途別(2018年~2029年)
- 世界の汎用視聴覚信号機器の収益:用途別(2018年~2023年)
- 世界の汎用視聴覚信号機器の収益:用途別(2024年~2029年)
- 世界の汎用視聴覚信号機器の収益の市場シェア:用途別(2018年~2029年)
- 世界の汎用視聴覚信号機器の価格:用途別(2018年~2029年)
第7章 主要企業プロファイル
- Patlite
- Federal Signal
- Qlight
- Eaton
- Werma Signaltechnik
- Rockwell Automation
- Honeywell
- Potter Electric Signal
- Schneider Electric
- Auer Signal
- E2S Warning Signals
- R. Stahl
- Pfannenberg
- Zhejiang Nanzhou Technology
- Moflash Signalling
- Nanhua Electronics
- Sirena
- Edwards Signaling
- Siemens
- Emerson Electric
- Pepperl+Fuchs
- D.G. Controls
- Hanyoung Nux
- Tomar Electronics
- Aximum Electronic
- Menics
- Leuze electronic
第8章 産業チェーンと販売チャネルの分析
- 汎用視聴覚信号機器の産業チェーン分析
- 汎用視聴覚信号機器の主な原材料
- 主な原材料
- 原材料の主要サプライヤー
- 汎用視聴覚信号機器の製造コストの割合
- 汎用視聴覚信号機器の販売とマーケティング
- 汎用視聴覚信号機器の顧客
第9章 汎用視聴覚信号機器の市場力学
- 汎用視聴覚信号機器産業の動向
- 汎用視聴覚信号機器市場の促進要因
- 汎用視聴覚信号機器市場の課題
第10章 調査結果と結論
第11章 調査手法とデータソース
List of Tables
- Table 1. Versatile Visual and Audible Signaling Devices Description by Type
- Table 2. Global Versatile Visual and Audible Signaling Devices Market Value by Type, (US$ Million) & (2022 VS 2029)
- Table 3. Global Versatile Visual and Audible Signaling Devices Market Value by Application, (US$ Million) & (2022 VS 2029)
- Table 4. Global Versatile Visual and Audible Signaling Devices Sales by Manufacturers (2019-2023) & (K Units)
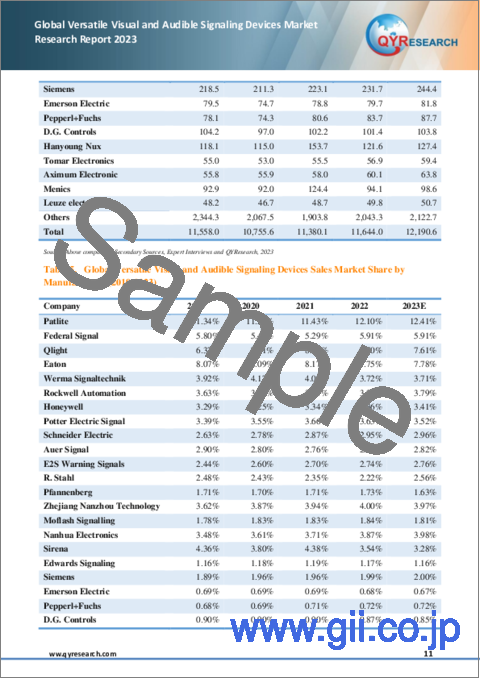
- Table 5. Global Versatile Visual and Audible Signaling Devices Sales Market Share by Manufacturers (2019-2023)
- Table 6. Global Versatile Visual and Audible Signaling Devices Revenue by Manufacturers (2019-2023) & (US$ Million)
- Table 7. Global Versatile Visual and Audible Signaling Devices Revenue Share by Manufacturers (2019-2023)
- Table 8. Global Key Players of Versatile Visual and Audible Signaling Devices, Industry Ranking, 2021 VS 2022
- Table 9. Global Company Type (Tier 1, Tier 2, and Tier 3) & (based on the Revenue in Versatile Visual and Audible Signaling Devices as of 2022)
- Table 10. Global Market Versatile Visual and Audible Signaling Devices Average Price by Manufacturers (US$/Unit) & (2019-2023)
- Table 11. Global Key Manufacturers of Versatile Visual and Audible Signaling Devices, Manufacturing Sites & Headquarters
- Table 12. Global Key Manufacturers of Versatile Visual and Audible Signaling Devices Product Type
- Table 13. Global Key Manufacturers of Versatile Visual and Audible Signaling Devices Sales Regions
- Table 14. Global Versatile Visual and Audible Signaling Devices Manufacturers Market Concentration Ratio (CR5 and HHI)
- Table 15. Global Versatile Visual and Audible Signaling Devices Production Value Growth Rate by Region: 2018 VS 2022 VS 2029 (US$ Million)
- Table 16. Global Versatile Visual and Audible Signaling Devices Production Value (US$ Million) by Region (2018-2023)
- Table 17. Global Versatile Visual and Audible Signaling Devices Production Value Market Share by Region (2018-2023)
- Table 18. Global Versatile Visual and Audible Signaling Devices Production Value (US$ Million) Forecast by Region (2024-2029)
- Table 19. Global Versatile Visual and Audible Signaling Devices Production Value Market Share Forecast by Region (2024-2029)
- Table 20. Global Versatile Visual and Audible Signaling Devices Production Comparison by Region: 2018 VS 2022 VS 2029 (K Units)
- Table 21. Global Versatile Visual and Audible Signaling Devices Production (K Units) by Region (2018-2023)
- Table 22. Global Versatile Visual and Audible Signaling Devices Production Market Share by Region (2018-2023)
- Table 23. Global Versatile Visual and Audible Signaling Devices Production (K Units) Forecast by Region (2024-2029)
- Table 24. Global Versatile Visual and Audible Signaling Devices Production Market Share Forecast by Region (2024-2029)
- Table 25. Global Versatile Visual and Audible Signaling Devices Market Average Price (US$/Unit) by Region (2018-2023)
- Table 26. Global Versatile Visual and Audible Signaling Devices Market Average Price (US$/Unit) by Region (2024-2029)
- Table 27. Global Versatile Visual and Audible Signaling Devices Consumption Growth Rate by Region: 2018 VS 2022 VS 2029 (K Units)
- Table 28. Global Versatile Visual and Audible Signaling Devices Consumption by Region (2018-2023) & (K Units)
- Table 29. Global Versatile Visual and Audible Signaling Devices Consumption Market Share by Region (2018-2023)
- Table 30. Global Versatile Visual and Audible Signaling Devices Forecasted Consumption by Region (2024-2029) & (K Units)
- Table 31. Global Versatile Visual and Audible Signaling Devices Forecasted Consumption Market Share by Region (2024-2029)
- Table 32. North America Versatile Visual and Audible Signaling Devices Consumption Growth Rate by Country: 2018 VS 2022 VS 2029 (K Units)
- Table 33. North America Versatile Visual and Audible Signaling Devices Consumption by Country (2018-2023) & (K Units)
- Table 34. North America Versatile Visual and Audible Signaling Devices Consumption Market Share by Country (2018-2023)
- Table 35. North America Versatile Visual and Audible Signaling Devices Consumption by Country (2024-2029) & (K Units)
- Table 36. North America Versatile Visual and Audible Signaling Devices Consumption Market Share by Country (2024-2029)
- Table 37. Europe Versatile Visual and Audible Signaling Devices Consumption Growth Rate by Country: 2018 VS 2022 VS 2029 (K Units)
- Table 38. Europe Versatile Visual and Audible Signaling Devices Consumption by Country (2018-2023) & (K Units)
- Table 39. Europe Versatile Visual and Audible Signaling Devices Consumption Market Share by Country (2018-2023)
- Table 40. Europe Versatile Visual and Audible Signaling Devices Consumption by Country (2024-2029) & (K Units)
- Table 41. Europe Versatile Visual and Audible Signaling Devices Consumption Market Share by Country (2024-2029)
- Table 42. Asia-Pacific Versatile Visual and Audible Signaling Devices Consumption Growth Rate by Country: 2018 VS 2022 VS 2029 (K Units)
- Table 43. Asia-Pacific Versatile Visual and Audible Signaling Devices Consumption by Country (2018-2023) & (K Units)
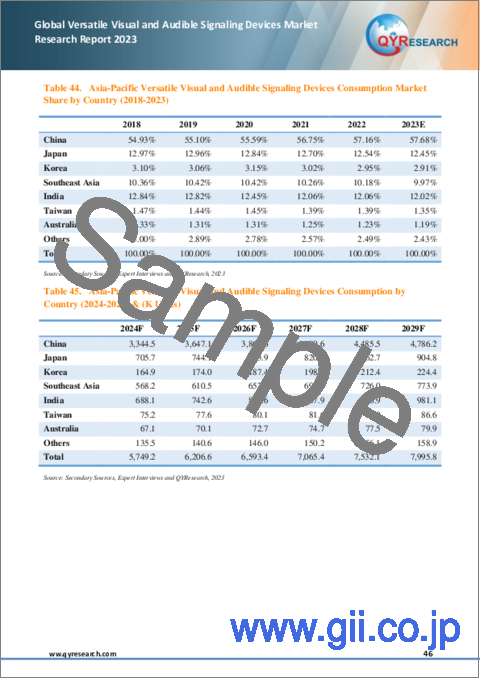
- Table 44. Asia-Pacific Versatile Visual and Audible Signaling Devices Consumption Market Share by Country (2018-2023)
- Table 45. Asia-Pacific Versatile Visual and Audible Signaling Devices Consumption by Country (2024-2029) & (K Units)
- Table 46. Asia-Pacific Versatile Visual and Audible Signaling Devices Consumption Market Share by Country (2024-2029)
- Table 47. Latin America Versatile Visual and Audible Signaling Devices Consumption Growth Rate by Country: 2018 VS 2022 VS 2029 (K Units)
- Table 48. Latin America Versatile Visual and Audible Signaling Devices Consumption by Country (2018-2023) & (K Units)
- Table 49. Latin America Versatile Visual and Audible Signaling Devices Consumption Market Share by Country (2018-2023)
- Table 50. Latin America Versatile Visual and Audible Signaling Devices Consumption by Country (2024-2029) & (K Units)
- Table 51. Latin America Versatile Visual and Audible Signaling Devices Consumption Market Share by Country (2024-2029)
- Table 52. Middle East & Africa Versatile Visual and Audible Signaling Devices Consumption Growth Rate by Country: 2018 VS 2022 VS 2029 (K Units)
- Table 53. Middle East & Africa Versatile Visual and Audible Signaling Devices Consumption by Country (2018-2023) & (K Units)
- Table 54. Middle East & Africa Versatile Visual and Audible Signaling Devices Consumption Market Share by Country (2018-2023)
- Table 55. Middle East & Africa Versatile Visual and Audible Signaling Devices Consumption by Country (2024-2029) & (K Units)
- Table 56. Middle East & Africa Versatile Visual and Audible Signaling Devices Consumption Market Share by Country (2024-2029)
- Table 57. Global Versatile Visual and Audible Signaling Devices Sales (K Units) by Type (2018-2023)
- Table 58. Global Versatile Visual and Audible Signaling Devices Sales (K Units) by Type (2024-2029)
- Table 59. Global Versatile Visual and Audible Signaling Devices Sales Market Share by Type (2018-2023)
- Table 60. Global Versatile Visual and Audible Signaling Devices Sales Market Share by Type (2024-2029)
- Table 61. Global Versatile Visual and Audible Signaling Devices Revenue (US$ Million) by Type (2018-2023)
- Table 62. Global Versatile Visual and Audible Signaling Devices Revenue (US$ Million) by Type (2024-2029)
- Table 63. Global Versatile Visual and Audible Signaling Devices Revenue Market Share by Type (2018-2023)
- Table 64. Global Versatile Visual and Audible Signaling Devices Revenue Market Share by Type (2024-2029)
- Table 65. Global Versatile Visual and Audible Signaling Devices Price (US$/Unit) by Type (2018-2023)
- Table 66. Global Versatile Visual and Audible Signaling Devices Price (US$/Unit) by Type (2024-2029)
- Table 67. Global Versatile Visual and Audible Signaling Devices Sales (K Units) by Application (2018-2023)
- Table 68. Global Versatile Visual and Audible Signaling Devices Sales (K Units) by Application (2024-2029)
- Table 69. Global Versatile Visual and Audible Signaling Devices Sales Market Share by Application (2018-2023)
- Table 70. Global Versatile Visual and Audible Signaling Devices Sales Market Share by Application (2024-2029)
- Table 71. Global Versatile Visual and Audible Signaling Devices Revenue (US$ Million) by Application (2018-2023)
- Table 72. Global Versatile Visual and Audible Signaling Devices Revenue (US$ Million) by Application (2024-2029)
- Table 73. Global Versatile Visual and Audible Signaling Devices Revenue Market Share by Application (2018-2023)
- Table 74. Global Versatile Visual and Audible Signaling Devices Revenue Market Share by Application (2024-2029)
- Table 75. Global Versatile Visual and Audible Signaling Devices Price (US$/Unit) by Application (2018-2023)
- Table 76. Global Versatile Visual and Audible Signaling Devices Price (US$/Unit) by Application (2024-2029)
- Table 77. Patlite Versatile Visual and Audible Signaling Devices Company Information
- Table 78. Patlite Versatile Visual and Audible Signaling Devices Specification and Application
- Table 79. Patlite Versatile Visual and Audible Signaling Devices Sales Volume (K Units), Revenue (US$ Million), Average Price (US$/Unit) and Gross Margin (2019-2023)
- Table 80. Patlite Main Business and Markets Served
- Table 81. Federal Signal Versatile Visual and Audible Signaling Devices Company Information
- Table 82. Federal Signal Versatile Visual and Audible Signaling Devices Specification and Application
- Table 83. Federal Signal Versatile Visual and Audible Signaling Devices Sales Volume (K Units), Revenue (US$ Million), Average Price (US$/Unit) and Gross Margin (2019-2023)
- Table 84. Federal Signal Main Business and Markets Served
- Table 85. Qlight Versatile Visual and Audible Signaling Devices Company Information
- Table 86. Qlight Versatile Visual and Audible Signaling Devices Specification and Application
- Table 87. Qlight Versatile Visual and Audible Signaling Devices Sales Volume (K Units), Revenue (US$ Million), Average Price (US$/Unit) and Gross Margin (2019-2023)
- Table 88. Qlight Main Business and Markets Served
- Table 89. Eaton Versatile Visual and Audible Signaling Devices Company Information
- Table 90. Eaton Versatile Visual and Audible Signaling Devices Specification and Application
- Table 91. Eaton Versatile Visual and Audible Signaling Devices Sales Volume (K Units), Revenue (US$ Million), Average Price (US$/Unit) and Gross Margin (2019-2023)
- Table 92. Eaton Main Business and Markets Served
- Table 93. Werma Signaltechnik Versatile Visual and Audible Signaling Devices Company Information
- Table 94. Werma Signaltechnik Versatile Visual and Audible Signaling Devices Specification and Application
- Table 95. Werma Signaltechnik Versatile Visual and Audible Signaling Devices Sales Volume (K Units), Revenue (US$ Million), Average Price (US$/Unit) and Gross Margin (2019-2023)
- Table 96. Werma Signaltechnik Main Business and Markets Served
- Table 97. Rockwell Automation Versatile Visual and Audible Signaling Devices Company Information
- Table 98. Rockwell Automation Versatile Visual and Audible Signaling Devices Specification and Application
- Table 99. Rockwell Automation Versatile Visual and Audible Signaling Devices Sales Volume (K Units), Revenue (US$ Million), Average Price (US$/Unit) and Gross Margin (2019-2023)
- Table 100. Rockwell Automation Main Business and Markets Served
- Table 101. Honeywell Versatile Visual and Audible Signaling Devices Company Information
- Table 102. Honeywell Versatile Visual and Audible Signaling Devices Specification and Application
- Table 103. Honeywell Versatile Visual and Audible Signaling Devices Sales Volume (K Units), Revenue (US$ Million), Average Price (US$/Unit) and Gross Margin (2019-2023)
- Table 104. Honeywell Main Business and Markets Served
- Table 105. Potter Electric Signal Versatile Visual and Audible Signaling Devices Company Information
- Table 106. Potter Electric Signal Versatile Visual and Audible Signaling Devices Specification and Application
- Table 107. Potter Electric Signal Versatile Visual and Audible Signaling Devices Sales Volume (K Units), Revenue (US$ Million), Average Price (US$/Unit) and Gross Margin (2019-2023)
- Table 108. Potter Electric Signal Main Business and Markets Served
- Table 109. Schneider Electric Versatile Visual and Audible Signaling Devices Company Information
- Table 110. Schneider Electric Versatile Visual and Audible Signaling Devices Specification and Application
- Table 111. Schneider Electric Versatile Visual and Audible Signaling Devices Sales Volume (K Units), Revenue (US$ Million), Average Price (US$/Unit) and Gross Margin (2019-2023)
- Table 112. Schneider Electric Main Business and Markets Served
- Table 113. Auer Signal Versatile Visual and Audible Signaling Devices Company Information
- Table 114. Auer Signal Versatile Visual and Audible Signaling Devices Specification and Application
- Table 115. Auer Signal Versatile Visual and Audible Signaling Devices Sales Volume (K Units), Revenue (US$ Million), Average Price (US$/Unit) and Gross Margin (2019-2023)
- Table 116. Auer Signal Main Business and Markets Served
- Table 117. E2S Warning Signals Versatile Visual and Audible Signaling Devices Company Information
- Table 118. E2S Warning Signals Versatile Visual and Audible Signaling Devices Specification and Application
- Table 119. E2S Warning Signals Versatile Visual and Audible Signaling Devices Sales Volume (K Units), Revenue (US$ Million), Average Price (US$/Unit) and Gross Margin (2019-2023)
- Table 120. E2S Warning Signals Main Business and Markets Served
- Table 121. R. Stahl Versatile Visual and Audible Signaling Devices Company Information
- Table 122. R. Stahl Versatile Visual and Audible Signaling Devices Specification and Application
- Table 123. R. Stahl Versatile Visual and Audible Signaling Devices Sales Volume (K Units), Revenue (US$ Million), Average Price (US$/Unit) and Gross Margin (2019-2023)
- Table 124. R. Stahl Main Business and Markets Served
- Table 125. Pfannenberg Versatile Visual and Audible Signaling Devices Company Information
- Table 126. Pfannenberg Versatile Visual and Audible Signaling Devices Specification and Application
- Table 127. Pfannenberg Versatile Visual and Audible Signaling Devices Sales Volume (K Units), Revenue (US$ Million), Average Price (US$/Unit) and Gross Margin (2019-2023)
- Table 128. Pfannenberg Main Business and Markets Served
- Table 129. Zhejiang Nanzhou Technology Versatile Visual and Audible Signaling Devices Company Information
- Table 130. Zhejiang Nanzhou Technology Versatile Visual and Audible Signaling Devices Specification and Application
- Table 131. Zhejiang Nanzhou Technology Versatile Visual and Audible Signaling Devices Sales Volume (K Units), Revenue (US$ Million), Average Price (US$/Unit) and Gross Margin (2019-2023)
- Table 132. Zhejiang Nanzhou Technology Main Business and Markets Served
- Table 133. Moflash Signalling Versatile Visual and Audible Signaling Devices Company Information
- Table 134. Moflash Signalling Versatile Visual and Audible Signaling Devices Specification and Application
- Table 135. Moflash Signalling Versatile Visual and Audible Signaling Devices Sales Volume (K Units), Revenue (US$ Million), Average Price (US$/Unit) and Gross Margin (2019-2023)
- Table 136. Moflash Signalling Main Business and Markets Served
- Table 137. Nanhua Electronics Versatile Visual and Audible Signaling Devices Company Information
- Table 138. Nanhua Electronics Versatile Visual and Audible Signaling Devices Specification and Application
- Table 139. Nanhua Electronics Versatile Visual and Audible Signaling Devices Sales Volume (K Units), Revenue (US$ Million), Average Price (US$/Unit) and Gross Margin (2019-2023)
- Table 140. Nanhua Electronics Main Business and Markets Served
- Table 141. Sirena Versatile Visual and Audible Signaling Devices Company Information
- Table 142. Sirena Versatile Visual and Audible Signaling Devices Specification and Application
- Table 143. Sirena Versatile Visual and Audible Signaling Devices Sales Volume (K Units), Revenue (US$ Million), Average Price (US$/Unit) and Gross Margin (2019-2023)
- Table 144. Sirena Main Business and Markets Served
- Table 145. Edwards Signaling Versatile Visual and Audible Signaling Devices Company Information
- Table 146. Edwards Signaling Versatile Visual and Audible Signaling Devices Specification and Application
- Table 147. Edwards Signaling Versatile Visual and Audible Signaling Devices Sales Volume (K Units), Revenue (US$ Million), Average Price (US$/Unit) and Gross Margin (2019-2023)
- Table 148. Edwards Signaling Main Business and Markets Served
- Table 149. Siemens Versatile Visual and Audible Signaling Devices Company Information
- Table 150. Siemens Versatile Visual and Audible Signaling Devices Specification and Application
- Table 151. Siemens Versatile Visual and Audible Signaling Devices Sales Volume (K Units), Revenue (US$ Million), Average Price (US$/Unit) and Gross Margin (2019-2023)
- Table 152. Siemens Main Business and Markets Served
- Table 153. Emerson Electric Versatile Visual and Audible Signaling Devices Company Information
- Table 154. Emerson Electric Versatile Visual and Audible Signaling Devices Specification and Application
- Table 155. Emerson Electric Versatile Visual and Audible Signaling Devices Sales Volume (K Units), Revenue (US$ Million), Average Price (US$/Unit) and Gross Margin (2019-2023)
- Table 156. Emerson Electric Main Business and Markets Served
- Table 157. Pepperl+Fuchs Versatile Visual and Audible Signaling Devices Company Information
- Table 158. Pepperl+Fuchs Versatile Visual and Audible Signaling Devices Specification and Application
- Table 159. Pepperl+Fuchs Versatile Visual and Audible Signaling Devices Sales Volume (K Units), Revenue (US$ Million), Average Price (US$/Unit) and Gross Margin (2019-2023)
- Table 160. Pepperl+Fuchs Main Business and Markets Served
- Table 161. D.G. Controls Versatile Visual and Audible Signaling Devices Company Information
- Table 162. D.G. Controls Versatile Visual and Audible Signaling Devices Specification and Application
- Table 163. D.G. Controls Versatile Visual and Audible Signaling Devices Sales Volume (K Units), Revenue (US$ Million), Average Price (US$/Unit) and Gross Margin (2019-2023)
- Table 164. D.G. Controls Main Business and Markets Served
- Table 165. Hanyoung Nux Versatile Visual and Audible Signaling Devices Company Information
- Table 166. Hanyoung Nux Versatile Visual and Audible Signaling Devices Specification and Application
- Table 167. Hanyoung Nux Versatile Visual and Audible Signaling Devices Sales Volume (K Units), Revenue (US$ Million), Average Price (US$/Unit) and Gross Margin (2019-2023)
- Table 168. Hanyoung Nux Main Business and Markets Served
- Table 169. Tomar Electronics Versatile Visual and Audible Signaling Devices Company Information
- Table 170. Tomar Electronics Versatile Visual and Audible Signaling Devices Specification and Application
- Table 171. Tomar Electronics Versatile Visual and Audible Signaling Devices Sales Volume (K Units), Revenue (US$ Million), Average Price (US$/Unit) and Gross Margin (2019-2023)
- Table 172. Tomar Electronics Main Business and Markets Served
- Table 173. Aximum Electronic Versatile Visual and Audible Signaling Devices Company Information
- Table 174. Aximum Electronic Versatile Visual and Audible Signaling Devices Specification and Application
- Table 175. Aximum Electronic Versatile Visual and Audible Signaling Devices Sales Volume (K Units), Revenue (US$ Million), Average Price (US$/Unit) and Gross Margin (2019-2023)
- Table 176. Aximum Electronic Main Business and Markets Served
- Table 177. Menics Versatile Visual and Audible Signaling Devices Company Information
- Table 178. Menics Versatile Visual and Audible Signaling Devices Specification and Application
- Table 179. Menics Versatile Visual and Audible Signaling Devices Sales Volume (K Units), Revenue (US$ Million), Average Price (US$/Unit) and Gross Margin (2019-2023)
- Table 180. Menics Main Business and Markets Served
- Table 181. Leuze electronic Versatile Visual and Audible Signaling Devices Company Information
- Table 182. Leuze electronic Versatile Visual and Audible Signaling Devices Specification and Application
- Table 183. Leuze electronic Versatile Visual and Audible Signaling Devices Sales Volume (K Units), Revenue (US$ Million), Average Price (US$/Unit) and Gross Margin (2019-2023)
- Table 184. Leuze electronic Main Business and Markets Served
- Table 185. Key Raw Materials Lists
- Table 186. Raw Materials Key Suppliers Lists
- Table 187. Versatile Visual and Audible Signaling Devices Distributors List
- Table 188. Versatile Visual and Audible Signaling Devices Customers List
- Table 189. Versatile Visual and Audible Signaling Devices Market Trends
- Table 190. Versatile Visual and Audible Signaling Devices Market Drivers
- Table 191. Versatile Visual and Audible Signaling Devices Market Challenges
- Table 192. Research Programs/Design for This Report
- Table 193. Key Data Information from Secondary Sources
- Table 194. Key Data Information from Primary Sources
- Table 195. Authors List of This Report
List of Figures
- Figure 1. Product Picture of Versatile Visual and Audible Signaling Devices
- Figure 2. Global Versatile Visual and Audible Signaling Devices Market Share by Type: 2022 VS 2029
- Figure 3. Global Versatile Visual and Audible Signaling Devices Market Share by Application: 2022 VS 2029
- Figure 4. Global Versatile Visual and Audible Signaling Devices Revenue (US$ Million), 2018 VS 2023 VS 2029
- Figure 5. Global Versatile Visual and Audible Signaling Devices Revenue (US$ Million) & (2018-2029)
- Figure 6. Global Versatile Visual and Audible Signaling Devices Production (K Units) & (2018-2029)
- Figure 7. Global Versatile Visual and Audible Signaling Devices Average Price (US$/Unit) & (2018-2029)
- Figure 8. Versatile Visual and Audible Signaling Devices Report Years Considered
- Figure 9. Versatile Visual and Audible Signaling Devices Market Share by Company Type (Tier 1, Tier 2, and Tier 3): 2021 VS 2022
- Figure 10. The Global 5 and 10 Largest Players: Market Share by Versatile Visual and Audible Signaling Devices Revenue in 2022
- Figure 11. North America Versatile Visual and Audible Signaling Devices Production Value (US$ Million) Growth Rate (2018-2029)
- Figure 12. Europe Versatile Visual and Audible Signaling Devices Production Value (US$ Million) Growth Rate (2018-2029)
- Figure 13. China Versatile Visual and Audible Signaling Devices Production Value (US$ Million) Growth Rate (2018-2029)
- Figure 14. Japan Versatile Visual and Audible Signaling Devices Production Value (US$ Million) Growth Rate (2018-2029)
- Figure 15. North America Versatile Visual and Audible Signaling Devices Consumption and Growth Rate (2018-2029) & (K Units)
- Figure 16. USA Versatile Visual and Audible Signaling Devices Consumption and Growth Rate (2018-2029) & (K Units)
- Figure 17. Canada Versatile Visual and Audible Signaling Devices Consumption and Growth Rate (2018-2029) & (K Units)
- Figure 18. Europe Versatile Visual and Audible Signaling Devices Consumption and Growth Rate (2018-2029) & (K Units)
- Figure 19. Germany Versatile Visual and Audible Signaling Devices Consumption and Growth Rate (2018-2029) & (K Units)
- Figure 20. UK Versatile Visual and Audible Signaling Devices Consumption and Growth Rate (2018-2029) & (K Units)
- Figure 21. France Versatile Visual and Audible Signaling Devices Consumption and Growth Rate (2018-2029) & (K Units)
- Figure 22. Russia Versatile Visual and Audible Signaling Devices Consumption and Growth Rate (2018-2029) & (K Units)
- Figure 23. Italy Versatile Visual and Audible Signaling Devices Consumption and Growth Rate (2018-2029) & (K Units)
- Figure 24. Asia-Pacific Versatile Visual and Audible Signaling Devices Consumption and Growth Rate (2018-2029) & (K Units)
- Figure 25. China Versatile Visual and Audible Signaling Devices Consumption and Growth Rate (2018-2029) & (K Units)
- Figure 26. Japan Versatile Visual and Audible Signaling Devices Consumption and Growth Rate (2018-2029) & (K Units)
- Figure 27. Korea Versatile Visual and Audible Signaling Devices Consumption and Growth Rate (2018-2029) & (K Units)
- Figure 28. Southeast Asia Versatile Visual and Audible Signaling Devices Consumption and Growth Rate (2018-2029) & (K Units)
- Figure 29. India Versatile Visual and Audible Signaling Devices Consumption and Growth Rate (2018-2029) & (K Units)
- Figure 30. Taiwan Versatile Visual and Audible Signaling Devices Consumption and Growth Rate (2018-2029) & (K Units)
- Figure 31. Australia Versatile Visual and Audible Signaling Devices Consumption and Growth Rate (2018-2029) & (K Units)
- Figure 32. Latin America Versatile Visual and Audible Signaling Devices Consumption and Growth Rate (2018-2029) & (K Units)
- Figure 33. Mexico Versatile Visual and Audible Signaling Devices Consumption and Growth Rate (2018-2029) & (K Units)
- Figure 34. Brazil Versatile Visual and Audible Signaling Devices Consumption and Growth Rate (2018-2029) & (K Units)
- Figure 35. Argentina Versatile Visual and Audible Signaling Devices Consumption and Growth Rate (2018-2029) & (K Units)
- Figure 36. Middle East & Africa Versatile Visual and Audible Signaling Devices Consumption and Growth Rate (2018-2029) & (K Units)
- Figure 37. Middle East Versatile Visual and Audible Signaling Devices Consumption and Growth Rate (2018-2029) & (K Units)
- Figure 38. Africa Versatile Visual and Audible Signaling Devices Consumption and Growth Rate (2018-2029) & (K Units)
- Figure 39. Versatile Visual and Audible Signaling Devices Value Chain
- Figure 40. Global Versatile Visual and Audible Signaling Devices Manufacturing Costs Percentage in 2022
- Figure 41. Distributors Profiles
- Figure 42. Bottom-up and Top-down Approaches for This Report
- Figure 43. Data Triangulation
The global Versatile Visual and Audible Signaling Devices market was valued at US$ 881.45 million in 2022 and is anticipated to reach US$ 1.20 billion by 2029, witnessing a CAGR of 4.70% during the forecast period 2023-2029. The influence of COVID-19 and the Russia-Ukraine War were considered while estimating market sizes.
North American market for Versatile Visual and Audible Signaling Devices is estimated to increase from $ 254.06 million in 2023 to reach $ 328.31 million by 2029, at a CAGR of 4.37% during the forecast period of 2023 through 2029.
Asia-Pacific market for Versatile Visual and Audible Signaling Devices is estimated to increase from $ 304.05 million in 2023 to reach $ 418.34 million by 2029, at a CAGR of 5.46% during the forecast period of 2023 through 2029.
The major global manufacturers of Versatile Visual and Audible Signaling Devices include: Patlite, Federal Signal, Qlight, Eaton, Werma Signaltechnik, Rockwell Automation, Honeywell, Potter Electric Signal, and Schneider Electric, etc. In 2022, the world's top three vendors accounted for approximately 29.77% of the revenue.
Report Scope
This report aims to provide a comprehensive presentation of the global market for Versatile Visual and Audible Signaling Devices, with both quantitative and qualitative analysis, to help readers develop business/growth strategies, assess the market competitive situation, analyze their position in the current marketplace, and make informed business decisions regarding Versatile Visual and Audible Signaling Devices.
The Versatile Visual and Audible Signaling Devices market size, estimations, and forecasts are provided in terms of output/shipments (K Units) and revenue ($ millions), considering 2022 as the base year, with history and forecast data for the period from 2018 to 2029. This report segments the global Versatile Visual and Audible Signaling Devices market comprehensively. Regional market sizes, concerning products by Type, by Application, and by players, are also provided.
For a more in-depth understanding of the market, the report provides profiles of the competitive landscape, key competitors, and their respective market ranks. The report also discusses technological trends and new product developments.
The report will help the Versatile Visual and Audible Signaling Devices manufacturers, new entrants, and industry chain related companies in this market with information on the revenues, production, and average price for the overall market and the sub-segments across the different segments, by company, by Type, by Application, and by regions.
By Company
- Patlite
- Federal Signal
- Qlight
- Eaton
- Werma Signaltechnik
- Rockwell Automation
- Honeywell
- Potter Electric Signal
- Schneider Electric
- Auer Signal
- E2S Warning Signals
- R. Stahl
- Pfannenberg
- Zhejiang Nanzhou Technology
- Moflash Signalling
- Nanhua Electronics
- Sirena
- Edwards Signaling
- Siemens
- Emerson Electric
- Pepperl+Fuchs
- D.G. Controls
- Hanyoung Nux
- Tomar Electronics
- Aximum Electronic
- Menics
- Leuze electronic
by Type
- Acoustic Signaling Devices
- Luminous Signaling Devices
- Combined Signaling Devices
by Application
- Oil and Gas
- Manufacturing
- Commercial
- Energy and Power
- Mining
- Others
Production by Region
- North America
- Europe
- China
- Japan
- Others
Consumption by Region
- North America
- USA
- Canada
- Asia-Pacific
- China
- Japan
- Korea
- Southeast Asia
- India
- Taiwan
- Australia
- Others
- Europe
- Germany
- UK
- France
- Russia
- Italy
- Rest of Europe
- Latin America
- Mexico
- Brazil
- Argentina
- Rest of Latin America
Core Chapters
Chapter 1: Introduces the report scope of the report, executive summary of different market segments (by region, by Type, by Application, etc), including the market size of each market segment, future development potential, and so on. It offers a high-level view of the current state of the market and its likely evolution in the short to mid-term, and long term.
Chapter 2: Detailed analysis of Versatile Visual and Audible Signaling Devices manufacturers competitive landscape, price, production and value market share, latest development plan, merger, and acquisition information, etc.
Chapter 3: Production/output, value of Versatile Visual and Audible Signaling Devices by region/country. It provides a quantitative analysis of the market size and development potential of each region in the next six years.
Chapter 4: Consumption of Versatile Visual and Audible Signaling Devices in regional level and country level. It provides a quantitative analysis of the market size and development potential of each region and its main countries and introduces the market development, future development prospects, market space, and production of each country in the world.
Chapter 5: Provides the analysis of various market segments by Type, covering the market size and development potential of each market segment, to help readers find the blue ocean market in different market segments.
Chapter 6: Provides the analysis of various market segments by Application, covering the market size and development potential of each market segment, to help readers find the blue ocean market in different downstream markets.
Chapter 7: Provides profiles of key players, introducing the basic situation of the main companies in the market in detail, including product production/output, value, price, gross margin, product introduction, etc.
Chapter 8: Analysis of industrial chain, including the upstream and downstream of the industry.
Chapter 9: Introduces the market dynamics, latest developments of the market, the driving factors and restrictive factors of the market, the challenges and risks faced by manufacturers in the industry, and the analysis of relevant policies in the industry.
Chapter 10: The main points and conclusions of the report.
Table of Contents
1 Versatile Visual and Audible Signaling Devices Market Overview
- 1.1 Product Definition
- 1.2 Versatile Visual and Audible Signaling Devices by Type
- 1.3 Versatile Visual and Audible Signaling Devices by Application
- 1.4 Global Market Growth Prospects
- 1.4.1 Global Versatile Visual and Audible Signaling Devices Production Value Estimates and Forecasts (2018-2029)
- 1.4.2 Global Versatile Visual and Audible Signaling Devices Production Estimates and Forecasts (2018-2029)
- 1.4.3 Global Versatile Visual and Audible Signaling Devices Market Average Price Estimates and Forecasts (2018-2029)
- 1.5 Assumptions and Limitations
2 Market Competition by Manufacturers
- 2.1 Global Versatile Visual and Audible Signaling Devices Sales Market Share by Manufacturers (2019-2023)
- 2.2 Global Versatile Visual and Audible Signaling Devices Revenue Market Share by Manufacturers (2019-2023)
- 2.3 Global Key Players of Versatile Visual and Audible Signaling Devices, Industry Ranking, 2021 VS 2022
- 2.4 Global Versatile Visual and Audible Signaling Devices Market Share by Company Type (Tier 1, Tier 2, and Tier 3)
- 2.5 Global Versatile Visual and Audible Signaling Devices Average Price by Manufacturers (2019-2023)
- 2.6 Global Key Manufacturers of Versatile Visual and Audible Signaling Devices, Manufacturing Sites & Headquarters
- 2.7 Global Key Manufacturers of Versatile Visual and Audible Signaling Devices Product Type
- 2.8 Global Key Manufacturers of Versatile Visual and Audible Signaling Devices Sales Regions
- 2.9 Global Versatile Visual and Audible Signaling Devices Market Competitive Situation and Trends
- 2.9.1 Global Versatile Visual and Audible Signaling Devices Market Concentration Rate
- 2.9.2 Global 5 and 10 Largest Versatile Visual and Audible Signaling Devices Players Market Share by Revenue
3 Versatile Visual and Audible Signaling Devices Production by Region
- 3.1 Global Versatile Visual and Audible Signaling Devices Production Value Estimates and Forecasts by Region: 2018 VS 2022 VS 2029
- 3.2 Global Versatile Visual and Audible Signaling Devices Production Value by Region (2018-2029)
- 3.2.1 Global Versatile Visual and Audible Signaling Devices Production Value Market Share by Region (2018-2023)
- 3.2.2 Global Forecasted Production Value of Versatile Visual and Audible Signaling Devices by Region (2024-2029)
- 3.3 Global Versatile Visual and Audible Signaling Devices Production Estimates and Forecasts by Region: 2018 VS 2022 VS 2029
- 3.4 Global Versatile Visual and Audible Signaling Devices Production by Region (2018-2029)
- 3.4.1 Global Versatile Visual and Audible Signaling Devices Production Market Share by Region (2018-2023)
- 3.4.2 Global Forecasted Production of Versatile Visual and Audible Signaling Devices by Region (2024-2029)
- 3.5 Global Versatile Visual and Audible Signaling Devices Market Price Analysis by Region (2018-2023)
- 3.6 Global Versatile Visual and Audible Signaling Devices Production and Value, Year-over-Year Growth
- 3.6.1 North America Versatile Visual and Audible Signaling Devices Production Value Estimates and Forecasts (2018-2029)
- 3.6.2 Europe Versatile Visual and Audible Signaling Devices Production Value Estimates and Forecasts (2018-2029)
- 3.6.3 China Versatile Visual and Audible Signaling Devices Production Value Estimates and Forecasts (2018-2029)
- 3.6.4 Japan Versatile Visual and Audible Signaling Devices Production Value Estimates and Forecasts (2018-2029)
4 Versatile Visual and Audible Signaling Devices Consumption by Region
- 4.1 Global Versatile Visual and Audible Signaling Devices Consumption Estimates and Forecasts by Region: 2018 VS 2022 VS 2029
- 4.2 Global Versatile Visual and Audible Signaling Devices Consumption by Region (2018-2029)
- 4.2.1 Global Versatile Visual and Audible Signaling Devices Consumption by Region (2018-2029)
- 4.2.2 Global Versatile Visual and Audible Signaling Devices Forecasted Consumption by Region (2024-2029)
- 4.3 North America
- 4.3.1 North America Versatile Visual and Audible Signaling Devices Consumption Growth Rate by Country: 2018 VS 2022 VS 2029
- 4.3.2 North America Versatile Visual and Audible Signaling Devices Consumption by Country (2018-2029)
- 4.3.3 USA
- 4.3.4 Canada
- 4.4 Europe
- 4.4.1 Europe Versatile Visual and Audible Signaling Devices Consumption Growth Rate by Country: 2018 VS 2022 VS 2029
- 4.4.2 Europe Versatile Visual and Audible Signaling Devices Consumption by Country (2018-2029)
- 4.4.3 Germany
- 4.4.4 UK
- 4.4.5 France
- 4.4.6 Russia
- 4.4.7 Italy
- 4.5 Asia-Pacific
- 4.5.1 Asia-Pacific Versatile Visual and Audible Signaling Devices Consumption Growth Rate by Country: 2018 VS 2022 VS 2029
- 4.5.2 Asia-Pacific Versatile Visual and Audible Signaling Devices Consumption by Country (2018-2029)
- 4.5.3 China
- 4.5.4 Japan
- 4.5.5 Korea
- 4.5.6 Southeast Asia
- 4.5.7 India
- 4.5.8 Taiwan
- 4.5.9 Australia
- 4.6 Latin America
- 4.6.1 Latin America Versatile Visual and Audible Signaling Devices Consumption Growth Rate by Country: 2018 VS 2022 VS 2029
- 4.6.2 Latin America Versatile Visual and Audible Signaling Devices Consumption by Country (2018-2029)
- 4.6.3 Mexico
- 4.6.4 Brazil
- 4.6.5 Argentina
- 4.7 Middle East & Africa
- 4.7.1 Middle East & Africa Versatile Visual and Audible Signaling Devices Consumption Growth Rate by Country: 2018 VS 2022 VS 2029
- 4.7.2 Middle East & Africa Versatile Visual and Audible Signaling Devices Consumption by Country (2018-2029)
- 4.7.3 Middle East
- 4.7.4 Africa
5 Segment by Type
- 5.1 Global Versatile Visual and Audible Signaling Devices Sales by Type (2018-2029)
- 5.1.1 Global Versatile Visual and Audible Signaling Devices Sales by Type (2018-2023)
- 5.1.2 Global Versatile Visual and Audible Signaling Devices Sales by Type (2024-2029)
- 5.1.3 Global Versatile Visual and Audible Signaling Devices Sales Market Share by Type (2018-2029)
- 5.2 Global Versatile Visual and Audible Signaling Devices Revenue by Type (2018-2029)
- 5.2.1 Global Versatile Visual and Audible Signaling Devices Revenue by Type (2018-2023)
- 5.2.2 Global Versatile Visual and Audible Signaling Devices Revenue by Type (2024-2029)
- 5.2.3 Global Versatile Visual and Audible Signaling Devices Revenue Market Share by Type (2018-2029)
- 5.3 Global Versatile Visual and Audible Signaling Devices Price by Type (2018-2029)
6 Segment by Application
- 6.1 Global Versatile Visual and Audible Signaling Devices Sales by Application (2018-2029)
- 6.1.1 Global Versatile Visual and Audible Signaling Devices Sales by Application (2018-2023)
- 6.1.2 Global Versatile Visual and Audible Signaling Devices Sales by Application (2024-2029)
- 6.1.3 Global Versatile Visual and Audible Signaling Devices Sales Market Share by Application (2018-2029)
- 6.2 Global Versatile Visual and Audible Signaling Devices Revenue by Application (2018-2029)
- 6.2.1 Global Versatile Visual and Audible Signaling Devices Revenue by Application (2018-2023)
- 6.2.2 Global Versatile Visual and Audible Signaling Devices Revenue by Application (2024-2029)
- 6.2.3 Global Versatile Visual and Audible Signaling Devices Revenue Market Share by Application (2018-2029)
- 6.3 Global Versatile Visual and Audible Signaling Devices Price by Application (2018-2029)
7 Key Companies Profiled
- 7.1 Patlite
- 7.1.1 Patlite Versatile Visual and Audible Signaling Devices Company Information
- 7.1.2 Patlite Versatile Visual and Audible Signaling Devices Product Portfolio
- 7.1.3 Patlite Versatile Visual and Audible Signaling Devices Sale Volume, Revenue, Average Price and Gross Margin (2019-2023)
- 7.1.4 Patlite Main Business and Markets Served
- 7.2 Federal Signal
- 7.2.1 Federal Signal Versatile Visual and Audible Signaling Devices Company Information
- 7.2.2 Federal Signal Versatile Visual and Audible Signaling Devices Product Portfolio
- 7.2.3 Federal Signal Versatile Visual and Audible Signaling Devices Sale Volume, Revenue, Average Price and Gross Margin (2019-2023)
- 7.2.4 Federal Signal Main Business and Markets Served
- 7.3 Qlight
- 7.3.1 Qlight Versatile Visual and Audible Signaling Devices Company Information
- 7.3.2 Qlight Versatile Visual and Audible Signaling Devices Product Portfolio
- 7.3.3 Qlight Versatile Visual and Audible Signaling Devices Sale Volume, Revenue, Average Price and Gross Margin (2019-2023)
- 7.3.4 Qlight Main Business and Markets Served
- 7.4 Eaton
- 7.4.1 Eaton Versatile Visual and Audible Signaling Devices Company Information
- 7.4.2 Eaton Versatile Visual and Audible Signaling Devices Product Portfolio
- 7.4.3 Eaton Versatile Visual and Audible Signaling Devices Sale Volume, Revenue, Average Price and Gross Margin (2019-2023)
- 7.4.4 Eaton Main Business and Markets Served
- 7.5 Werma Signaltechnik
- 7.5.1 Werma Signaltechnik Versatile Visual and Audible Signaling Devices Company Information
- 7.5.2 Werma Signaltechnik Versatile Visual and Audible Signaling Devices Product Portfolio
- 7.5.3 Werma Signaltechnik Versatile Visual and Audible Signaling Devices Sale Volume, Revenue, Average Price and Gross Margin (2019-2023)
- 7.5.4 Werma Signaltechnik Main Business and Markets Served
- 7.6 Rockwell Automation
- 7.6.1 Rockwell Automation Versatile Visual and Audible Signaling Devices Company Information
- 7.6.2 Rockwell Automation Versatile Visual and Audible Signaling Devices Product Portfolio
- 7.6.3 Rockwell Automation Versatile Visual and Audible Signaling Devices Sale Volume, Revenue, Average Price and Gross Margin (2019-2023)
- 7.6.4 Rockwell Automation Main Business and Markets Served
- 7.7 Honeywell
- 7.7.1 Honeywell Versatile Visual and Audible Signaling Devices Company Information
- 7.7.2 Honeywell Versatile Visual and Audible Signaling Devices Product Portfolio
- 7.7.3 Honeywell Versatile Visual and Audible Signaling Devices Sale Volume, Revenue, Average Price and Gross Margin (2019-2023)
- 7.7.4 Honeywell Main Business and Markets Served
- 7.8 Potter Electric Signal
- 7.8.1 Potter Electric Signal Versatile Visual and Audible Signaling Devices Company Information
- 7.8.2 Potter Electric Signal Versatile Visual and Audible Signaling Devices Product Portfolio
- 7.8.3 Potter Electric Signal Versatile Visual and Audible Signaling Devices Sale Volume, Revenue, Average Price and Gross Margin (2019-2023)
- 7.8.4 Potter Electric Signal Main Business and Markets Served
- 7.9 Schneider Electric
- 7.9.1 Schneider Electric Versatile Visual and Audible Signaling Devices Company Information
- 7.9.2 Schneider Electric Versatile Visual and Audible Signaling Devices Product Portfolio
- 7.9.3 Schneider Electric Versatile Visual and Audible Signaling Devices Sale Volume, Revenue, Average Price and Gross Margin (2019-2023)
- 7.9.4 Schneider Electric Main Business and Markets Served
- 7.10 Auer Signal
- 7.10.1 Auer Signal Versatile Visual and Audible Signaling Devices Company Information
- 7.10.2 Auer Signal Versatile Visual and Audible Signaling Devices Product Portfolio
- 7.10.3 Auer Signal Versatile Visual and Audible Signaling Devices Sale Volume, Revenue, Average Price and Gross Margin (2019-2023)
- 7.10.4 Auer Signal Main Business and Markets Served
- 7.11 E2S Warning Signals
- 7.11.1 E2S Warning Signals Versatile Visual and Audible Signaling Devices Company Information
- 7.11.2 E2S Warning Signals Versatile Visual and Audible Signaling Devices Product Portfolio
- 7.11.3 E2S Warning Signals Versatile Visual and Audible Signaling Devices Sale Volume, Revenue, Average Price and Gross Margin (2019-2023)
- 7.11.4 E2S Warning Signals Main Business and Markets Served
- 7.12 R. Stahl
- 7.12.1 R. Stahl Versatile Visual and Audible Signaling Devices Company Information
- 7.12.2 R. Stahl Versatile Visual and Audible Signaling Devices Product Portfolio
- 7.12.3 R. Stahl Versatile Visual and Audible Signaling Devices Sale Volume, Revenue, Average Price and Gross Margin (2019-2023)
- 7.12.4 R. Stahl Main Business and Markets Served
- 7.13 Pfannenberg
- 7.13.1 Pfannenberg Versatile Visual and Audible Signaling Devices Company Information
- 7.13.2 Pfannenberg Versatile Visual and Audible Signaling Devices Product Portfolio
- 7.13.3 Pfannenberg Versatile Visual and Audible Signaling Devices Sale Volume, Revenue, Average Price and Gross Margin (2019-2023)
- 7.13.4 Pfannenberg Main Business and Markets Served
- 7.14 Zhejiang Nanzhou Technology
- 7.14.1 Zhejiang Nanzhou Technology Versatile Visual and Audible Signaling Devices Company Information
- 7.14.2 Zhejiang Nanzhou Technology Versatile Visual and Audible Signaling Devices Product Portfolio
- 7.14.3 Zhejiang Nanzhou Technology Versatile Visual and Audible Signaling Devices Sale Volume, Revenue, Average Price and Gross Margin (2019-2023)
- 7.14.4 Zhejiang Nanzhou Technology Main Business and Markets Served
- 7.15 Moflash Signalling
- 7.15.1 Moflash Signalling Versatile Visual and Audible Signaling Devices Company Information
- 7.15.2 Moflash Signalling Versatile Visual and Audible Signaling Devices Product Portfolio
- 7.15.3 Moflash Signalling Versatile Visual and Audible Signaling Devices Sale Volume, Revenue, Average Price and Gross Margin (2019-2023)
- 7.15.4 Moflash Signalling Main Business and Markets Served
- 7.16 Nanhua Electronics
- 7.16.1 Nanhua Electronics Versatile Visual and Audible Signaling Devices Company Information
- 7.16.2 Nanhua Electronics Versatile Visual and Audible Signaling Devices Product Portfolio
- 7.16.3 Nanhua Electronics Versatile Visual and Audible Signaling Devices Sale Volume, Revenue, Average Price and Gross Margin (2019-2023)
- 7.16.4 Nanhua Electronics Main Business and Markets Served
- 7.17 Sirena
- 7.17.1 Sirena Versatile Visual and Audible Signaling Devices Company Information
- 7.17.2 Sirena Versatile Visual and Audible Signaling Devices Product Portfolio
- 7.17.3 Sirena Versatile Visual and Audible Signaling Devices Sale Volume, Revenue, Average Price and Gross Margin (2019-2023)
- 7.17.4 Sirena Main Business and Markets Served
- 7.18 Edwards Signaling
- 7.18.1 Edwards Signaling Versatile Visual and Audible Signaling Devices Company Information
- 7.18.2 Edwards Signaling Versatile Visual and Audible Signaling Devices Product Portfolio
- 7.18.3 Edwards Signaling Versatile Visual and Audible Signaling Devices Sale Volume, Revenue, Average Price and Gross Margin (2019-2023)
- 7.18.4 Edwards Signaling Main Business and Markets Served
- 7.19 Siemens
- 7.19.1 Siemens Versatile Visual and Audible Signaling Devices Company Information
- 7.19.2 Siemens Versatile Visual and Audible Signaling Devices Product Portfolio
- 7.19.3 Siemens Versatile Visual and Audible Signaling Devices Sale Volume, Revenue, Average Price and Gross Margin (2019-2023)
- 7.19.4 Siemens Main Business and Markets Served
- 7.20 Emerson Electric
- 7.20.1 Emerson Electric Versatile Visual and Audible Signaling Devices Company Information
- 7.20.2 Emerson Electric Versatile Visual and Audible Signaling Devices Product Portfolio
- 7.20.3 Emerson Electric Versatile Visual and Audible Signaling Devices Sale Volume, Revenue, Average Price and Gross Margin (2019-2023)
- 7.20.4 Emerson Electric Main Business and Markets Served
- 7.21 Pepperl+Fuchs
- 7.21.1 Pepperl+Fuchs Versatile Visual and Audible Signaling Devices Company Information
- 7.21.2 Pepperl+Fuchs Versatile Visual and Audible Signaling Devices Product Portfolio
- 7.21.3 Pepperl+Fuchs Versatile Visual and Audible Signaling Devices Sale Volume, Revenue, Average Price and Gross Margin (2019-2023)
- 7.21.4 Pepperl+Fuchs Main Business and Markets Served
- 7.22 D.G. Controls
- 7.22.1 D.G. Controls Versatile Visual and Audible Signaling Devices Company Information
- 7.22.2 D.G. Controls Versatile Visual and Audible Signaling Devices Product Portfolio
- 7.22.3 D.G. Controls Versatile Visual and Audible Signaling Devices Sale Volume, Revenue, Average Price and Gross Margin (2019-2023)
- 7.22.4 D.G. Controls Main Business and Markets Served
- 7.23 Hanyoung Nux
- 7.23.1 Hanyoung Nux Versatile Visual and Audible Signaling Devices Company Information
- 7.23.2 Hanyoung Nux Versatile Visual and Audible Signaling Devices Product Portfolio
- 7.23.3 Hanyoung Nux Versatile Visual and Audible Signaling Devices Sale Volume, Revenue, Average Price and Gross Margin (2019-2023)
- 7.23.4 Hanyoung Nux Main Business and Markets Served
- 7.24 Tomar Electronics
- 7.24.1 Tomar Electronics Versatile Visual and Audible Signaling Devices Company Information
- 7.24.2 Tomar Electronics Versatile Visual and Audible Signaling Devices Product Portfolio
- 7.24.3 Tomar Electronics Versatile Visual and Audible Signaling Devices Sale Volume, Revenue, Average Price and Gross Margin (2019-2023)
- 7.24.4 Tomar Electronics Main Business and Markets Served
- 7.25 Aximum Electronic
- 7.25.1 Aximum Electronic Versatile Visual and Audible Signaling Devices Company Information
- 7.25.2 Aximum Electronic Versatile Visual and Audible Signaling Devices Product Portfolio
- 7.25.3 Aximum Electronic Versatile Visual and Audible Signaling Devices Sale Volume, Revenue, Average Price and Gross Margin (2019-2023)
- 7.25.4 Aximum Electronic Main Business and Markets Served
- 7.26 Menics
- 7.26.1 Menics Versatile Visual and Audible Signaling Devices Company Information
- 7.26.2 Menics Versatile Visual and Audible Signaling Devices Product Portfolio
- 7.26.3 Menics Versatile Visual and Audible Signaling Devices Sale Volume, Revenue, Average Price and Gross Margin (2019-2023)
- 7.26.4 Menics Main Business and Markets Served
- 7.27 Leuze electronic
- 7.27.1 Leuze electronic Versatile Visual and Audible Signaling Devices Company Information
- 7.27.2 Leuze electronic Versatile Visual and Audible Signaling Devices Product Portfolio
- 7.27.3 Leuze electronic Versatile Visual and Audible Signaling Devices Sale Volume, Revenue, Average Price and Gross Margin (2019-2023)
- 7.27.4 Leuze electronic Main Business and Markets Served
8 Industry Chain and Sales Channels Analysis
- 8.1 Versatile Visual and Audible Signaling Devices Industry Chain Analysis
- 8.2 Versatile Visual and Audible Signaling Devices Key Raw Materials
- 8.2.1 Key Raw Materials
- 8.2.2 Raw Materials Key Suppliers
- 8.3 Versatile Visual and Audible Signaling Devices Manufacturing Costs Percentage
- 8.4 Versatile Visual and Audible Signaling Devices Sales and Marketing
- 8.5 Versatile Visual and Audible Signaling Devices Customers
9 Versatile Visual and Audible Signaling Devices Market Dynamics
- 9.1 Versatile Visual and Audible Signaling Devices Industry Trends
- 9.2 Versatile Visual and Audible Signaling Devices Market Drivers
- 9.3 Versatile Visual and Audible Signaling Devices Market Challenges
10 Research Findings and Conclusion
11 Methodology and Data Source
- 11.1 Methodology/Research Approach
- 11.1.1 Research Programs/Design
- 11.1.2 Market Size Estimation
- 11.1.3 Market Breakdown and Data Triangulation
- 11.2 Data Source
- 11.2.1 Secondary Sources
- 11.2.2 Primary Sources
- 11.3 Author List
- 11.4 Disclaimer
