|
|
市場調査レポート
商品コード
1358937
再循環養殖システムの世界市場:~2029年Global Recirculation Aquaculture System Market Insights, Forecast to 2029 |
||||||
|
|
|||||||
カスタマイズ可能
適宜更新あり
|
|||||||


| 再循環養殖システムの世界市場:~2029年 |
|
出版日: 2023年10月10日
発行: QYResearch
ページ情報: 英文 171 Pages
納期: 2~3営業日
|

- 全表示
- 概要
- 図表
- 目次
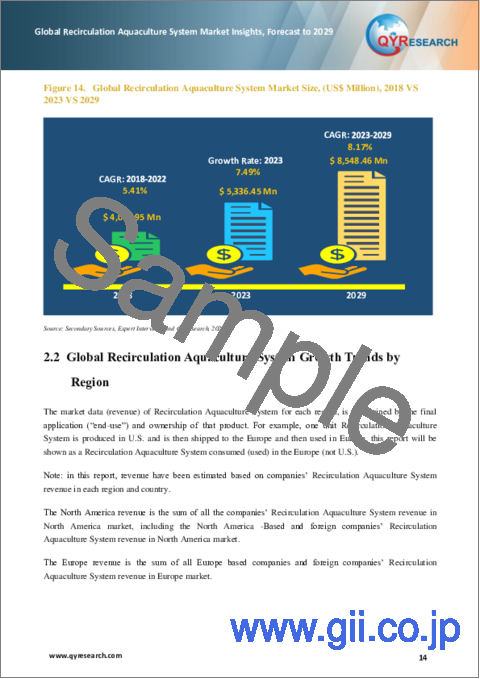
世界の再循環養殖システムの市場規模は、2023年の53億3,645万万米ドルから、予測期間中に8.17%のCAGRで推移し、2029年には85億4,846万米ドルの規模に成長すると予測されています。
地域別で見ると、北米市場は2023年の12億8,243万米ドルから、予測期間中に8.15%のCAGRで推移し、2029年には20億5,202万米ドルの規模に成長すると予測されています。また、欧州市場は2023年の14億5,068万米ドルから、7.85%のCAGRで推移し、2029年には22億8,346万米ドルに達すると予測されています。さらに、アジア太平洋市場は2023年の21億6,018万米ドルから、8.47%のCAGRで推移し、2029年には35億1,929万米ドルに達すると予測されています。
世界のベンダー上位5社の2022年における収益シェアは全体の約12.69%を示しています。
当レポートでは、世界の再循環養殖システムの市場を調査し、市場および製品の概要、競合情勢、市場規模の推移・予測、各種区分・地域/主要国別の詳細分析、価格動向、市場成長への各種影響因子の分析、主要企業の分析などをまとめています。
目次
第1章 レポートの概要
- 調査範囲
- 再循環養殖システムの主要コンポーネント
- タイプ別市場分析
- 成長率:2018年 vs 2023年 vs 2029年
- クローズド型
- セミクローズド型
- 用途別市場
- 成長率:2018年 vs 2023年 vs 2029年
- 屋内システム
- 屋外システム
- 前提・制限
- 調査目的
- 調査年数
第2章 世界の成長動向
- 市場の展望
- 成長動向:地域別
- 市場規模:2018 vs 2022 vs 2029
- 市場規模の推移
- 市場規模の予測
- 市場力学
- 産業動向
- 市場促進要因
- 市場課題
- 市場抑制要因
第3章 競合情勢:主要企業別
- 主要企業の収益・収益シェアの推移
- 市場シェア:企業タイプ別
- 主要企業ランキング:収益別
- 市場集中率
- 主要企業の本社およびサービス提供エリア
- 主要企業の製品・用途
- 主要企業の参入日
- M&A・拡張計画
第4章 循環式養殖システムの内訳データ:タイプ別
- 市場規模の推移・予測
第5章 循環式養殖システムの内訳データ:用途別
- 市場規模の推移・予測
第6章 北米
第7章 欧州
第8章 アジア太平洋
第9章 ラテンアメリカ
第10章 中東・アフリカ
第11章 主要企業のプロファイル
- Skretting
- Xylem
- RADAQUA
- PR Aqua
- AquaMaof
- Billund Aquaculture
- AKVA Group
- Hesy Aquaculture
- Aquacare Environment
- Qingdao Haixing
- Clewer Aquaculture
- Sterner
- Veolia
- FRD Japan
- MAT-KULING
- Fox Aquaculture
- Pentair
- Innovasea
- Nocera
- BioFishency
- SENECT
- Alpha Aqua
第12章 アナリストの見解・総論
第13章 付録
List of Tables
- Table 1. Global Recirculation Aquaculture System Market Size Growth Rate by Type (US$ Million): 2018 VS 2023 VS 2029
- Table 2. Key Players of Closed Type
- Table 3. Key Players of Semi-closed Type
- Table 4. Global Recirculation Aquaculture System Market Size Growth by Application (US$ Million): 2018 VS 2023 VS 2029
- Table 5. Global Recirculation Aquaculture System Market Size by Region (US$ Million): 2018 VS 2023 VS 2029
- Table 6. Global Recirculation Aquaculture System Market Size by Region (2018-2023) & (US$ Million)
- Table 7. Global Recirculation Aquaculture System Market Share by Region (2018-2023)
- Table 8. Global Recirculation Aquaculture System Forecasted Market Size by Region (2024-2029) & (US$ Million)
- Table 9. Global Recirculation Aquaculture System Market Share by Region (2024-2029)
- Table 10. Recirculation Aquaculture System Market Trends
- Table 11. Recirculation Aquaculture System Market Drivers
- Table 12. Recirculation Aquaculture System Market Challenges
- Table 13. Recirculation Aquaculture System Market Restraints
- Table 14. Global Recirculation Aquaculture System Revenue by Players (2018-2023) & (US$ Million)
- Table 15. Global Recirculation Aquaculture System Market Share by Players (2018-2023)
- Table 16. Global Top Recirculation Aquaculture System Players by Company Type (Tier 1, Tier 2, and Tier 3) & (based on the Revenue in Recirculation Aquaculture System as of 2022)
- Table 17. Ranking of Global Top Recirculation Aquaculture System Companies by Revenue (US$ Million) in 2022
- Table 18. Global 5 Largest Players Market Share by Recirculation Aquaculture System Revenue (CR5 and HHI) & (2018-2023)
- Table 19. Global Key Players of Recirculation Aquaculture System, Headquarters and Area Served
- Table 20. Global Key Players of Recirculation Aquaculture System, Product and Application
- Table 21. Global Key Players of Recirculation Aquaculture System, Date of Enter into This Industry
- Table 22. Mergers & Acquisitions, Expansion Plans
- Table 23. Global Recirculation Aquaculture System Market Size by Type (2018-2023) & (US$ Million)
- Table 24. Global Recirculation Aquaculture System Revenue Market Share by Type (2018-2023)
- Table 25. Global Recirculation Aquaculture System Forecasted Market Size by Type (2024-2029) & (US$ Million)
- Table 26. Global Recirculation Aquaculture System Revenue Market Share by Type (2024-2029)
- Table 27. Global Recirculation Aquaculture System Market Size by Application (2018-2023) & (US$ Million)
- Table 28. Global Recirculation Aquaculture System Revenue Market Share by Application (2018-2023)
- Table 29. Global Recirculation Aquaculture System Forecasted Market Size by Application (2024-2029) & (US$ Million)
- Table 30. Global Recirculation Aquaculture System Revenue Market Share by Application (2024-2029)
- Table 31. North America Recirculation Aquaculture System Market Size by Type (2018-2023) & (US$ Million)
- Table 32. North America Recirculation Aquaculture System Market Size by Type (2024-2029) & (US$ Million)
- Table 33. North America Recirculation Aquaculture System Market Size by Application (2018-2023) & (US$ Million)
- Table 34. North America Recirculation Aquaculture System Market Size by Application (2024-2029) & (US$ Million)
- Table 35. North America Recirculation Aquaculture System Market Size Growth Rate by Country (US$ Million): 2018 VS 2023 VS 2029
- Table 36. North America Recirculation Aquaculture System Market Size by Country (2018-2023) & (US$ Million)
- Table 37. North America Recirculation Aquaculture System Market Size by Country (2024-2029) & (US$ Million)
- Table 38. Europe Major Suppliers of Turn-key RAS Systems
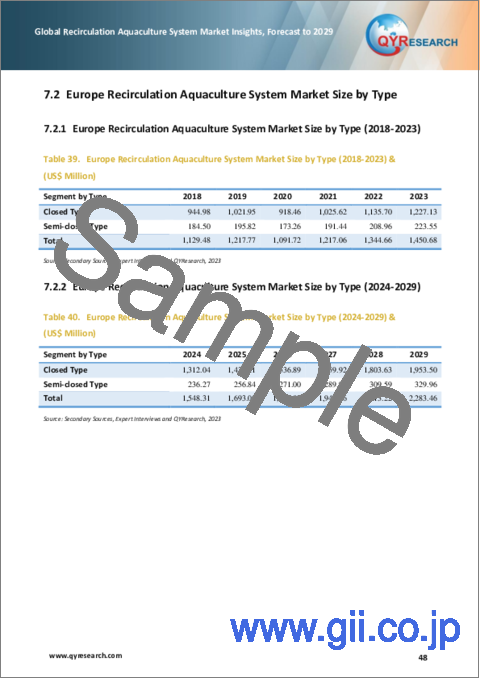
- Table 39. Europe Recirculation Aquaculture System Market Size by Type (2018-2023) & (US$ Million)
- Table 40. Europe Recirculation Aquaculture System Market Size by Type (2024-2029) & (US$ Million)
- Table 41. Europe Recirculation Aquaculture System Market Size by Application (2018-2023) & (US$ Million)
- Table 42. Europe Recirculation Aquaculture System Market Size by Application (2024-2029) & (US$ Million)
- Table 43. Europe Recirculation Aquaculture System Market Size Growth Rate by Country (US$ Million): 2018 VS 2023 VS 2029
- Table 44. Europe Recirculation Aquaculture System Market Size by Country (2018-2023) & (US$ Million)
- Table 45. Europe Recirculation Aquaculture System Market Size by Country (2024-2029) & (US$ Million)
- Table 46. Asia-Pacific Recirculation Aquaculture System Market Size by Type (2018-2023) & (US$ Million)
- Table 47. Asia-Pacific Recirculation Aquaculture System Market Size by Type (2024-2029) & (US$ Million)
- Table 48. Asia-Pacific Recirculation Aquaculture System Market Size by Application (2018-2023) & (US$ Million)
- Table 49. Asia-Pacific Recirculation Aquaculture System Market Size by Application (2024-2029) & (US$ Million)
- Table 50. Asia-Pacific Recirculation Aquaculture System Market Size Growth Rate by Country (US$ Million): 2018 VS 2023 VS 2029
- Table 51. Asia-Pacific Recirculation Aquaculture System Market Size by Region (2018-2023) & (US$ Million)
- Table 52. Asia-Pacific Recirculation Aquaculture System Market Size by Region (2024-2029) & (US$ Million)
- Table 53. Latin America Recirculation Aquaculture System Market Size by Type (2018-2023) & (US$ Million)
- Table 54. Latin America Recirculation Aquaculture System Market Size by Type (2024-2029) & (US$ Million)
- Table 55. Latin America Recirculation Aquaculture System Market Size by Application (2018-2023) & (US$ Million)
- Table 56. Latin America Recirculation Aquaculture System Market Size by Application (2024-2029) & (US$ Million)
- Table 57. Latin America Recirculation Aquaculture System Market Size Growth Rate by Country (US$ Million): 2018 VS 2023 VS 2029
- Table 58. Latin America Recirculation Aquaculture System Market Size by Country (2018-2023) & (US$ Million)
- Table 59. Latin America Recirculation Aquaculture System Market Size by Country (2024-2029) & (US$ Million)
- Table 60. Middle East & Asia Recirculation Aquaculture System Market Size by Type (2018-2023) & (US$ Million)
- Table 61. Middle East & Asia Recirculation Aquaculture System Market Size by Type (2024-2029) & (US$ Million)
- Table 62. Middle East & Asia Recirculation Aquaculture System Market Size by Application (2018-2023) & (US$ Million)
- Table 63. Middle East & Asia Recirculation Aquaculture System Market Size by Application (2024-2029) & (US$ Million)
- Table 64. Middle East & Africa Recirculation Aquaculture System Market Size Growth Rate by Country (US$ Million): 2018 VS 2023 VS 2029
- Table 65. Middle East & Africa Recirculation Aquaculture System Market Size by Country (2018-2023) & (US$ Million)
- Table 66. Middle East & Africa Recirculation Aquaculture System Market Size by Country (2024-2029) & (US$ Million)
- Table 67. Skretting Company Details
- Table 68. Skretting Business Overview
- Table 69. Skretting Recirculation Aquaculture System Product
- Table 70. Skretting Revenue in Recirculation Aquaculture System Business (2018-2023) & (US$ Million)
- Table 71. Skretting Recent Development
- Table 72. Xylem Company Details
- Table 73. Xylem Business Overview
- Table 74. Xylem Recirculation Aquaculture System Product
- Table 75. Xylem Revenue in Recirculation Aquaculture System Business (2018-2023) & (US$ Million)
- Table 76. Xylem Recent Development
- Table 77. RADAQUA Company Details
- Table 78. RADAQUA Business Overview
- Table 79. RADAQUA Recirculation Aquaculture System Product
- Table 80. RADAQUA Revenue in Recirculation Aquaculture System Business (2018-2023) & (US$ Million)
- Table 81. PR Aqua Company Details
- Table 82. PR Aqua Business Overview
- Table 83. PR Aqua Recirculation Aquaculture System Product
- Table 84. PR Aqua Revenue in Recirculation Aquaculture System Business (2018-2023) & (US$ Million)
- Table 85. PR Aqua Recent Development
- Table 86. AquaMaof Company Details
- Table 87. AquaMaof Business Overview
- Table 88. AquaMaof Recirculation Aquaculture System Product
- Table 89. AquaMaof Revenue in Recirculation Aquaculture System Business (2018-2023) & (US$ Million)
- Table 90. AquaMaof Recent Development
- Table 91. Billund Aquaculture Company Details
- Table 92. Billund Aquaculture Business Overview
- Table 93. Billund Aquaculture Recirculation Aquaculture System Product
- Table 94. Billund Aquaculture Revenue in Recirculation Aquaculture System Business (2018-2023) & (US$ Million)
- Table 95. Billund Aquaculture Recent Development
- Table 96. AKVA Group Company Details
- Table 97. AKVA Group Business Overview
- Table 98. AKVA Group Recirculation Aquaculture System Product
- Table 99. AKVA Group Revenue in Recirculation Aquaculture System Business (2018-2023) & (US$ Million)
- Table 100. AKVA Group Recent Development
- Table 101. Hesy Aquaculture Company Details
- Table 102. Hesy Aquaculture Business Overview
- Table 103. Hesy Aquaculture Recirculation Aquaculture System Product
- Table 104. Hesy Aquaculture Revenue in Recirculation Aquaculture System Business (2018-2023) & (US$ Million)
- Table 105. Hesy Aquaculture Recent Development
- Table 106. Aquacare Environment Company Details
- Table 107. Aquacare Environment Business Overview
- Table 108. Aquacare Environment Recirculation Aquaculture System Product
- Table 109. Aquacare Environment Revenue in Recirculation Aquaculture System Business (2018-2023) & (US$ Million)
- Table 110. Qingdao Haixing Company Details
- Table 111. Qingdao Haixing Business Overview
- Table 112. Qingdao Haixing Recirculation Aquaculture System Product
- Table 113. Qingdao Haixing Revenue in Recirculation Aquaculture System Business (2018-2023) & (US$ Million)
- Table 114. Clewer Aquaculture Company Details
- Table 115. Clewer Aquaculture Business Overview
- Table 116. Clewer Aquaculture Recirculation Aquaculture System Product
- Table 117. Clewer Aquaculture Revenue in Recirculation Aquaculture System Business (2018-2023) & (US$ Million)
- Table 118. Clewer Aquaculture Recent Development
- Table 119. Sterner Company Details
- Table 120. Sterner Business Overview
- Table 121. Sterner Recirculation Aquaculture System Product
- Table 122. Sterner Revenue in Recirculation Aquaculture System Business (2018-2023) & (US$ Million)
- Table 123. Sterner Recent Development
- Table 124. Veolia Company Details
- Table 125. Veolia Business Overview
- Table 126. Veolia Recirculation Aquaculture System Product
- Table 127. Veolia Revenue in Recirculation Aquaculture System Business (2018-2023) & (US$ Million)
- Table 128. Veolia Recent Development
- Table 129. FRD Japan Company Details
- Table 130. FRD Japan Business Overview
- Table 131. FRD Japan Recirculation Aquaculture System Product
- Table 132. FRD Japan Revenue in Recirculation Aquaculture System Business (2018-2023) & (US$ Million)
- Table 133. MAT-KULING Company Details
- Table 134. MAT-KULING Business Overview
- Table 135. MAT-KULING Recirculation Aquaculture System Product
- Table 136. MAT-KULING Revenue in Recirculation Aquaculture System Business (2018-2023) & (US$ Million)
- Table 137. MAT-KULING Recent Development
- Table 138. Fox Aquaculture Company Details
- Table 139. Fox Aquaculture Business Overview
- Table 140. Fox Aquaculture Recirculation Aquaculture System Product
- Table 141. Fox Aquaculture Revenue in Recirculation Aquaculture System Business (2018-2023) & (US$ Million)
- Table 142. Pentair Company Details
- Table 143. Pentair Business Overview
- Table 144. Pentair Recirculation Aquaculture System Product
- Table 145. Pentair Revenue in Recirculation Aquaculture System Business (2018-2023) & (US$ Million)
- Table 146. Pentair Recent Development
- Table 147. Innovasea Company Details
- Table 148. Innovasea Business Overview
- Table 149. Innovasea Recirculation Aquaculture System Product
- Table 150. Innovasea Revenue in Recirculation Aquaculture System Business (2018-2023) & (US$ Million)
- Table 151. Innovasea Recent Development
- Table 152. Nocera Company Details
- Table 153. Nocera Business Overview
- Table 154. Nocera Recirculation Aquaculture System Product
- Table 155. Nocera Revenue in Recirculation Aquaculture System Business (2018-2023) & (US$ Million)
- Table 156. BioFishency Company Details
- Table 157. BioFishency Business Overview
- Table 158. BioFishency Recirculation Aquaculture System Product
- Table 159. BioFishency Revenue in Recirculation Aquaculture System Business (2018-2023) & (US$ Million)
- Table 160. SENECT Company Details
- Table 161. SENECT Business Overview
- Table 162. SENECT Recirculation Aquaculture System Product
- Table 163. SENECT Revenue in Recirculation Aquaculture System Business (2018-2023) & (US$ Million)
- Table 164. Alpha Aqua Company Details
- Table 165. Alpha Aqua Business Overview
- Table 166. Alpha Aqua Recirculation Aquaculture System Product
- Table 167. Alpha Aqua Revenue in Recirculation Aquaculture System Business (2018-2023) & (US$ Million)
- Table 168. Alpha Aqua Recent Development
- Table 169. Research Programs/Design for This Report
- Table 170. Key Data Information from Secondary Sources
- Table 171. Key Data Information from Primary Sources
- Table 172. Authors List of This Report
- Table 173. QYR Business Unit and Senior & Team Lead Analysts
List of Figures
- Figure 1. Product Picture of Recirculation Aquaculture System
- Figure 2. Aquaculture System Comparison
- Figure 3. Basic Principle of Recirculation Aquaculture System
- Figure 4. Global Recirculation Aquaculture System Market Size Comparison by Type (2023-2029) & (US$ Million)
- Figure 5. Global Recirculation Aquaculture System Market Share by Type: 2022 VS 2029
- Figure 6. Closed Type Features
- Figure 7. Semi-closed Type Features
- Figure 8. Global Recirculation Aquaculture System Market Size by Application (2023-2029) & (US$ Million)
- Figure 9. Global Recirculation Aquaculture System Market Share by Application: 2022 VS 2029
- Figure 10. Indoor System Case Studies
- Figure 11. Outdoor System Case Studies
- Figure 12. Recirculation Aquaculture System Report Years Considered
- Figure 13. Global Recirculation Aquaculture System Market Size (US$ Million), Year-over-Year: 2018-2029
- Figure 14. Global Recirculation Aquaculture System Market Size, (US$ Million), 2018 VS 2023 VS 2029
- Figure 15. Global Recirculation Aquaculture System Market Share by Region: 2022 VS 2029
- Figure 16. Global Recirculation Aquaculture System Market Share by Players in 2022
- Figure 17. Global Top Recirculation Aquaculture System Players by Company Type (Tier 1, Tier 2, and Tier 3) & (based on the Revenue in Recirculation Aquaculture System as of 2022)
- Figure 18. The Top 10 and 5 Players Market Share by Recirculation Aquaculture System Revenue in 2022
- Figure 19. North America Recirculation Aquaculture System Market Size YoY Growth (2018-2029) & (US$ Million)
- Figure 20. North America Recirculation Aquaculture System Market Share by Type (2018-2029)
- Figure 21. North America Recirculation Aquaculture System Market Share by Application (2018-2029)
- Figure 22. North America Recirculation Aquaculture System Market Share by Country (2018-2029)
- Figure 23. United States Recirculation Aquaculture System Market Size YoY Growth (2018-2029) & (US$ Million)
- Figure 24. Canada Recirculation Aquaculture System Market Size YoY Growth (2018-2029) & (US$ Million)
- Figure 25. Europe Recirculation Aquaculture System Market Size YoY Growth (2018-2029) & (US$ Million)
- Figure 26. Europe Recirculation Aquaculture System Market Share by Type (2018-2029)
- Figure 27. Europe Recirculation Aquaculture System Market Share by Application (2018-2029)
- Figure 28. Europe Recirculation Aquaculture System Market Share by Country (2018-2029)
- Figure 29. Germany Recirculation Aquaculture System Market Size YoY Growth (2018-2029) & (US$ Million)
- Figure 30. France Recirculation Aquaculture System Market Size YoY Growth (2018-2029) & (US$ Million)
- Figure 31. U.K. Recirculation Aquaculture System Market Size YoY Growth (2018-2029) & (US$ Million)
- Figure 32. Nordic Recirculation Aquaculture System Market Size YoY Growth (2018-2029) & (US$ Million)
- Figure 33. Russia Recirculation Aquaculture System Market Size YoY Growth (2018-2029) & (US$ Million)
- Figure 34. Asia-Pacific Recirculation Aquaculture System Market Size YoY Growth (2018-2029) & (US$ Million)
- Figure 35. Asia-Pacific Recirculation Aquaculture System Market Share by Type (2018-2029)
- Figure 36. Asia-Pacific Recirculation Aquaculture System Market Share by Application (2018-2029)
- Figure 37. Asia-Pacific Recirculation Aquaculture System Market Share by Region (2018-2029)
- Figure 38. China Recirculation Aquaculture System Market Size YoY Growth (2018-2029) & (US$ Million)
- Figure 39. Japan Recirculation Aquaculture System Market Size YoY Growth (2018-2029) & (US$ Million)
- Figure 40. South Korea Recirculation Aquaculture System Market Size YoY Growth (2018-2029) & (US$ Million)
- Figure 41. Southeast Asia Recirculation Aquaculture System Market Size YoY Growth (2018-2029) & (US$ Million)
- Figure 42. India Recirculation Aquaculture System Market Size YoY Growth (2018-2029) & (US$ Million)
- Figure 43. Australia Recirculation Aquaculture System Market Size YoY Growth (2018-2029) & (US$ Million)
- Figure 44. Latin America Recirculation Aquaculture System Market Size YoY Growth (2018-2029) & (US$ Million)
- Figure 45. Latin America Recirculation Aquaculture System Market Share by Type (2018-2029)
- Figure 46. Latin America Recirculation Aquaculture System Market Share by Application (2018-2029)
- Figure 47. Latin America Recirculation Aquaculture System Market Share by Country (2018-2029)
- Figure 48. Mexico Recirculation Aquaculture System Market Size YoY Growth (2018-2029) & (US$ Million)
- Figure 49. Brazil Recirculation Aquaculture System Market Size YoY Growth (2018-2029) & (US$ Million)
- Figure 50. Middle East & Africa Recirculation Aquaculture System Market Size YoY Growth (2018-2029) & (US$ Million)
- Figure 51. Middle East & Asia Recirculation Aquaculture System Market Share by Type (2018-2029)
- Figure 52. Middle East & Asia Recirculation Aquaculture System Market Share by Application (2018-2029)
- Figure 53. Middle East & Africa Recirculation Aquaculture System Market Share by Country (2018-2029)
- Figure 54. Saudi Arabia Recirculation Aquaculture System Market Size YoY Growth (2018-2029) & (US$ Million)
- Figure 55. UAE Recirculation Aquaculture System Market Size YoY Growth (2018-2029) & (US$ Million)
- Figure 56. Egypt Recirculation Aquaculture System Market Size YoY Growth (2018-2029) & (US$ Million)
- Figure 57. South Africa Recirculation Aquaculture System Market Size YoY Growth (2018-2029) & (US$ Million)
- Figure 58. Skretting Revenue Growth Rate in Recirculation Aquaculture System Business (2018-2023)
- Figure 59. Xylem Revenue Growth Rate in Recirculation Aquaculture System Business (2018-2023)
- Figure 60. RADAQUA Revenue Growth Rate in Recirculation Aquaculture System Business (2018-2023)
- Figure 61. PR Aqua Revenue Growth Rate in Recirculation Aquaculture System Business (2018-2023)
- Figure 62. AquaMaof Revenue Growth Rate in Recirculation Aquaculture System Business (2018-2023)
- Figure 63. Billund Aquaculture Revenue Growth Rate in Recirculation Aquaculture System Business (2018-2023)
- Figure 64. AKVA Group Revenue Growth Rate in Recirculation Aquaculture System Business (2018-2023)
- Figure 65. Hesy Aquaculture Revenue Growth Rate in Recirculation Aquaculture System Business (2018-2023)
- Figure 66. Aquacare Environment Revenue Growth Rate in Recirculation Aquaculture System Business (2018-2023)
- Figure 67. Qingdao Haixing Revenue Growth Rate in Recirculation Aquaculture System Business (2018-2023)
- Figure 68. Clewer Aquaculture Revenue Growth Rate in Recirculation Aquaculture System Business (2018-2023)
- Figure 69. Sterner Revenue Growth Rate in Recirculation Aquaculture System Business (2018-2023)
- Figure 70. Veolia Revenue Growth Rate in Recirculation Aquaculture System Business (2018-2023)
- Figure 71. FRD Japan Revenue Growth Rate in Recirculation Aquaculture System Business (2018-2023)
- Figure 72. MAT-KULING Revenue Growth Rate in Recirculation Aquaculture System Business (2018-2023)
- Figure 73. Fox Aquaculture Revenue Growth Rate in Recirculation Aquaculture System Business (2018-2023)
- Figure 74. Pentair Revenue Growth Rate in Recirculation Aquaculture System Business (2018-2023)
- Figure 75. Innovasea Revenue Growth Rate in Recirculation Aquaculture System Business (2018-2023)
- Figure 76. Nocera Revenue Growth Rate in Recirculation Aquaculture System Business (2018-2023)
- Figure 77. BioFishency Revenue Growth Rate in Recirculation Aquaculture System Business (2018-2023)
- Figure 78. SENECT Revenue Growth Rate in Recirculation Aquaculture System Business (2018-2023)
- Figure 79. Alpha Aqua Revenue Growth Rate in Recirculation Aquaculture System Business (2018-2023)
- Figure 80. Bottom-up and Top-down Approaches for This Report
- Figure 81. Data Triangulation
- Figure 82. Key Executives Interviewed
Global Recirculation Aquaculture System market size in terms of revenue is projected to reach 8,548.46 Million USD by 2029 from 5,336.45 Million USD in 2023, with a CAGR 8.17% during 2023-2029.
North America market for Recirculation Aquaculture System is estimated to increase from 1,282.43 million USD in 2023 to reach 2,052.02 million USD by 2029, at a CAGR of 8.15% during the forecast period of 2023 through 2029.
Europe market for Recirculation Aquaculture System is estimated to increase from 1,450.68 million USD in 2023 to reach 2,283.46 million USD by 2029, at a CAGR of 7.85% during the forecast period of 2023 through 2029.
Asia-Pacific market for Recirculation Aquaculture System is estimated to increase from 2,160.18 million USD in 2023 to reach 3,519.29 million USD by 2029, at a CAGR of 8.47% during the forecast period of 2023 through 2029.
The major global manufacturers of Recirculation Aquaculture System include: Skretting, Xylem, RADAQUA, PR Aqua, AquaMaof, Billund Aquaculture, AKVA Group, Hesy Aquaculture, Aquacare Environment, Qingdao Haixing, etc. In 2022, the world's top five vendors accounted for approximately 12.69% of the revenue.
Report Scope
This report aims to provide a comprehensive presentation of the global market for Recirculation Aquaculture System, with both quantitative and qualitative analysis, to help readers develop business/growth strategies, assess the market competitive situation, analyze their position in the current marketplace, and make informed business decisions regarding Recirculation Aquaculture System.
The Recirculation Aquaculture System market size, estimations, and forecasts are provided in terms of and revenue ($ millions), considering 2022 as the base year, with history and forecast data for the period from 2018 to 2029. This report segments the global Recirculation Aquaculture System market comprehensively. Regional market sizes, concerning products by Type, by Application, and by players, are also provided.
For a more in-depth understanding of the market, the report provides profiles of the competitive landscape, key competitors, and their respective market ranks. The report also discusses technological trends and new product developments.
The report will help the Recirculation Aquaculture System companies, new entrants, and industry chain related companies in this market with information on the revenues for the overall market and the sub-segments across the different segments, by company, by Type, by Application, and by regions.
By Company
- Skretting
- Xylem
- RADAQUA
- PR Aqua
- AquaMaof
- Billund Aquaculture
- AKVA Group
- Hesy Aquaculture
- Aquacare Environment
- Qingdao Haixing
- Clewer Aquaculture
- Sterner
- Veolia
- FRD Japan
- MAT-KULING
- Fox Aquaculture
- Pentair
- Innovasea
- Nocera
- BioFishency
- SENECT
- Alpha Aqua
Segment by Type
- Closed Type
- Semi-closed Type
Segment by Application
- Indoor System
- Outdoor System
By Region
- North America
- United States
- Canada
- Asia-Pacific
- China
- Japan
- South Korea
- Southeast Asia
- India
- Australia
- Rest of Asia
- Europe
- Germany
- France
- U.K.
- Nordic Countries
- Russia
- Rest of Europe
- Latin America
- Mexico
- Brazil
- Rest of Latin America
- Middle East & Africa
- Saudi Arabia
- UAE
- Egypt
- South Africa
- Rest of MEA
Core Chapters
- Chapter 1: Introduces the report scope of the report, executive summary of different market segments (by Type, by Application, etc), including the market size of each market segment, future development potential, and so on. It offers a high-level view of the current state of the market and its likely evolution in the short to mid-term, and long term.
- Chapter 2: Introduces executive summary of global market size, regional market size, this section also introduces the market dynamics, latest developments of the market, the driving factors and restrictive factors of the market, the challenges and risks faced by companies in the industry, and the analysis of relevant policies in the industry.
- Chapter 3: Detailed analysis of Recirculation Aquaculture System companies' competitive landscape, revenue market share, latest development plan, merger, and acquisition information, etc.
- Chapter 4: Provides the analysis of various market segments by Type, covering the market size and development potential of each market segment, to help readers find the blue ocean market in different market segments.
- Chapter 5: Provides the analysis of various market segments by Application, covering the market size and development potential of each market segment, to help readers find the blue ocean market in different downstream markets.
- Chapter 6, 7, 8, 9, 10: North America, Europe, Asia Pacific, Latin America, Middle East and Africa segment by country. It provides a quantitative analysis of the market size and development potential of each region and its main countries and introduces the market development, future development prospects, market space, and capacity of each country in the world.
- Chapter 11: Provides profiles of key players, introducing the basic situation of the main companies in the market in detail, including product sales, revenue, price, gross margin, product introduction, recent development, etc.
- Chapter 12: The main points and conclusions of the report.
Table of Contents
1 Report Overview
- 1.1 Study Scope
- 1.2 Recirculation Aquaculture System Key Components
- 1.3 Market Analysis by Type
- 1.3.1 Global Recirculation Aquaculture System Market Size Growth Rate by Type: 2018 VS 2023 VS 2029
- 1.3.2 Closed Type
- 1.3.3 Semi-closed Type
- 1.4 Market by Application
- 1.4.1 Global Recirculation Aquaculture System Market Growth by Application: 2018 VS 2023 VS 2029
- 1.4.2 Indoor System
- 1.4.3 Outdoor System
- 1.5 Assumptions and Limitations
- 1.6 Study Objectives
- 1.7 Years Considered
2 Global Growth Trends
- 2.1 Global Recirculation Aquaculture System Market Perspective (2018-2029)
- 2.2 Global Recirculation Aquaculture System Growth Trends by Region
- 2.2.1 Global Recirculation Aquaculture System Market Size by Region: 2018 VS 2023 VS 2029
- 2.2.2 Recirculation Aquaculture System Historic Market Size by Region (2018-2023)
- 2.2.3 Recirculation Aquaculture System Forecasted Market Size by Region (2024-2029)
- 2.3 Recirculation Aquaculture System Market Dynamics
- 2.3.1 Recirculation Aquaculture System Industry Trends
- 2.3.2 Recirculation Aquaculture System Market Drivers
- 2.3.3 Recirculation Aquaculture System Market Challenges
- 2.3.4 Recirculation Aquaculture System Market Restraints
3 Competition Landscape by Key Players
- 3.1 Global Top Recirculation Aquaculture System Players by Revenue
- 3.1.1 Global Top Recirculation Aquaculture System Players by Revenue (2018-2023)
- 3.1.2 Global Recirculation Aquaculture System Revenue Market Share by Players (2018-2023)
- 3.2 Global Recirculation Aquaculture System Market Share by Company Type (Tier 1, Tier 2, and Tier 3)
- 3.3 Global Key Players Ranking by Recirculation Aquaculture System Revenue
- 3.4 Global Recirculation Aquaculture System Market Concentration Ratio
- 3.4.1 Global Recirculation Aquaculture System Market Concentration Ratio (CR5 and HHI)
- 3.4.2 Global Top 10 and Top 5 Companies by Recirculation Aquaculture System Revenue in 2022
- 3.5 Global Key Players of Recirculation Aquaculture System Head office and Area Served
- 3.6 Global Key Players of Recirculation Aquaculture System, Product and Application
- 3.7 Global Key Players of Recirculation Aquaculture System, Date of Enter into This Industry
- 3.8 Mergers & Acquisitions, Expansion Plans
4 Recirculation Aquaculture System Breakdown Data by Type
- 4.1 Global Recirculation Aquaculture System Historic Market Size by Type (2018-2023)
- 4.2 Global Recirculation Aquaculture System Forecasted Market Size by Type (2024-2029)
5 Recirculation Aquaculture System Breakdown Data by Application
- 5.1 Global Recirculation Aquaculture System Historic Market Size by Application (2018-2023)
- 5.2 Global Recirculation Aquaculture System Forecasted Market Size by Application (2024-2029)
6 North America
- 6.1 North America Recirculation Aquaculture System Market Size (2018-2029)
- 6.2 North America Recirculation Aquaculture System Market Size by Type
- 6.2.1 North America Recirculation Aquaculture System Market Size by Type (2018-2023)
- 6.2.2 North America Recirculation Aquaculture System Market Size by Type (2024-2029)
- 6.2.3 North America Recirculation Aquaculture System Market Share by Type (2018-2029)
- 6.3 North America Recirculation Aquaculture System Market Size by Application
- 6.3.1 North America Recirculation Aquaculture System Market Size by Application (2018-2023)
- 6.3.2 North America Recirculation Aquaculture System Market Size by Application (2024-2029)
- 6.3.3 North America Recirculation Aquaculture System Market Share by Application (2018-2029)
- 6.4 North America Recirculation Aquaculture System Market Growth Rate by Country: 2018 VS 2023 VS 2029
- 6.5 North America Recirculation Aquaculture System Market Size by Country (2018-2023)
- 6.6 North America Recirculation Aquaculture System Market Size by Country (2024-2029)
- 6.6.1 United States
- 6.6.2 Canada
7 Europe
- 7.1 Europe Recirculation Aquaculture System Market Size (2018-2029)
- 7.2 Europe Recirculation Aquaculture System Market Size by Type
- 7.2.1 Europe Recirculation Aquaculture System Market Size by Type (2018-2023)
- 7.2.2 Europe Recirculation Aquaculture System Market Size by Type (2024-2029)
- 7.2.3 Europe Recirculation Aquaculture System Market Share by Type (2018-2029)
- 7.3 Europe Recirculation Aquaculture System Market Size by Application
- 7.3.1 Europe Recirculation Aquaculture System Market Size by Application (2018-2023)
- 7.3.2 Europe Recirculation Aquaculture System Market Size by Application (2024-2029)
- 7.3.3 Europe Recirculation Aquaculture System Market Share by Application (2018-2029)
- 7.4 Europe Recirculation Aquaculture System Market Growth Rate by Country: 2018 VS 2023 VS 2029
- 7.5 Europe Recirculation Aquaculture System Market Size by Country (2018-2023)
- 7.6 Europe Recirculation Aquaculture System Market Size by Country (2024-2029)
- 7.6.1 Germany
- 7.6.2 France
- 7.6.3 U.K.
- 7.6.4 Nordic
- 7.6.5 Russia
8 Asia-Pacific
- 8.1 Asia-Pacific Recirculation Aquaculture System Market Size (2018-2029)
- 8.2 Asia-Pacific Recirculation Aquaculture System Market Size by Type
- 8.2.1 Asia-Pacific Recirculation Aquaculture System Market Size by Type (2018-2023)
- 8.2.2 Asia-Pacific Recirculation Aquaculture System Market Size by Type (2024-2029)
- 8.2.3 Asia-Pacific Recirculation Aquaculture System Market Share by Type (2018-2029)
- 8.3 Asia-Pacific Recirculation Aquaculture System Market Size by Application
- 8.3.1 Asia-Pacific Recirculation Aquaculture System Market Size by Application (2018-2023)
- 8.3.2 Asia-Pacific Recirculation Aquaculture System Market Size by Application (2024-2029)
- 8.3.3 Asia-Pacific Recirculation Aquaculture System Market Share by Application (2018-2029)
- 8.4 Asia-Pacific Recirculation Aquaculture System Market Growth Rate by Country: 2018 VS 2023 VS 2029
- 8.5 Asia-Pacific Recirculation Aquaculture System Market Size by Region (2018-2023)
- 8.6 Asia-Pacific Recirculation Aquaculture System Market Size by Region (2024-2029)
- 8.6.1 China
- 8.6.2 Japan
- 8.6.3 South Korea
- 8.6.4 Southeast Asia
- 8.6.5 India
- 8.6.6 Australia
9 Latin America
- 9.1 Latin America Recirculation Aquaculture System Market Size (2018-2029)
- 9.2 Latin America Recirculation Aquaculture System Market Size by Type
- 9.2.1 Latin America Recirculation Aquaculture System Market Size by Type (2018-2023)
- 9.2.2 Latin America Recirculation Aquaculture System Market Size by Type (2024-2029)
- 9.2.3 Latin America Recirculation Aquaculture System Market Share by Type (2018-2029)
- 9.3 Latin America Recirculation Aquaculture System Market Size by Application
- 9.3.1 Latin America Recirculation Aquaculture System Market Size by Application (2018-2023)
- 9.3.2 Latin America Recirculation Aquaculture System Market Size by Application (2024-2029)
- 9.3.3 Latin America Recirculation Aquaculture System Market Share by Application (2018-2029)
- 9.4 Latin America Recirculation Aquaculture System Market Growth Rate by Country: 2018 VS 2023 VS 2029
- 9.5 Latin America Recirculation Aquaculture System Market Size by Country (2018-2023)
- 9.6 Latin America Recirculation Aquaculture System Market Size by Country (2024-2029)
- 9.6.1 Mexico
- 9.6.2 Brazil
10 Middle East & Africa
- 10.1 Middle East & Africa Recirculation Aquaculture System Market Size (2018-2029)
- 10.2 Middle East & Asia Recirculation Aquaculture System Market Size by Type
- 10.2.1 Middle East & Asia Recirculation Aquaculture System Market Size by Type (2018-2023)
- 10.2.2 Middle East & Asia Recirculation Aquaculture System Market Size by Type (2024-2029)
- 10.2.3 Middle East & Asia Recirculation Aquaculture System Market Share by Type (2018-2029)
- 10.3 Middle East & Asia Recirculation Aquaculture System Market Size by Application
- 10.3.1 Middle East & Asia Recirculation Aquaculture System Market Size by Application (2018-2023)
- 10.3.2 Middle East & Asia Recirculation Aquaculture System Market Size by Application (2024-2029)
- 10.3.3 Middle East & Asia Recirculation Aquaculture System Market Share by Application (2018-2029)
- 10.4 Middle East & Africa Recirculation Aquaculture System Market Growth Rate by Country: 2018 VS 2023 VS 2029
- 10.5 Middle East & Africa Recirculation Aquaculture System Market Size by Country (2018-2023)
- 10.6 Middle East & Africa Recirculation Aquaculture System Market Size by Country (2024-2029)
- 10.6.1 Saudi Arabia
- 10.6.2 UAE
- 10.6.3 Egypt
- 10.6.4 South Africa
11 Key Players Profiles
- 11.1 Skretting
- 11.1.1 Skretting Company Details
- 11.1.2 Skretting Business Overview
- 11.1.3 Skretting Recirculation Aquaculture System Introduction
- 11.1.4 Skretting Revenue in Recirculation Aquaculture System Business (2018-2023)
- 11.1.5 Skretting Recent Development
- 11.2 Xylem
- 11.2.1 Xylem Company Details
- 11.2.2 Xylem Business Overview
- 11.2.3 Xylem Recirculation Aquaculture System Introduction
- 11.2.4 Xylem Revenue in Recirculation Aquaculture System Business (2018-2023)
- 11.2.5 Xylem Recent Development
- 11.3 RADAQUA
- 11.3.1 RADAQUA Company Details
- 11.3.2 RADAQUA Business Overview
- 11.3.3 RADAQUA Recirculation Aquaculture System Introduction
- 11.3.4 RADAQUA Revenue in Recirculation Aquaculture System Business (2018-2023)
- 11.4 PR Aqua
- 11.4.1 PR Aqua Company Details
- 11.4.2 PR Aqua Business Overview
- 11.4.3 PR Aqua Recirculation Aquaculture System Introduction
- 11.4.4 PR Aqua Revenue in Recirculation Aquaculture System Business (2018-2023)
- 11.4.5 PR Aqua Recent Development
- 11.5 AquaMaof
- 11.5.1 AquaMaof Company Details
- 11.5.2 AquaMaof Business Overview
- 11.5.3 AquaMaof Recirculation Aquaculture System Introduction
- 11.5.4 AquaMaof Revenue in Recirculation Aquaculture System Business (2018-2023)
- 11.5.5 AquaMaof Recent Development
- 11.6 Billund Aquaculture
- 11.6.1 Billund Aquaculture Company Details
- 11.6.2 Billund Aquaculture Business Overview
- 11.6.3 Billund Aquaculture Recirculation Aquaculture System Introduction
- 11.6.4 Billund Aquaculture Revenue in Recirculation Aquaculture System Business (2018-2023)
- 11.6.5 Billund Aquaculture Recent Development
- 11.7 AKVA Group
- 11.7.1 AKVA Group Company Details
- 11.7.2 AKVA Group Business Overview
- 11.7.3 AKVA Group Recirculation Aquaculture System Introduction
- 11.7.4 AKVA Group Revenue in Recirculation Aquaculture System Business (2018-2023)
- 11.7.5 AKVA Group Recent Development
- 11.8 Hesy Aquaculture
- 11.8.1 Hesy Aquaculture Company Details
- 11.8.2 Hesy Aquaculture Business Overview
- 11.8.3 Hesy Aquaculture Recirculation Aquaculture System Introduction
- 11.8.4 Hesy Aquaculture Revenue in Recirculation Aquaculture System Business (2018-2023)
- 11.8.5 Hesy Aquaculture Recent Development
- 11.9 Aquacare Environment
- 11.9.1 Aquacare Environment Company Details
- 11.9.2 Aquacare Environment Business Overview
- 11.9.3 Aquacare Environment Recirculation Aquaculture System Introduction
- 11.9.4 Aquacare Environment Revenue in Recirculation Aquaculture System Business (2018-2023)
- 11.10 Qingdao Haixing
- 11.10.1 Qingdao Haixing Company Details
- 11.10.2 Qingdao Haixing Business Overview
- 11.10.3 Qingdao Haixing Recirculation Aquaculture System Introduction
- 11.10.4 Qingdao Haixing Revenue in Recirculation Aquaculture System Business (2018-2023)
- 11.11 Clewer Aquaculture
- 11.11.1 Clewer Aquaculture Company Details
- 11.11.2 Clewer Aquaculture Business Overview
- 11.11.3 Clewer Aquaculture Recirculation Aquaculture System Introduction
- 11.11.4 Clewer Aquaculture Revenue in Recirculation Aquaculture System Business (2018-2023)
- 11.11.5 Clewer Aquaculture Recent Development
- 11.12 Sterner
- 11.12.1 Sterner Company Details
- 11.12.2 Sterner Business Overview
- 11.12.3 Sterner Recirculation Aquaculture System Introduction
- 11.12.4 Sterner Revenue in Recirculation Aquaculture System Business (2018-2023)
- 11.12.5 Sterner Recent Development
- 11.13 Veolia
- 11.13.1 Veolia Company Details
- 11.13.2 Veolia Business Overview
- 11.13.3 Veolia Recirculation Aquaculture System Introduction
- 11.13.4 Veolia Revenue in Recirculation Aquaculture System Business (2018-2023)
- 11.13.5 Veolia Recent Development
- 11.14 FRD Japan
- 11.14.1 FRD Japan Company Details
- 11.14.2 FRD Japan Business Overview
- 11.14.3 FRD Japan Recirculation Aquaculture System Introduction
- 11.14.4 FRD Japan Revenue in Recirculation Aquaculture System Business (2018-2023)
- 11.15 MAT-KULING
- 11.15.1 MAT-KULING Company Details
- 11.15.2 MAT-KULING Business Overview
- 11.15.3 MAT-KULING Recirculation Aquaculture System Introduction
- 11.15.4 MAT-KULING Revenue in Recirculation Aquaculture System Business (2018-2023)
- 11.15.5 MAT-KULING Recent Development
- 11.16 Fox Aquaculture
- 11.16.1 Fox Aquaculture Company Details
- 11.16.2 Fox Aquaculture Business Overview
- 11.16.3 Fox Aquaculture Recirculation Aquaculture System Introduction
- 11.16.4 Fox Aquaculture Revenue in Recirculation Aquaculture System Business (2018-2023)
- 11.17 Pentair
- 11.17.1 Pentair Company Details
- 11.17.2 Pentair Business Overview
- 11.17.3 Pentair Recirculation Aquaculture System Introduction
- 11.17.4 Pentair Revenue in Recirculation Aquaculture System Business (2018-2023)
- 11.17.5 Pentair Recent Development
- 11.18 Innovasea
- 11.18.1 Innovasea Company Details
- 11.18.2 Innovasea Business Overview
- 11.18.3 Innovasea Recirculation Aquaculture System Introduction
- 11.18.4 Innovasea Revenue in Recirculation Aquaculture System Business (2018-2023)
- 11.18.5 Innovasea Recent Development
- 11.19 Nocera
- 11.19.1 Nocera Company Details
- 11.19.2 Nocera Business Overview
- 11.19.3 Nocera Recirculation Aquaculture System Introduction
- 11.19.4 Nocera Revenue in Recirculation Aquaculture System Business (2018-2023)
- 11.20 BioFishency
- 11.20.1 BioFishency Company Details
- 11.20.2 BioFishency Business Overview
- 11.20.3 BioFishency Recirculation Aquaculture System Introduction
- 11.20.4 BioFishency Revenue in Recirculation Aquaculture System Business (2018-2023)
- 11.21 SENECT
- 11.21.1 SENECT Company Details
- 11.21.2 SENECT Business Overview
- 11.21.3 SENECT Recirculation Aquaculture System Introduction
- 11.21.4 SENECT Revenue in Recirculation Aquaculture System Business (2018-2023)
- 11.22 Alpha Aqua
- 11.22.1 Alpha Aqua Company Details
- 11.22.2 Alpha Aqua Business Overview
- 11.22.3 Alpha Aqua Recirculation Aquaculture System Introduction
- 11.22.4 Alpha Aqua Revenue in Recirculation Aquaculture System Business (2018-2023)
- 11.22.5 Alpha Aqua Recent Development
12 Analyst's Viewpoints/Conclusions
13 Appendix
- 13.1 Research Methodology
- 13.1.1 Methodology/Research Approach
- 13.1.2 Data Source
- 13.2 Author Details
- 13.3 Disclaimer