|
|
市場調査レポート
商品コード
1348666
イリジウムリサイクルの世界市場:洞察と2029年までの予測Global Iridium Recycling Market Insights, Forecast to 2029 |
||||||
|
|
|||||||
カスタマイズ可能
適宜更新あり
|
|||||||


| イリジウムリサイクルの世界市場:洞察と2029年までの予測 |
|
出版日: 2023年09月19日
発行: QYResearch
ページ情報: 英文 162 Pages
納期: 2~3営業日
|

- 全表示
- 概要
- 図表
- 目次
COVID-19のパンデミックとロシア・ウクライナ戦争の影響により、世界のイリジウムリサイクルの市場規模は、2023年に5億3,494万米ドルになるとみられています。
同市場は、2023年から2029年の予測期間中にCAGR 5.51%で拡大し、2029年までに7億3,811万米ドルに達すると予測されています。
米国・カナダのイリジウムリサイクルの市場規模は、2023年の1億9,518万米ドルから、2023年から2029年の予測期間中にCAGR 6.16%で拡大し、2029年には2億7,939万米ドルに達すると予測されます。
中国のイリジウムリサイクルの市場規模は、2023年の7,871万米ドルから2029年には1億1,010万米ドルに達すると予測され、2023年から2029年の予測期間中のCAGRは5.75%と見込まれています。
欧州のイリジウムリサイクルの市場規模は、2023年の1億7,094万米ドルから2023年から2029年の予測期間中にCAGR 4.94%で拡大し、2029年には2億2,828万米ドルに達すると予測されています。
イリジウムリサイクルの世界の主要メーカーには、Umicore、PX Group、Johnson Matthey、Heraeus、McCol Metals、フルヤ金属、Tanaka、Mastermelt、Sino-Platinum Metalsなどがあります。2022年、世界の主要企業5社の売上高シェアは約56.75%でした。
当レポートでは、世界のイリジウムリサイクル市場について調査し、市場の概要とともに、企業別、タイプ別、用途別、地域別の動向、および市場に参入する企業のプロファイルなどを提供しています。
目次
第1章 調査範囲
- イリジウムリサイクル製品イントロダクション
- タイプ別市場
- 用途別市場
- 前提と制限
- 調査目的
- 対象年
第2章 世界のイリジウムリサイクル生産
- 世界のイリジウムリサイクル生産能力(2018年~2029年)
- 世界のイリジウムリサイクル生産量:2018年 VS 2022年 VS 2029年、地域別
- 世界のイリジウムリサイクル生産量、地域別
- 北米
- 欧州
- 中国
- 日本
第3章 エグゼクティブサマリー
第4章 メーカーによる競合
第5章 市場規模、タイプ別
- 世界のイリジウムリサイクル売上高、タイプ別
- 世界のイリジウムリサイクル収益、タイプ別
- 世界のイリジウムリサイクル価格、タイプ別
第6章 市場規模、用途別
- 世界のイリジウムリサイクル売上高、用途別
- 世界のイリジウムリサイクル収益、用途別
- 世界のイリジウムリサイクル価格、用途別
第7章 米国とカナダ
第8章 欧州
第9章 中国
第10章 アジア(中国を除く)
第11章 中東・アフリカ、ラテンアメリカ
第12章 企業プロファイル
- Umicore
- PX Group
- Johnson Matthey
- Heraeus
- McCol Metals
- Furuya Metal
- Tanaka
- Mastermelt
- Sino-Platinum Metals
第13章 販売チャネル分析
第14章 イリジウムリサイクル市場力学
- イリジウムリサイクル業界の動向
- イリジウムリサイクル市場の促進要因
- イリジウムリサイクル市場の課題
- イリジウムリサイクル市場の抑制要因
第15章 世界規模のイリジウムリサイクル調査における主な所見
第16章 付録
List of Tables
- Table 1. Global Iridium Recycling Market Size Growth Rate by Type, 2018 VS 2022 VS 2029 (US$ Million)
- Table 2. Global Iridium Recycling Market Size Growth Rate by Application, 2018 VS 2022 VS 2029 (US$ Million)
- Table 3. Global Iridium Recycling Production Growth Rate (CAGR) by Region: 2018 VS 2022 VS 2029 (Kg)
- Table 4. Global Iridium Recycling Production by Region (2018-2023) & (Kg)
- Table 5. Global Iridium Recycling Production by Region (2024-2029) & (Kg)
- Table 6. Global Iridium Recycling Production Market Share by Region (2018-2023)
- Table 7. Global Iridium Recycling Production Market Share by Region (2024-2029)
- Table 8. Global Iridium Recycling Revenue Grow Rate (CAGR) by Region: 2018 VS 2022 VS 2029 (US$ Million)
- Table 9. Global Iridium Recycling Revenue by Region (2018-2023) & (US$ Million)
- Table 10. Global Iridium Recycling Revenue by Region (2024-2029) & (US$ Million)
- Table 11. Global Iridium Recycling Revenue Market Share by Region (2018-2023)
- Table 12. Global Iridium Recycling Revenue Market Share by Region (2024-2029)
- Table 13. Global Iridium Recycling Sales Grow Rate (CAGR) by Region: 2018 VS 2022 VS 2029 (Kg)
- Table 14. Global Iridium Recycling Sales by Region (2018-2023) & (Kg)
- Table 15. Global Iridium Recycling Sales by Region (2024-2029) & (Kg)
- Table 16. Global Iridium Recycling Sales Market Share by Region (2018-2023)
- Table 17. Global Iridium Recycling Sales Market Share by Region (2024-2029)
- Table 18. Global Iridium Recycling Sales by Manufacturers (2018-2023) & (Kg)
- Table 19. Global Iridium Recycling Sales Share by Manufacturers (2018-2023)
- Table 20. Global Iridium Recycling Revenue by Manufacturers (2018-2023) & (US$ Million)
- Table 21. Global Iridium Recycling Revenue Market Share by Manufacturers (2018-2023)
- Table 22. Iridium Recycling Price by Manufacturers (2018-2023) & (USD/g)
- Table 23. Global Key Players of Iridium Recycling, Industry Ranking in 2022
- Table 24. Global Iridium Recycling Manufacturers Market Concentration Ratio (CR5)
- Table 25. Global Iridium Recycling by Company Type (Tier 1, Tier 2, and Tier 3) & (based on the Revenue in Iridium Recycling as of 2022)
- Table 26. Global Key Manufacturers of Iridium Recycling, Manufacturing Base Distribution and Headquarters
- Table 27. Global Key Manufacturers of Iridium Recycling, Date of Established
- Table 28. Global Iridium Recycling Sales by Type (2018-2023) & (Kg)
- Table 29. Global Iridium Recycling Sales by Type (2024-2029) & (Kg)
- Table 30. Global Iridium Recycling Sales Share by Type (2018-2023)
- Table 31. Global Iridium Recycling Sales Share by Type (2024-2029)
- Table 32. Global Iridium Recycling Revenue by Type (2018-2023) & (US$ Million)
- Table 33. Global Iridium Recycling Revenue by Type (2024-2029) & (US$ Million)
- Table 34. Global Iridium Recycling Revenue Share by Type (2018-2023)
- Table 35. Global Iridium Recycling Revenue Share by Type (2024-2029)
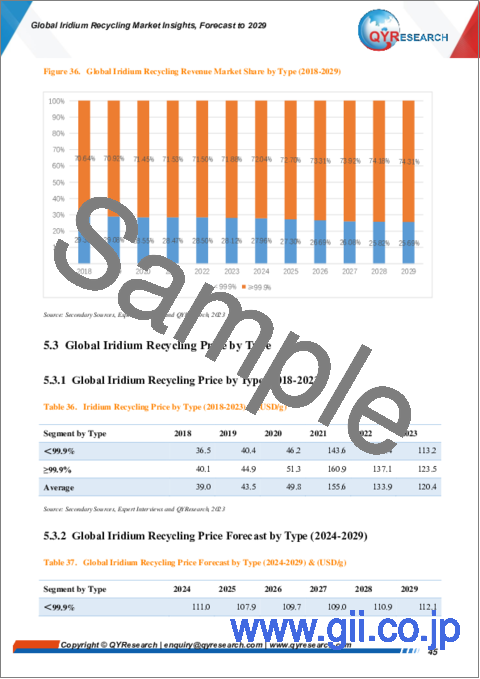
- Table 36. Iridium Recycling Price by Type (2018-2023) & (USD/g)
- Table 37. Global Iridium Recycling Price Forecast by Type (2024-2029) & (USD/g)
- Table 38. Global Iridium Recycling Sales by Application (2018-2023) & (Kg)
- Table 39. Global Iridium Recycling Sales by Application (2024-2029) & (Kg)
- Table 40. Global Iridium Recycling Sales Share by Application (2018-2023)
- Table 41. Global Iridium Recycling Sales Share by Application (2024-2029)
- Table 42. Global Iridium Recycling Revenue by Application (2018-2023) & (US$ Million)
- Table 43. Global Iridium Recycling Revenue by Application (2024-2029) & (US$ Million)
- Table 44. Global Iridium Recycling Revenue Share by Application (2018-2023)
- Table 45. Global Iridium Recycling Revenue Share by Application (2024-2029)
- Table 46. Iridium Recycling Price by Application (2018-2023) & (USD/g)
- Table 47. Global Iridium Recycling Price Forecast by Application (2024-2029) & (USD/g)
- Table 48. US & Canada Iridium Recycling Sales by Type (2018-2023) & (Kg)
- Table 49. US & Canada Iridium Recycling Sales by Type (2024-2029) & (Kg)
- Table 50. US & Canada Iridium Recycling Revenue by Type (2018-2023) & (US$ Million)
- Table 51. US & Canada Iridium Recycling Revenue by Type (2024-2029) & (US$ Million)
- Table 52. US & Canada Iridium Recycling Sales by Application (2018-2023) & (Kg)
- Table 53. US & Canada Iridium Recycling Sales by Application (2024-2029) & (Kg)
- Table 54. US & Canada Iridium Recycling Revenue by Application (2018-2023) & (US$ Million)
- Table 55. US & Canada Iridium Recycling Revenue by Application (2024-2029) & (US$ Million)
- Table 56. US & Canada Iridium Recycling Revenue by Country (2018-2023) & (US$ Million)
- Table 57. US & Canada Iridium Recycling Revenue by Country (2024-2029) & (US$ Million)
- Table 58. US & Canada Iridium Recycling Sales by Country (2018-2023) & (Kg)
- Table 59. US & Canada Iridium Recycling Sales by Country (2024-2029) & (Kg)
- Table 60. Europe Iridium Recycling Sales by Type (2018-2023) & (Kg)
- Table 61. Europe Iridium Recycling Sales by Type (2024-2029) & (Kg)
- Table 62. Europe Iridium Recycling Revenue by Type (2018-2023) & (US$ Million)
- Table 63. Europe Iridium Recycling Revenue by Type (2024-2029) & (US$ Million)
- Table 64. Europe Iridium Recycling Sales by Application (2018-2023) & (Kg)
- Table 65. Europe Iridium Recycling Sales by Application (2024-2029) & (Kg)
- Table 66. Europe Iridium Recycling Revenue by Application (2018-2023) & (US$ Million)
- Table 67. Europe Iridium Recycling Revenue by Application (2024-2029) & (US$ Million)
- Table 68. Europe Iridium Recycling Sales by Country (2018-2023) & (Kg)
- Table 69. Europe Iridium Recycling Sales by Country (2024-2029) & (Kg)
- Table 70. Europe Iridium Recycling Revenue by Country (2018-2023) & (US$ Million)
- Table 71. Europe Iridium Recycling Revenue by Country (2024-2029) & (US$ Million)
- Table 72. China Iridium Recycling Sales by Type (2018-2023) & (Kg)
- Table 73. China Iridium Recycling Sales by Type (2024-2029) & (Kg)
- Table 74. China Iridium Recycling Revenue by Type (2018-2023) & (US$ Million)
- Table 75. China Iridium Recycling Revenue by Type (2024-2029) & (US$ Million)
- Table 76. China Iridium Recycling Sales by Application (2018-2023) & (Kg)
- Table 77. China Iridium Recycling Sales by Application (2024-2029) & (Kg)
- Table 78. China Iridium Recycling Revenue by Application (2018-2023) & (US$ Million)
- Table 79. China Iridium Recycling Revenue by Application (2024-2029) & (US$ Million)
- Table 80. Asia Iridium Recycling Sales by Type (2018-2023) & (Kg)
- Table 81. Asia Iridium Recycling Sales by Type (2024-2029) & (Kg)
- Table 82. Asia Iridium Recycling Revenue by Type (2018-2023) & (US$ Million)
- Table 83. Asia Iridium Recycling Revenue by Type (2024-2029) & (US$ Million)
- Table 84. Asia Iridium Recycling Sales by Application (2018-2023) & (Kg)
- Table 85. Asia Iridium Recycling Sales by Application (2024-2029) & (Kg)
- Table 86. Asia Iridium Recycling Revenue by Application (2018-2023) & (US$ Million)
- Table 87. Asia Iridium Recycling Revenue by Application (2024-2029) & (US$ Million)
- Table 88. Asia Iridium Recycling Revenue by Region (2018-2023) & (US$ Million)
- Table 89. Asia Iridium Recycling Revenue by Region (2024-2029) & (US$ Million)
- Table 90. Asia Iridium Recycling Sales by Region (2018-2023) & (Kg)
- Table 91. Asia Iridium Recycling Sales by Region (2024-2029) & (Kg)
- Table 92. Middle East, Africa and Latin America Iridium Recycling Sales by Type (2018-2023) & (Kg)
- Table 93. Middle East, Africa and Latin America Iridium Recycling Sales by Type (2024-2029) & (Kg)
- Table 94. Middle East, Africa and Latin America Iridium Recycling Revenue by Type (2018-2023) & (US$ Million)
- Table 95. Middle East, Africa and Latin America Iridium Recycling Revenue by Type (2024-2029) & (US$ Million)
- Table 96. Middle East, Africa and Latin America Iridium Recycling Sales by Application (2018-2023) & (Kg)
- Table 97. Middle East, Africa and Latin America Iridium Recycling Sales by Application (2024-2029) & (Kg)
- Table 98. Middle East, Africa and Latin America Iridium Recycling Revenue by Application (2018-2023) & (US$ Million)
- Table 99. Middle East, Africa and Latin America Iridium Recycling Revenue by Application (2024-2029) & (US$ Million)
- Table 100. Middle East, Africa and Latin America Iridium Recycling Revenue by Country (2018-2023) & (US$ Million)
- Table 101. Middle East, Africa and Latin America Iridium Recycling Revenue by Country (2024-2029) & (US$ Million)
- Table 102. Middle East, Africa and Latin America Iridium Recycling Sales by Country (2018-2023) & (Kg)
- Table 103. Middle East, Africa and Latin America Iridium Recycling Sales by Country (2024-2029) & (Kg)
- Table 104. Umicore Corporation Information
- Table 105. Umicore Description and Major Businesses
- Table 106. Umicore Iridium Recycling Capacity, Sales (Kg), Revenue (US$ Million), Price (USD/g) and Gross Margin (2018-2023)
- Table 107. Umicore Iridium Recycling Product Model Numbers, Pictures, Descriptions and Specifications
- Table 108. PX Group Corporation Information
- Table 109. PX Group Description and Major Businesses
- Table 110. PX Group Iridium Recycling Capacity, Sales (Kg), Revenue (US$ Million), Price (USD/g) and Gross Margin (2018-2023)
- Table 111. PX Group Iridium Recycling Product Model Numbers, Pictures, Descriptions and Specifications
- Table 112. Johnson Matthey Corporation Information
- Table 113. Johnson Matthey Description and Major Businesses
- Table 114. Johnson Matthey Iridium Recycling Capacity, Sales (Kg), Revenue (US$ Million), Price (USD/g) and Gross Margin (2018-2023)
- Table 115. Johnson Matthey Iridium Recycling Product Model Numbers, Pictures, Descriptions and Specifications
- Table 116. Heraeus Corporation Information
- Table 117. Heraeus Description and Major Businesses
- Table 118. Heraeus Iridium Recycling Capacity, Sales (Kg), Revenue (US$ Million), Price (USD/g) and Gross Margin (2018-2023)
- Table 119. Heraeus Iridium Recycling Product Model Numbers, Pictures, Descriptions and Specifications
- Table 120. McCol Metals Corporation Information
- Table 121. McCol Metals Description and Major Businesses
- Table 122. McCol Metals Iridium Recycling Capacity, Sales (Kg), Revenue (US$ Million), Price (USD/g) and Gross Margin (2018-2023)
- Table 123. McCol Metals Iridium Recycling Product Model Numbers, Pictures, Descriptions and Specifications
- Table 124. Furuya Metal Corporation Information
- Table 125. Furuya Metal Description and Major Businesses
- Table 126. Furuya Metal Iridium Recycling Capacity, Sales (Kg), Revenue (US$ Million), Price (USD/g) and Gross Margin (2018-2023)
- Table 127. Furuya Metal Iridium Recycling Product Model Numbers, Pictures, Descriptions and Specifications
- Table 128. Tanaka Corporation Information
- Table 129. Tanaka Description and Major Businesses
- Table 130. Tanaka Iridium Recycling Capacity, Sales (Kg), Revenue (US$ Million), Price (USD/g) and Gross Margin (2018-2023)
- Table 131. Tanaka Iridium Recycling Product Model Numbers, Pictures, Descriptions and Specifications
- Table 132. Mastermelt Corporation Information
- Table 133. Mastermelt Description and Major Businesses
- Table 134. Mastermelt Iridium Recycling Capacity, Sales (Kg), Revenue (US$ Million), Price (USD/g) and Gross Margin (2018-2023)
- Table 135. Mastermelt Iridium Recycling Product Model Numbers, Pictures, Descriptions and Specifications
- Table 136. Sino-Platinum Metals Corporation Information
- Table 137. Sino-Platinum Metals Description and Major Businesses
- Table 138. Sino-Platinum Metals Iridium Recycling Capacity, Sales (Kg), Revenue (US$ Million), Price (USD/g) and Gross Margin (2018-2023)
- Table 139. Sino-Platinum Metals Iridium Recycling Product Model Numbers, Pictures, Descriptions and Specifications
- Table 140. Iridium Recycling Distributors List
- Table 141. Iridium Recycling Customers List
- Table 142. Iridium Recycling Market Trends
- Table 143. Iridium Recycling Market Drivers
- Table 144. Iridium Recycling Market Challenges
- Table 145. Iridium Recycling Market Restraints
- Table 146. Research Programs/Design for This Report
- Table 147. Key Data Information from Secondary Sources
- Table 148. Key Data Information from Primary Sources
- Table 149. QYR Business Unit and Senior & Team Lead Analysts
List of Figures
- Figure 1. Iridium Recycling Product Picture
- Figure 2. Global Iridium Recycling Market Size Growth Rate by Type, 2018 VS 2022 VS 2029 (US$ Million)
- Figure 3. Global Iridium Recycling Market Share by Type: 2022 & 2029
- Figure 4. Global Iridium Recycling Market Size Growth Rate by Application, 2018 VS 2022 VS 2029 (US$ Million)
- Figure 5. Global Iridium Recycling Market Share by Application in 2022 & 2029
- Figure 6. Iridium Recycling Report Years Considered
- Figure 7. Global Iridium Recycling Capacity, Production and Utilization (2018-2029) & (Kg)
- Figure 8. Global Iridium Recycling Production by Region: 2018 VS 2022 VS 2029 (Kg)
- Figure 9. Global Iridium Recycling Production Market Share by Region in Percentage: 2022 Versus 2029
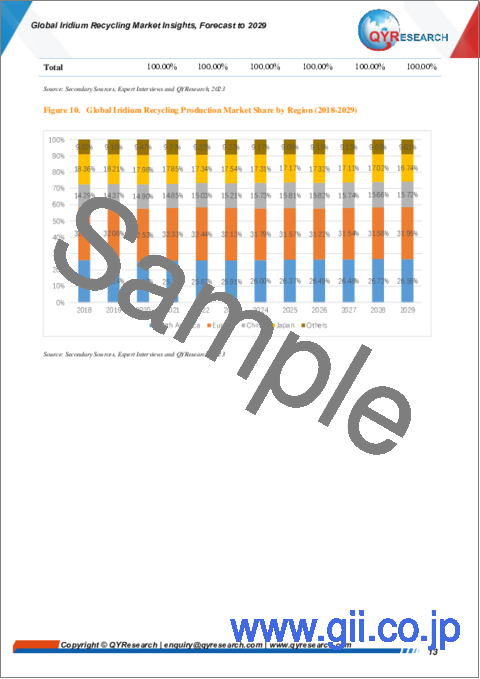
- Figure 10. Global Iridium Recycling Production Market Share by Region (2018-2029)
- Figure 11. Iridium Recycling Production Growth Rate in North America (2018-2029) & (Kg)
- Figure 12. Iridium Recycling Production Growth Rate in Europe (2018-2029) & (Kg)
- Figure 13. Iridium Recycling Production Growth Rate in China (2018-2029) & (Kg)
- Figure 14. Iridium Recycling Production Growth Rate in Japan (2018-2029) & (Kg)
- Figure 15. Global Iridium Recycling Revenue, (US$ Million), 2018 VS 2022 VS 2029
- Figure 16. Global Iridium Recycling Revenue 2018-2029 (US$ Million)
- Figure 17. Global Iridium Recycling Revenue (CAGR) by Region: 2018 VS 2022 VS 2029 (US$ Million)
- Figure 18. Global Iridium Recycling Revenue Market Share by Region in Percentage: 2022 Versus 2029
- Figure 19. Global Iridium Recycling Revenue Market Share by Region (2018-2029)
- Figure 20. Global Iridium Recycling Sales 2018-2029 (Kg)
- Figure 21. Global Iridium Recycling Sales (CAGR) by Region: 2018 VS 2022 VS 2029 (Kg)
- Figure 22. Global Iridium Recycling Sales Market Share by Region (2018-2029)
- Figure 23. US & Canada Iridium Recycling Sales YoY (2018-2029) & (Kg)
- Figure 24. US & Canada Iridium Recycling Revenue YoY (2018-2029) & (US$ Million)
- Figure 25. Europe Iridium Recycling Sales YoY (2018-2029) & (Kg)
- Figure 26. Europe Iridium Recycling Revenue YoY (2018-2029) & (US$ Million)
- Figure 27. China Iridium Recycling Sales YoY (2018-2029) & (Kg)
- Figure 28. China Iridium Recycling Revenue YoY (2018-2029) & (US$ Million)
- Figure 29. Asia (excluding China) Iridium Recycling Sales YoY (2018-2029) & (Kg)
- Figure 30. Asia (excluding China) Iridium Recycling Revenue YoY (2018-2029) & (US$ Million)
- Figure 31. Middle East, Africa and Latin America Iridium Recycling Sales YoY (2018-2029) & (Kg)
- Figure 32. Middle East, Africa and Latin America Iridium Recycling Revenue YoY (2018-2029) & (US$ Million)
- Figure 33. The Iridium Recycling Market Share of Top 5 Largest Manufacturers Around the World in 2022
- Figure 34. The Top 5 Largest Manufacturers of Iridium Recycling in the World: Market Share by Iridium Recycling Revenue in 2022
- Figure 35. Global Iridium Recycling Sales Market Share by Type (2018-2029)
- Figure 36. Global Iridium Recycling Revenue Market Share by Type (2018-2029)
- Figure 37. Global Iridium Recycling Sales Market Share by Application (2018-2029)
- Figure 38. Global Iridium Recycling Revenue Market Share by Application (2018-2029)
- Figure 39. US & Canada Iridium Recycling Sales Market Share by Type (2018-2029)
- Figure 40. US & Canada Iridium Recycling Revenue Market Share by Type (2018-2029)
- Figure 41. US & Canada Iridium Recycling Sales Market Share by Application (2018-2029)
- Figure 42. US & Canada Iridium Recycling Revenue Market Share by Application (2018-2029)
- Figure 43. US & Canada Iridium Recycling Revenue Share by Country (2018-2029)
- Figure 44. US & Canada Iridium Recycling Sales Share by Country (2018-2029)
- Figure 45. US Iridium Recycling Revenue (2018-2029) & (US$ Million)
- Figure 46. Canada Iridium Recycling Revenue (2018-2029) & (US$ Million)
- Figure 47. Europe Iridium Recycling Sales Market Share by Type (2018-2029)
- Figure 48. Europe Iridium Recycling Revenue Market Share by Type (2018-2029)
- Figure 49. Europe Iridium Recycling Sales Market Share by Application (2018-2029)
- Figure 50. Europe Iridium Recycling Revenue Market Share by Application (2018-2029)
- Figure 51. Europe Iridium Recycling Sales Share by Country (2018-2029)
- Figure 52. Europe Iridium Recycling Revenue Share by Country (2018-2029)
- Figure 53. Germany Iridium Recycling Revenue (2018-2029) & (US$ Million)
- Figure 54. France Iridium Recycling Revenue (2018-2029) & (US$ Million)
- Figure 55. U.K. Iridium Recycling Revenue (2018-2029) & (US$ Million)
- Figure 56. Italy Iridium Recycling Revenue (2018-2029) & (US$ Million)
- Figure 57. Russia Iridium Recycling Revenue (2018-2029) & (US$ Million)
- Figure 58. China Iridium Recycling Sales Market Share by Type (2018-2029)
- Figure 59. China Iridium Recycling Revenue Market Share by Type (2018-2029)
- Figure 60. China Iridium Recycling Sales Market Share by Application (2018-2029)
- Figure 61. China Iridium Recycling Revenue Market Share by Application (2018-2029)
- Figure 62. Asia Iridium Recycling Sales Market Share by Type (2018-2029)
- Figure 63. Asia Iridium Recycling Revenue Market Share by Type (2018-2029)
- Figure 64. Asia Iridium Recycling Sales Market Share by Application (2018-2029)
- Figure 65. Asia Iridium Recycling Revenue Market Share by Application (2018-2029)
- Figure 66. Asia Iridium Recycling Revenue Share by Region (2018-2029)
- Figure 67. Asia Iridium Recycling Sales Share by Region (2018-2029)
- Figure 68. Japan Iridium Recycling Revenue (2018-2029) & (US$ Million)
- Figure 69. Korea Iridium Recycling Revenue (2018-2029) & (US$ Million)
- Figure 70. China Taiwan Iridium Recycling Revenue (2018-2029) & (US$ Million)
- Figure 71. Southeast Asia Iridium Recycling Revenue (2018-2029) & (US$ Million)
- Figure 72. India Iridium Recycling Revenue (2018-2029) & (US$ Million)
- Figure 73. Middle East, Africa and Latin America Iridium Recycling Sales Market Share by Type (2018-2029)
- Figure 74. Middle East, Africa and Latin America Iridium Recycling Revenue Market Share by Type (2018-2029)
- Figure 75. Middle East, Africa and Latin America Iridium Recycling Sales Market Share by Application (2018-2029)
- Figure 76. Middle East, Africa and Latin America Iridium Recycling Revenue Market Share by Application (2018-2029)
- Figure 77. Middle East, Africa and Latin America Iridium Recycling Revenue Share by Country (2018-2029)
- Figure 78. Middle East, Africa and Latin America Iridium Recycling Sales Share by Country (2018-2029)
- Figure 79. Brazil Iridium Recycling Revenue (2018-2029) & (US$ Million)
- Figure 80. Mexico Iridium Recycling Revenue (2018-2029) & (US$ Million)
- Figure 81. Turkey Iridium Recycling Revenue (2018-2029) & (US$ Million)
- Figure 82. Israel Iridium Recycling Revenue (2018-2029) & (US$ Million)
- Figure 83. GCC Countries Iridium Recycling Revenue (2018-2029) & (US$ Million)
- Figure 84. Iridium Recycling Production Process
- Figure 85. Distributors Profiles
- Figure 86. Bottom-up and Top-down Approaches for This Report
- Figure 87. Data Triangulation
- Figure 88. Key Executives Interviewed
Due to the COVID-19 pandemic and Russia-Ukraine War Influence, the global market for Iridium Recycling estimated at US$ 534.94 million in the year 2023, is projected to reach a revised size of US$ 738.11 million by 2029, growing at a CAGR of 5.51% during the forecast period 2023-2029.
The US & Canada market for Iridium Recycling is estimated to increase from $ 195.18 million in 2023 to reach $ 279.39 million by 2029, at a CAGR of 6.16 % during the forecast period of 2023 through 2029.
The China market for Iridium Recycling is estimated to increase from $ 78.71 million in 2023 to reach $ 110.10 million by 2029, at a CAGR of 5.75 % during the forecast period of 2023 through 2029.
The Europe market for Iridium Recycling is estimated to increase from $ 170.94 million in 2023 to reach $ 228.28 million by 2029, at a CAGR of 4.94 % during the forecast period of 2023 through 2029.
The global key manufacturers of Iridium Recycling include: Umicore, PX Group, Johnson Matthey, Heraeus, McCol Metals, Furuya Metal, Tanaka, Mastermelt, Sino-Platinum Metals and etc. In 2022, the global top five players had a share approximately 56.75 % in terms of revenue.
In terms of production side, this report researches the Iridium Recycling production, growth rate, market share by manufacturers and by region (region level and country level), from 2018 to 2023, and forecast to 2029.
In terms of consumption side, this report focuses on the sales of Iridium Recycling by region (region level and country level), by company, by Type and by Application. from 2018 to 2023 and forecast to 2029.
Report Includes:
This report presents an overview of global market for Iridium Recycling, capacity, output, revenue and price. Analyses of the global market trends, with historic market revenue/sales data for 2018 - 2022, estimates for 2023, and projections of CAGR through 2029.
This report researches the key producers of Iridium Recycling, also provides the consumption of main regions and countries. Highlights of the upcoming market potential for Iridium Recycling, and key regions/countries of focus to forecast this market into various segments and sub-segments. Country specific data and market value analysis for the U.S., Canada, Mexico, Brazil, China, Japan, Korea, Southeast Asia, India, Germany, the U.K., Italy, Middle East, Africa, and Other Countries.
This report focuses on the Iridium Recycling sales, revenue, market share and industry ranking of main manufacturers, data from 2018 to 2023. Identification of the major stakeholders in the global Iridium Recycling market, and analysis of their competitive landscape and market positioning based on recent developments and segmental revenues. This report will help stakeholders to understand the competitive landscape and gain more insights and position their businesses and market strategies in a better way.
This report analyzes the segments data by Type and by Application, sales, revenue, and price, from 2018 to 2029. Evaluation and forecast the market size for Iridium Recycling sales, projected growth trends, production technology, application and end-user industry.
Descriptive company profiles of the major global players, including Umicore, PX Group, Johnson Matthey, Heraeus, McCol Metals, Furuya Metal, Tanaka, Mastermelt, and etc.
By Company
- Umicore
- PX Group
- Johnson Matthey
- Heraeus
- McCol Metals
- Furuya Metal
- Tanaka
- Mastermelt
- Sino-Platinum Metals
Segment by Type
- <99.9%
- ≥99.9%
Segment by Application
- Medical Equipment
- Catalysts
- Electronics Industry
- Others
Production by Region
- North America
- Europe
- China
- Japan
Sales by Region
- US & Canada
- U.S.
- Canada
- China
- Asia (excluding China)
- Japan
- Korea
- China Taiwan
- Southeast Asia
- India Europe
- Germany
- France
- U.K.
- Italy
- Russia
- Middle East, Africa, Latin America
- Brazil
- Mexico
- Turkey
- Israel
- GCC Countries
Chapter Outline
- Chapter 1: Introduces the report scope of the report, executive summary of different market segments (by Type and by Application, etc), including the market size of each market segment, future development potential, and so on. It offers a high-level view of the current state of the market and its likely evolution in the short to mid-term, and long term.
- Chapter 2: Iridium Recycling production/output of global and key producers (regions/countries). It provides a quantitative analysis of the production, and development potential of each producer in the next six years.
- Chapter 3: Sales (consumption), revenue of Iridium Recycling in global, regional level and country level. It provides a quantitative analysis of the market size and development potential of each region and its main countries and introduces the market development, future development prospects, market space of each country in the world.
- Chapter 4: Detailed analysis of Iridium Recycling manufacturers competitive landscape, price, sales, revenue, market share and industry ranking, latest development plan, merger, and acquisition information, etc.
- Chapter 5: Provides the analysis of various market segments by Type, covering the sales, revenue, average price, and development potential of each market segment, to help readers find the blue ocean market in different market segments.
- Chapter 6: Provides the analysis of various market segments by Application, covering the sales, revenue, average price, and development potential of each market segment, to help readers find the blue ocean market in different downstream markets.
- Chapter 7: North America (US & Canada) by Type, by Application and by country, sales, and revenue for each segment.
- Chapter 8: Europe by Type, by Application and by country, sales, and revenue for each segment.
- Chapter 9: China by Type, and by Application, sales, and revenue for each segment.
- Chapter 10: Asia (excluding China) by Type, by Application and by region, sales, and revenue for each segment.
- Chapter 11: Middle East, Africa, Latin America by Type, by Application and by country, sales, and revenue for each segment.
- Chapter 12: Provides profiles of key manufacturers, introducing the basic situation of the main companies in the market in detail, including product descriptions and specifications, Iridium Recycling sales, revenue, price, gross margin, and recent development, etc.
- Chapter 13: Analysis of industrial chain, sales channel, key raw materials, distributors and customers.
- Chapter 14: Introduces the market dynamics, latest developments of the market, the driving factors and restrictive factors of the market, the challenges and risks faced by manufacturers in the industry, and the analysis of relevant policies in the industry.
- Chapter 15: The main points and conclusions of the report.
Table of Contents
1 Study Coverage
- 1.1 Iridium Recycling Product Introduction
- 1.2 Market by Type
- 1.3 Market by Application
- 1.3.1 Global Iridium Recycling Market Size by Application, 2018 VS 2022 VS 2029
- 1.3.2 Medical Equipment
- 1.3.3 Catalysts
- 1.3.4 Electronics Industry
- 1.3.5 Others
- 1.4 Assumptions and Limitations
- 1.5 Study Objectives
- 1.6 Years Considered
2 Global Iridium Recycling Production
- 2.1 Global Iridium Recycling Production Capacity (2018-2029)
- 2.2 Global Iridium Recycling Production by Region: 2018 VS 2022 VS 2029
- 2.3 Global Iridium Recycling Production by Region
- 2.3.1 Global Iridium Recycling Historic Production by Region (2018-2023)
- 2.3.2 Global Iridium Recycling Forecasted Production by Region (2024-2029)
- 2.3.3 Global Iridium Recycling Production Market Share by Region (2018-2029)
- 2.4 North America
- 2.5 Europe
- 2.6 China
- 2.7 Japan
3 Executive Summary
- 3.1 Global Iridium Recycling Revenue Estimates and Forecasts 2018-2029
- 3.2 Global Iridium Recycling Revenue by Region
- 3.2.1 Global Iridium Recycling Revenue by Region: 2018 VS 2022 VS 2029
- 3.2.2 Global Iridium Recycling Revenue by Region (2018-2023)
- 3.2.3 Global Iridium Recycling Revenue by Region (2024-2029)
- 3.2.4 Global Iridium Recycling Revenue Market Share by Region (2018-2029)
- 3.3 Global Iridium Recycling Sales Estimates and Forecasts 2018-2029
- 3.4 Global Iridium Recycling Sales by Region
- 3.4.1 Global Iridium Recycling Sales by Region: 2018 VS 2022 VS 2029
- 3.4.2 Global Iridium Recycling Sales by Region (2018-2023)
- 3.4.3 Global Sales Iridium Recycling by Region (2024-2029)
- 3.4.4 Global Iridium Recycling Sales Market Share by Region (2018-2029)
- 3.5 US & Canada
- 3.6 Europe
- 3.7 China
- 3.8 Asia (excluding China)
- 3.9 Middle East, Africa and Latin America
4 Competition by Manufacturers
- 4.1 Global Iridium Recycling Sales by Manufacturers
- 4.1.1 Global Iridium Recycling Sales by Manufacturers (2018-2023)
- 4.1.2 Global Iridium Recycling Sales Market Share by Manufacturers (2018-2023)
- 4.1.3 Global Top 5 Largest Manufacturers of Iridium Recycling in 2022
- 4.2 Global Iridium Recycling Revenue by Manufacturers
- 4.2.1 Global Iridium Recycling Revenue by Manufacturers (2018-2023)
- 4.2.2 Global Iridium Recycling Revenue Market Share by Manufacturers (2018-2023)
- 4.2.3 Global Top 5 Companies by Iridium Recycling Revenue in 2022
- 4.3 Global Iridium Recycling Sales Price by Manufacturers (2018-2023)
- 4.4 Global Key Players of Iridium Recycling, Industry Ranking in 2022
- 4.5 Analysis of Competitive Landscape
- 4.5.1 Manufacturers Market Concentration Ratio (CR5)
- 4.5.2 Global Iridium Recycling Market Share by Company Type (Tier 1, Tier 2, and Tier 3)
- 4.6 Global Key Manufacturers of Iridium Recycling, Manufacturing Base Distribution and Headquarters
- 4.7 Global Key Manufacturers of Iridium Recycling, Date of Established
5 Market Size by Type
- 5.1 Global Iridium Recycling Sales by Type
- 5.1.1 Global Iridium Recycling Historical Sales by Type (2018-2023)
- 5.1.2 Global Iridium Recycling Forecasted Sales by Type (2024-2029)
- 5.1.3 Global Iridium Recycling Sales Market Share by Type (2018-2029)
- 5.2 Global Iridium Recycling Revenue by Type
- 5.2.1 Global Iridium Recycling Historical Revenue by Type (2018-2023)
- 5.2.2 Global Iridium Recycling Forecasted Revenue by Type (2024-2029)
- 5.2.3 Global Iridium Recycling Revenue Market Share by Type (2018-2029)
- 5.3 Global Iridium Recycling Price by Type
- 5.3.1 Global Iridium Recycling Price by Type (2018-2023)
- 5.3.2 Global Iridium Recycling Price Forecast by Type (2024-2029)
6 Market Size by Application
- 6.1 Global Iridium Recycling Sales by Application
- 6.1.1 Global Iridium Recycling Historical Sales by Application (2018-2023)
- 6.1.2 Global Iridium Recycling Forecasted Sales by Application (2024-2029)
- 6.1.3 Global Iridium Recycling Sales Market Share by Application (2018-2029)
- 6.2 Global Iridium Recycling Revenue by Application
- 6.2.1 Global Iridium Recycling Historical Revenue by Application (2018-2023)
- 6.2.2 Global Iridium Recycling Forecasted Revenue by Application (2024-2029)
- 6.2.3 Global Iridium Recycling Revenue Market Share by Application (2018-2029)
- 6.3 Global Iridium Recycling Price by Application
- 6.3.1 Global Iridium Recycling Price by Application (2018-2023)
- 6.3.2 Global Iridium Recycling Price Forecast by Application (2024-2029)
7 US & Canada
- 7.1 US & Canada Iridium Recycling Market Size by Type
- 7.1.1 US & Canada Iridium Recycling Sales by Type (2018-2029)
- 7.1.2 US & Canada Iridium Recycling Revenue by Type (2018-2029)
- 7.2 US & Canada Iridium Recycling Market Size by Application
- 7.2.1 US & Canada Iridium Recycling Sales by Application (2018-2029)
- 7.2.2 US & Canada Iridium Recycling Revenue by Application (2018-2029)
- 7.3 US & Canada Iridium Recycling Market Size by Country
- 7.3.1 US & Canada Iridium Recycling Revenue by Country (2018-2029)
- 7.3.2 US & Canada Iridium Recycling Sales by Country (2018-2029)
- 7.3.3 US
- 7.3.4 Canada
8 Europe
- 8.1 Europe Iridium Recycling Market Size by Type
- 8.1.1 Europe Iridium Recycling Sales by Type (2018-2029)
- 8.1.2 Europe Iridium Recycling Revenue by Type (2018-2029)
- 8.2 Europe Iridium Recycling Market Size by Application
- 8.2.1 Europe Iridium Recycling Sales by Application (2018-2029)
- 8.2.2 Europe Iridium Recycling Revenue by Application (2018-2029)
- 8.3 Europe Iridium Recycling Market Size by Country
- 8.3.1 Europe Iridium Recycling Sales by Country (2018-2029)
- 8.3.2 Europe Iridium Recycling Revenue by Country (2018-2029)
- 8.3.3 Germany
- 8.3.4 France
- 8.3.5 U.K.
- 8.3.6 Italy
- 8.3.7 Russia
9 China
- 9.1 China Iridium Recycling Market Size by Type
- 9.1.1 China Iridium Recycling Sales by Type (2018-2029)
- 9.1.2 China Iridium Recycling Revenue by Type (2018-2029)
- 9.2 China Iridium Recycling Market Size by Application
- 9.2.1 China Iridium Recycling Sales by Application (2018-2029)
- 9.2.2 China Iridium Recycling Revenue by Application (2018-2029)
10 Asia (excluding China)
- 10.1 Asia Iridium Recycling Market Size by Type
- 10.1.1 Asia Iridium Recycling Sales by Type (2018-2029)
- 10.1.2 Asia Iridium Recycling Revenue by Type (2018-2029)
- 10.2 Asia Iridium Recycling Market Size by Application
- 10.2.1 Asia Iridium Recycling Sales by Application (2018-2029)
- 10.2.2 Asia Iridium Recycling Revenue by Application (2018-2029)
- 10.3 Asia Iridium Recycling Market Size by Region
- 10.3.1 Asia Iridium Recycling Revenue by Region (2018-2029)
- 10.3.2 Asia Iridium Recycling Sales by Region (2018-2029)
- 10.3.3 Japan
- 10.3.4 Korea
- 10.3.5 China Taiwan
- 10.3.6 Southeast Asia
- 10.3.7 India
11 Middle East, Africa and Latin America
- 11.1 Middle East, Africa and Latin America Iridium Recycling Market Size by Type
- 11.1.1 Middle East, Africa and Latin America Iridium Recycling Sales by Type (2018-2029)
- 11.1.2 Middle East, Africa and Latin America Iridium Recycling Revenue by Type (2018-2029)
- 11.2 Middle East, Africa and Latin America Iridium Recycling Market Size by Application
- 11.2.1 Middle East, Africa and Latin America Iridium Recycling Sales by Application (2018-2029)
- 11.2.2 Middle East, Africa and Latin America Iridium Recycling Revenue by Application (2018-2029)
- 11.3 Middle East, Africa and Latin America Iridium Recycling Market Size by Country
- 11.3.1 Middle East, Africa and Latin America Iridium Recycling Revenue by Country (2018-2029)
- 11.3.2 Middle East, Africa and Latin America Iridium Recycling Sales by Country (2018-2029)
- 11.3.3 Brazil
- 11.3.4 Mexico
- 11.3.5 Turkey
- 11.3.6 Israel
- 11.3.7 GCC Countries
12 Corporate Profile
- 12.1 Umicore
- 12.1.1 Umicore Corporation Information
- 12.1.2 Umicore Overview
- 12.1.3 Umicore Iridium Recycling Capacity, Sales, Price, Revenue and Gross Margin (2018-2023)
- 12.1.4 Umicore Iridium Recycling Product Model Numbers, Pictures, Descriptions and Specifications
- 12.2 PX Group
- 12.2.1 PX Group Corporation Information
- 12.2.2 PX Group Overview
- 12.2.3 PX Group Iridium Recycling Capacity, Sales, Price, Revenue and Gross Margin (2018-2023)
- 12.2.4 PX Group Iridium Recycling Product Model Numbers, Pictures, Descriptions and Specifications
- 12.3 Johnson Matthey
- 12.3.1 Johnson Matthey Corporation Information
- 12.3.2 Johnson Matthey Overview
- 12.3.3 Johnson Matthey Iridium Recycling Capacity, Sales, Price, Revenue and Gross Margin (2018-2023)
- 12.3.4 Johnson Matthey Iridium Recycling Product Model Numbers, Pictures, Descriptions and Specifications
- 12.4 Heraeus
- 12.4.1 Heraeus Corporation Information
- 12.4.2 Heraeus Overview
- 12.4.3 Heraeus Iridium Recycling Capacity, Sales, Price, Revenue and Gross Margin (2018-2023)
- 12.4.4 Heraeus Iridium Recycling Product Model Numbers, Pictures, Descriptions and Specifications
- 12.5 McCol Metals
- 12.5.1 McCol Metals Corporation Information
- 12.5.2 McCol Metals Overview
- 12.5.3 McCol Metals Iridium Recycling Capacity, Sales, Price, Revenue and Gross Margin (2018-2023)
- 12.5.4 McCol Metals Iridium Recycling Product Model Numbers, Pictures, Descriptions and Specifications
- 12.6 Furuya Metal
- 12.6.1 Furuya Metal Corporation Information
- 12.6.2 Furuya Metal Overview
- 12.6.3 Furuya Metal Iridium Recycling Capacity, Sales, Price, Revenue and Gross Margin (2018-2023)
- 12.6.4 Furuya Metal Iridium Recycling Product Model Numbers, Pictures, Descriptions and Specifications
- 12.7 Tanaka
- 12.7.1 Tanaka Corporation Information
- 12.7.2 Tanaka Overview
- 12.7.3 Tanaka Iridium Recycling Capacity, Sales, Price, Revenue and Gross Margin (2018-2023)
- 12.7.4 Tanaka Iridium Recycling Product Model Numbers, Pictures, Descriptions and Specifications
- 12.8 Mastermelt
- 12.8.1 Mastermelt Corporation Information
- 12.8.2 Mastermelt Overview
- 12.8.3 Mastermelt Iridium Recycling Capacity, Sales, Price, Revenue and Gross Margin (2018-2023)
- 12.8.4 Mastermelt Iridium Recycling Product Model Numbers, Pictures, Descriptions and Specifications
- 12.9 Sino-Platinum Metals
- 12.9.1 Sino-Platinum Metals Corporation Information
- 12.9.2 Sino-Platinum Metals Overview
- 12.9.3 Sino-Platinum Metals Iridium Recycling Capacity, Sales, Price, Revenue and Gross Margin (2018-2023)
- 12.9.4 Sino-Platinum Metals Iridium Recycling Product Model Numbers, Pictures, Descriptions and Specifications
13 Sales Channels Analysis
- 13.1 Iridium Recycling Production Mode & Process
- 13.2 Iridium Recycling Sales and Marketing
- 13.3 Iridium Recycling Customers
14 Iridium Recycling Market Dynamics
- 14.1.1 Iridium Recycling Industry Trends
- 14.1.2 Iridium Recycling Market Drivers
- 14.1.3 Iridium Recycling Market Challenges
- 14.1.4 Iridium Recycling Market Restraints
15 Key Findings in the Global Iridium Recycling Study
16 Appendix
- 16.1 Research Methodology
- 16.1.1 Methodology/Research Approach
- 16.1.2 Data Source
- 16.2 Author Details
- 16.3 Disclaimer
