|
|
市場調査レポート
商品コード
1337861
プラスミノーゲンの世界市場、実績と予測(2018年~2029年)Global Plasminogen Market Report, History and Forecast 2018-2029 |
||||||
|
|
|||||||
カスタマイズ可能
適宜更新あり
|
|||||||


| プラスミノーゲンの世界市場、実績と予測(2018年~2029年) |
|
出版日: 2023年08月25日
発行: QYResearch
ページ情報: 英文 95 Pages
納期: 2~3営業日
|

- 全表示
- 概要
- 図表
- 目次
世界のプラスミノーゲンの市場規模は、2022年の726万米ドルから2029年末までに6,408万米ドルに達し、2023年~2029年にCAGRで39.48%の成長が予測されています。
オーファンドラッグ保護制度のため、今後5~10年間はこの分野への新規参入はないと推定されます。
当レポートでは、世界のプラスミノーゲン市場について調査分析し、市場規模の実績と予測、地域とセグメントの分析、企業プロファイルなどを提供しています。
目次
第1章 プラスミノーゲン市場の概要
- プラスミノーゲン製品の概要
- プラスミノーゲン市場:タイプ別
- 静脈注射
- 目薬
- 世界のプラスミノーゲンの市場規模:タイプ別
- 世界のプラスミノーゲンの市場規模の概要:タイプ別(2018年~2029年)
- 世界のプラスミノーゲンの市場規模の実績レビュー:タイプ別(2018年~2023年)
- 世界のプラスミノーゲンの市場規模の予測:タイプ別(2024年~2029年)
- 主要地域の市場規模:タイプ別
- 北米のプラスミノーゲンの売上の内訳:タイプ別(2018年~2023年)
- 欧州のプラスミノーゲンの売上内訳:タイプ別(2018年~2023年)
- アジア太平洋のプラスミノーゲンの売上の内訳:タイプ別(2018年~2023年)
- 南米のプラスミノーゲンの売上の内訳:タイプ別(2018年~2023年)
- 中東・アフリカのプラスミノーゲンの売上の内訳:タイプ別(2018年~2023年)
第2章 プラスミノーゲン市場競合:企業別
- 世界の主要企業:プラスミノーゲンの売上別(2018年~2023年)
- 世界の主要企業:プラスミノーゲンの収益別(2018年~2023年)
- 世界の主要企業:プラスミノーゲンの価格別(2018年~2023年)
- 世界の主要メーカーのプラスミノーゲン製造拠点の分布、販売エリア、製品タイプ
- プラスミノーゲン市場の競合状況と動向
- 主要メーカーのプラスミノーゲン市場参入日
- 主要メーカーの提供するプラスミノーゲン製品
- 合併と買収、拡大
第3章 プラスミノーゲンの現状と見通し:地域別
- 世界のプラスミノーゲンの市場規模とCAGR:地域別(2018年・2022年・2029年)
- 世界のプラスミノーゲンの市場規模の実績:地域別
- 世界のプラスミノーゲンの売上数量:地域別(2018年~2023年)
- 世界のプラスミノーゲンの売上:地域別(2018年~2023年)
- 世界のプラスミノーゲンの売上(数量と金額)、価格、粗利益(2018年~2023年)
- 世界のプラスミノーゲンの市場規模の予測:地域別
- 世界のプラスミノーゲンの売上数量:地域別(2024年~2029年)
- 世界のプラスミノーゲンの売上:地域別(2024年~2029年)
- 世界のプラスミノーゲンの売上(数量と金額)、価格、粗利益(2024年~2029年)
第4章 プラスミノーゲン:用途別
- プラスミノーゲン市場:用途別
- 木質結膜炎
- 糖尿病性足
- 創傷治癒
- その他
- 世界のプラスミノーゲンの市場規模:用途別
- 世界のプラスミノーゲンの市場規模の概要:用途別(2018年~2029年)
- 世界のプラスミノーゲンの市場規模の実績レビュー:用途別(2018年~2023年)
- 世界のプラスミノーゲンの市場規模の予測:用途別(2024年~2029年)
- 主要地域の市場規模:用途別
- 北米のプラスミノーゲンの売上の内訳:用途別(2018年~2023年)
- 欧州のプラスミノーゲンの売上の内訳:用途別(2018年~2023年)
- アジア太平洋のプラスミノーゲンの売上の内訳:用途別(2018年~2023年)
- 南米のプラスミノーゲンの売上の内訳:用途別(2018年~2023年)
- 中東・アフリカのプラスミノーゲンの売上の内訳:用途別(2018年~2023年)
第5章 北米のプラスミノーゲン:国別
- 北米のプラスミノーゲンの市場規模の実績:国別
- 北米のプラスミノーゲンの市場規模成長率(CAGR):国別(2018年・2022年・2029年)
- 北米のプラスミノーゲンの売上数量:国別(2018年~2023年)
- 北米のプラスミノーゲンの売上:国別(2018年~2023年)
- 北米のプラスミノーゲンの市場規模の予測:国別
- 北米のプラスミノーゲンの売上数量:国別(2024年~2029年)
- 北米のプラスミノーゲンの売上:国別(2024年~2029年)
第6章 欧州のプラスミノーゲン:国別
- 欧州のプラスミノーゲンの市場規模の実績:国別
- 欧州のプラスミノーゲンの市場規模成長率(CAGR):国別(2018年・2022年・2029年)
- 欧州のプラスミノーゲンの売上数量:国別(2018年~2023年)
- 欧州のプラスミノーゲンの売上:国別(2018年~2023年)
- 欧州のプラスミノーゲンの市場規模の予測:国別
- 欧州のプラスミノーゲンの売上数量:国別(2024年~2029年)
- 欧州のプラスミノーゲンの売上:国別(2024年~2029年)
第7章 アジア太平洋のプラスミノーゲン:地域別
- アジア太平洋のプラスミノーゲンの市場規模の実績:地域別
- アジア太平洋のプラスミノーゲンの売上数量:地域別(2018年~2023年)
- アジア太平洋のプラスミノーゲンの売上:地域別(2018年~2023年)
- アジア太平洋のプラスミノーゲンの市場規模の予測:地域別
- アジア太平洋のプラスミノーゲンの売上数量:地域別(2024年~2029年)
- アジア太平洋のプラスミノーゲンの売上:地域別(2024年~2029年)
第8章 南米のプラスミノーゲン:国別
- 南米のプラスミノーゲンの市場規模の実績:国別
- 南米のプラスミノーゲンの売上数量:国別(2018年~2023年)
- 南米のプラスミノーゲンの売上:国別(2018年~2023年)
- 南米のプラスミノーゲンの市場規模の予測:国別
- 南米のプラスミノーゲンの売上数量:国別(2024年~2029年)
- 南米のプラスミノーゲンの売上:国別(2024年~2029年)
第9章 中東・アフリカのプラスミノーゲン:国別
- 中東・アフリカのプラスミノーゲンの市場規模の実績:国別
- 中東・アフリカのプラスミノーゲンの売上数量:国別(2018年~2023年)
- 中東・アフリカのプラスミノーゲンの売上:国別(2018年~2023年)
- 中東・アフリカのプラスミノーゲンの市場規模の予測:国別
- 中東・アフリカのプラスミノーゲンの売上数量:国別(2024年~2029年)
- 中東・アフリカのプラスミノーゲンの売上:国別(2024年~2029年)
第10章 企業プロファイル
- Kedrion
第11章 プラスミノーゲンアクティベーター製品の主要メーカーの分析
- Genentech (Roche)
- Boehringer Ingelheim
第12章 上流、機会、課題、リスク、影響要因の分析
- プラスミノーゲンの主な原材料
- 製造コスト構造
- 原材料
- 人件費
- 製造費
- プラスミノーゲンの製造プロセス分析
- プラスミノーゲンの産業チェーン分析
- プラスミノーゲンの市場力学
- プラスミノーゲン業界の動向
- プラスミノーゲン市場の促進要因
- プラスミノーゲン市場の課題
- プラスミノーゲン市場の抑制要因
第13章 マーケティング戦略の分析、販売業者
- 販売チャネル
- プラスミノーゲンの販売業者
- オーファンドラッグ市場
- オーファンドラッグの市場規模
- 世界のオーファンドラッグの市場シェア:企業タイプ別(Tier 1・Tier 2・Tier 3)
- オーファンドラッグのタイプと市場規模
- 合併と買収、拡張計画
第14章 調査結果と結論
第15章 付録
List of Tables
- Table 1. Production Status of Global Plasminogen Major Manufacturers in 2022
- Table 2. Major Company of Intravenous Injection
- Table 3. Company or Agency involved in Production of Eye Drops
- Table 4. Global Plasminogen Sales by Type: 2018 VS 2022 VS 2029 (US$ Million)
- Table 5. Global Plasminogen Sales by Type (2018-2023) & (K Units)
- Table 6. Global Plasminogen Sales Market Share in Volume by Type (2018-2023)
- Table 7. Global Plasminogen Sales by Type (2018-2023) & (US$ Million)
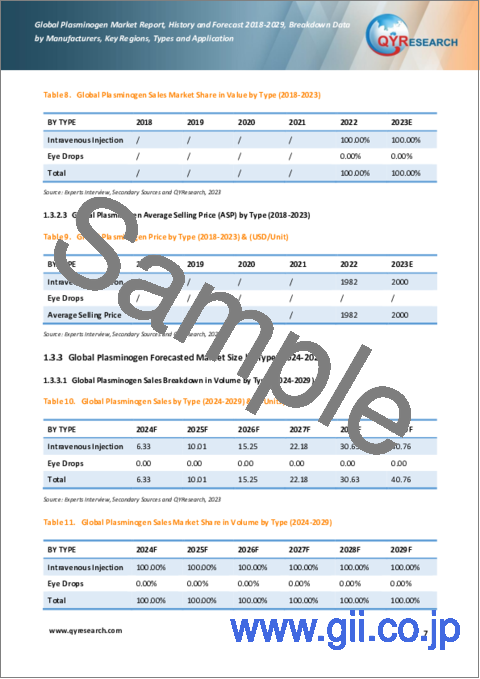
- Table 8. Global Plasminogen Sales Market Share in Value by Type (2018-2023)
- Table 9. Global Plasminogen Price by Type (2018-2023) & (USD/Unit)
- Table 10. Global Plasminogen Sales by Type (2024-2029) & (K Units)
- Table 11. Global Plasminogen Sales Market Share in Volume by Type (2024-2029)
- Table 12. Global Plasminogen Sales by Type (2024-2029) & (US$ Million)
- Table 13. Global Plasminogen Sales Market Share in Value by Type (2024-2029)
- Table 14. Global Plasminogen Price by Type (2024-2029) & (USD/Unit)
- Table 15. North America Plasminogen Sales by Type (2018-2023) & (K Units)
- Table 16. North America Plasminogen Sales by Type (2018-2023) & (US$ Million)
- Table 17. Europe Plasminogen Sales (K Units) by Type (2018-2023)
- Table 18. Europe Plasminogen Sales by Type (2018-2023) & (US$ Million)
- Table 19. Asia-Pacific Plasminogen Sales (K Units) by Type (2018-2023)
- Table 20. Asia-Pacific Plasminogen Sales by Type (2018-2023) & (US$ Million)
- Table 21. South America Plasminogen Sales (K Units) by Type (2018-2023)
- Table 22. South America Plasminogen Sales by Type (2018-2023) & (US$ Million)
- Table 23. Middle East and Africa Plasminogen Sales (K Units) by Type (2018-2023)
- Table 24. Middle East and Africa Plasminogen Sales by Type (2018-2023) & (US$ Million)
- Table 25. Global Plasminogen Sales by Company (2018-2023) & (K Units)
- Table 26. Global Plasminogen Sales Share by Company (2018-2023)
- Table 27. Global Plasminogen Revenue by Company (2018-2023) & (US$ Million)
- Table 28. Global Plasminogen Revenue Share by Company (2018-2023)
- Table 29. Global Market Plasminogen Price by Company (2018-2023) & (USD/Unit)
- Table 30. Global Plasminogen Top Manufacturers Manufacturing Base Distribution and Sales Area
- Table 31. Date of Key Manufacturers Enter into Plasminogen Market
- Table 32. Key Manufacturers Plasminogen Product Type
- Table 33. Mergers & Acquisitions, Expansion Plans
- Table 34. Global Plasminogen Market Size Comparison by Region (US$ Million): 2018 VS 2022 VS 2029
- Table 35. Global Plasminogen Sales by Region (2018-2023) & (K Units)
- Table 36. Global Plasminogen Sales Market Share in Volume by Region (2018-2023)
- Table 37. Global Plasminogen Sales by Region (2018-2023) & (US$ Million)
- Table 38. Global Plasminogen Sales Market Share in Value by Region (2018-2023)
- Table 39. Global Plasminogen Sales (K Units), Value (US$ Million), Price (USD/Unit) and Gross Margin (2018-2023)
- Table 40. Global Plasminogen Sales by Region (2024-2029) & (K Units)
- Table 41. Global Plasminogen Sales Market Share in Volume by Region (2024-2029)
- Table 42. Global Plasminogen Sales by Region (2024-2029) & (US$ Million)
- Table 43. Global Plasminogen Sales Market Share in Value by Region (2024-2029)
- Table 44. Global Plasminogen Sales (K Units), Value (US$ Million), Price (USD/Unit) and Gross Margin (2024-2029)
- Table 45. Key Participant in Ligneous Conjunctivitis Treatment
- Table 46. Key Participant in Diabetic Foot Treatment
- Table 47. Key Participant in Wound Healing Treatment
- Table 48. Global Plasminogen Sales by Application: 2018 VS 2022 VS 2029 (US$ Million)
- Table 49. Global Plasminogen Sales by Application (2018-2023) & (K Units)
- Table 50. Global Plasminogen Sales Market Share in Volume by Application (2018-2023)
- Table 51. Global Plasminogen Sales by Application (2018-2023) & (US$ Million)
- Table 52. Global Plasminogen Sales Market Share in Value by Application (2018-2023)
- Table 53. Global Plasminogen Price by Application (2018-2023) & (USD/Unit)
- Table 54. Global Plasminogen Sales by Application (2024-2029) & (K Units)
- Table 55. Global Plasminogen Sales Market Share in Volume by Application (2024-2029)
- Table 56. Global Plasminogen Sales by Application (2024-2029) & (US$ Million)
- Table 57. Global Plasminogen Sales Market Share in Value by Application (2024-2029)
- Table 58. Global Plasminogen Price by Application (2024-2029) & (USD/Unit)
- Table 59. North America Plasminogen Sales by Application (2018-2023) & (K Units)
- Table 60. North America Plasminogen Sales by Application (2018-2023) & (US$ Million)
- Table 61. Europe Plasminogen Sales (K Units) by Application (2018-2023)
- Table 62. Europe Plasminogen Sales by Application (2018-2023) & (US$ Million)
- Table 63. Asia-Pacific Plasminogen Sales (K Units) by Application (2018-2023)
- Table 64. Asia-Pacific Plasminogen Sales by Application (2018-2023) & (US$ Million)
- Table 65. South America Plasminogen Sales (K Units) by Application (2018-2023)
- Table 66. South America Plasminogen Sales by Application (2018-2023) & (US$ Million)
- Table 67. Middle East and Africa Plasminogen Sales (K Units) by Application (2018-2023)
- Table 68. Middle East and Africa Plasminogen Sales by Application (2018-2023) & (US$ Million)
- Table 69. North America Plasminogen Market Size Growth Rate (CAGR) by Country (US$ Million): 2018 VS 2022 VS 2029
- Table 70. North America Plasminogen Sales by Country (2018-2023) & (K Units)
- Table 71. North America Plasminogen Sales Market Share in Volume by Country (2018-2023)
- Table 72. North America Plasminogen Sales by Country (2018-2023) & (US$ Million)
- Table 73. North America Plasminogen Sales Market Share in Value by Country (2018-2023)
- Table 74. North America Plasminogen Sales by Country (2024-2029) & (K Units)
- Table 75. North America Plasminogen Sales Market Share in Volume by Country (2024-2029)
- Table 76. North America Plasminogen Sales by Country (2024-2029) & (US$ Million)
- Table 77. North America Plasminogen Sales Market Share in Value by Country (2024-2029)
- Table 78. Europe Plasminogen Market Size Growth Rate (CAGR) by Country (US$ Million): 2018 VS 2022 VS 2029
- Table 79. Europe Plasminogen Sales by Country (2018-2023) & (K Units)
- Table 80. Europe Plasminogen Sales by Country (2018-2023) & (US$ Million)
- Table 81. Europe Plasminogen Sales by Country (2024-2029) & (K Units)
- Table 82. Europe Plasminogen Sales Market Share in Volume by Country (2024-2029)
- Table 83. Europe Plasminogen Sales by Country (2024-2029) & (US$ Million)
- Table 84. Europe Plasminogen Sales Market Share in Value by Country (2024-2029)
- Table 85. Asia-Pacific Plasminogen Sales by Region (2018-2023) & (K Units)
- Table 86. Asia-Pacific Plasminogen Sales by Region (2018-2023) & (US$ Million)
- Table 87. Asia-Pacific Plasminogen Sales by Region (2024-2029) & (K Units)
- Table 88. Asia-Pacific Plasminogen Sales by Region (2024-2029) & (US$ Million)
- Table 89. South America Plasminogen Sales by Country (2018-2023) & (K Units)
- Table 90. South America Plasminogen Sales by Country (2018-2023) & (US$ Million)
- Table 91. South America Plasminogen Sales by Country (2024-2029) & (K Units)
- Table 92. South America Plasminogen Sales by Country (2024-2029) & (US$ Million)
- Table 93. Middle East and Africa Plasminogen Sales by Country (2018-2023) & (K Units)
- Table 94. Middle East and Africa Plasminogen Sales by Country (2018-2023) & (US$ Million)
- Table 95. Middle East and Africa Plasminogen Sales by Country (2024-2029) & (K Units)
- Table 96. Middle East and Africa Plasminogen Sales by Country (2024-2029) & (US$ Million)
- Table 97. Kedrion Company Information
- Table 98. Kedrion Introduction and Business Overview
- Table 99. Kedrion Plasminogen Sales (K Units), Revenue (US$ Million), Price (USD/Unit) and Gross Margin (2018-2023)
- Table 100. Kedrion Recent Development
- Table 101. Genentech (Roche) Company Information
- Table 102. Genentech (Roche) Activase Registration
- Table 103. Boehringer Ingelheim Company Information
- Table 104. Raw Materials Key Suppliers Lists
- Table 105. Manufacturing Cost Structure Analysis of Plasminogen in 2022
- Table 106. Equipment Involves in the Manufacturing
- Table 107. Logistics of Plasminogen Bulk Manufacturing
- Table 108. Plasminogen Market Trends
- Table 109. Plasminogen Market Drivers
- Table 110. Plasminogen Market Challenges
- Table 111. Plasminogen Market Restraints
- Table 112. Plasminogen Sales Channel List
- Table 113. Plasminogen Distributors List
- Table 114. Global Top Orphan Drugs Players by Company Type (Tier 1, Tier 2, and Tier 3) & (based on the Revenue in Orphan Drugs as of 2022)
- Table 115. Global Orphan Drugs Market by Type
- Table 116. Key Players Orphan Drugs Product Solution and Service
- Table 117. Mergers & Acquisitions, Expansion Plans
- Table 118. Research Programs/Design for This Report
- Table 119. Key Data Information from Secondary Sources
- Table 120. Key Data Information from Primary Sources
- Table 121. QYR Business Unit and Senior & Team Lead Analysts
List of Figures
- Figure 1. Plasminogen Product Picture
- Figure 2. Global Plasminogen Market Size Status and Outlook (2018-2029) & (US$ Million)
- Figure 3. Global Plasminogen Sales Status and Outlook (2018-2029) & (K Units)
- Figure 4. Global Intravenous Injection Sales YoY Growth (2018-2029) & (K Units)
- Figure 5. Product Picture of Eye Drops
- Figure 6. North America Plasminogen Sales Market Share in Volume by Type in 2022
- Figure 7. North America Plasminogen Sales Market Share in Value by Type in 2022
- Figure 8. Global Ligneous Conjunctivitis Sales YoY Growth (2018-2029) & (K Units)
- Figure 9. Product Picture of Diabetic Foot
- Figure 10. Global Diabetic Foot Ulcers & Pressure Ulcers Market Revenue (Million USD) in 2022
- Figure 11. Chronic Wounds Examples
- Figure 12. North America Plasminogen Sales Market Share in Volume by Application in 2022
- Figure 13. North America Plasminogen Sales Market Share in Value by Application in 2022
- Figure 14. Product Picture of Activase
- Figure 15. Product Picture of Actilyse
- Figure 16. Diagram of Automated Plasma Collection Procedure
- Figure 17. Plasma: Cost Components
- Figure 18. Plasminogen Bulk Manufacturing Flow Chart
- Figure 19. Plasminogen Industrial Chain Analysis
- Figure 20. Global Orphan Drugs Market Size (US$ Billion), Year-over-Year: 2017-2028
- Figure 21. Bottom-up and Top-down Approaches for This Report
- Figure 22. Data Triangulation
- Figure 23. Key Executives Interviewed
In 2021, U.S. FDA has approved Ryplazim for the treatment of patients with plasminogen deficiency type 1, which means the commercialization of Plasminogen as a kind of orphan drug. Currently Kedrion(Prometic) is the only commercialized supplier of Plasminogen in the worldwide. The global Plasminogen market was valued at US$ 7.26 million in 2022 and it will reach US$ 64.08 million by the end of 2029, growing at a CAGR of 39.48% during 2023-2029. Due to Orphan Drug Protection Mechanism, it is estimated that there would not be new entrant in this area in the coming 5-10 years.
Report Scope
This report aims to provide a comprehensive presentation of the global market for Plasminogen, with both quantitative and qualitative analysis, to help readers develop business/growth strategies, assess the market competitive situation, analyze their position in the current marketplace, and make informed business decisions regarding Plasminogen.
The Plasminogen market size, estimations, and forecasts are provided in terms of sales volume (K Units) and revenue ($ millions), considering 2022 as the base year, with history and forecast data for the period from 2018 to 2029. This report segments the global Plasminogen market comprehensively. Regional market sizes, concerning products by Type, by Application, and by players, are also provided. The influence of COVID-19 and the Russia-Ukraine War were considered while estimating market sizes.
For a more in-depth understanding of the market, the report provides profiles of the competitive landscape, key competitors, and their respective market ranks. The report also discusses technological trends and new product developments.
This report will help the readers to understand the competition within the industries and strategies for the competitive environment to enhance the potential profit. The report also focuses on the competitive landscape of the global Plasminogen market, and introduces in detail the market share, industry ranking, competitor ecosystem, market performance, new product development, operation situation, expansion, and acquisition. etc. of the main players, which helps the readers to identify the main competitors and deeply understand the competition pattern of the market.
Market Segmentation
This report covers the Plasminogen segments by manufacturers, by Type, by Application, by region and country, and provides market size (value, volume and average price) and CAGR for the history and forecast period (2018-2022, 2023-2029), considering 2022 as the base year. It elucidates potential revenue opportunities across different segments and explains attractive investment proposition matrices for this market.
By Company
- Kedrion(Prometic)
- Genentech (Roche)
- Boehringer Ingelheim
Segment by Type
- Intravenous Injection
- Eye Drops
Segment by Application
- Ligneous Conjunctivitis
- Diabetic Foot
- Wound Healing
- Others
By Region
- North America
- U.S.
- Canada
- Mexico
- Asia-Pacific
- China
- Japan
- Korea
- India
- Southeast Asia
- Others
- Europe
- Germany
- U.K.
- Italy
- South America
- Colombia
- Brazil
- Argentina
- Middle East & Africa
- Egypt
- Saudi Arabia
- UAE
Core Chapters
- Chapter One: Introduces the study scope of this report, executive summary of market segments by Type, market size segments for North America, Europe, Asia Pacific, Latin America, Middle East & Africa.
- Chapter Two: Detailed analysis of Plasminogen manufacturers competitive landscape, price, sales, revenue, market share and ranking, latest development plan, merger, and acquisition information, etc.
- Chapter Three: Sales, revenue of Plasminogen in regional level. It provides a quantitative analysis of the market size and development potential of each region and introduces the future development prospects, and market space in the world.
- Chapter Four: Introduces market segments by Application, market size segment for North America, Europe, Asia Pacific, Latin America, Middle East & Africa.
- Chapter Five, Six, Seven, Eight and Nine: North America, Europe, Asia Pacific, Latin America, Middle East & Africa, sales and revenue by country.
- Chapter Ten: Provides profiles of key players, introducing the basic situation of the main companies in the market in detail, including product sales, revenue, price, gross margin, product introduction, recent development, etc.
- Chapter Eleven: Analysis of industrial chain, key raw materials, manufacturing cost, and market dynamics. Introduces the market dynamics, latest developments of the market, the driving factors and restrictive factors of the market, the challenges and risks faced by manufacturers in the industry, and the analysis of relevant policies in the industry.
- Chapter Twelve: Analysis of sales channel, distributors and customers.
- Chapter Thirteen: Research Findings and Conclusion.
Table of Contents
1 Plasminogen Market Overview
- 1.1 Plasminogen Product Overview
- 1.2 Plasminogen Market by Type
- 1.2.1 Intravenous Injection
- 1.2.2 Eye Drops
- 1.3 Global Plasminogen Market Size by Type
- 1.3.1 Global Plasminogen Market Size Overview by Type (2018-2029)
- 1.3.2 Global Plasminogen Historic Market Size Review by Type (2018-2023)
- 1.3.3 Global Plasminogen Forecasted Market Size by Type (2024-2029)
- 1.4 Key Regions Market Size by Type
- 1.4.1 North America Plasminogen Sales Breakdown by Type (2018-2023)
- 1.4.2 Europe Plasminogen Sales Breakdown by Type (2018-2023)
- 1.4.3 Asia-Pacific Plasminogen Sales Breakdown by Type (2018-2023)
- 1.4.4 South America Plasminogen Sales Breakdown by Type (2018-2023)
- 1.4.5 Middle East and Africa Plasminogen Sales Breakdown by Type (2018-2023)
2 Plasminogen Market Competition by Company
- 2.1 Global Top Players by Plasminogen Sales (2018-2023)
- 2.2 Global Top Players by Plasminogen Revenue (2018-2023)
- 2.3 Global Top Players by Plasminogen Price (2018-2023)
- 2.4 Global Top Manufacturers Plasminogen Manufacturing Base Distribution, Sales Area, Product Type
- 2.5 Plasminogen Market Competitive Situation and Trends
- 2.6 Date of Key Manufacturers Enter into Plasminogen Market
- 2.7 Key Manufacturers Plasminogen Product Offered
- 2.8 Mergers & Acquisitions, Expansion
3 Plasminogen Status and Outlook by Region
- 3.1 Global Plasminogen Market Size and CAGR by Region: 2018 VS 2022 VS 2029
- 3.2 Global Plasminogen Historic Market Size by Region
- 3.2.1 Global Plasminogen Sales in Volume by Region (2018-2023)
- 3.2.2 Global Plasminogen Sales in Value by Region (2018-2023)
- 3.2.3 Global Plasminogen Sales (Volume & Value), Price and Gross Margin (2018-2023)
- 3.3 Global Plasminogen Forecasted Market Size by Region
- 3.3.1 Global Plasminogen Sales in Volume by Region (2024-2029)
- 3.3.2 Global Plasminogen Sales in Value by Region (2024-2029)
- 3.3.3 Global Plasminogen Sales (Volume & Value), Price and Gross Margin (2024-2029)
4 Plasminogen by Application
- 4.1 Plasminogen Market by Application
- 4.1.1 Ligneous Conjunctivitis
- 4.1.2 Diabetic Foot
- 4.1.3 Wound Healing
- 4.1.4 Other
- 4.2 Global Plasminogen Market Size by Application
- 4.2.1 Global Plasminogen Market Size Overview by Application (2018-2029)
- 4.2.2 Global Plasminogen Historic Market Size Review by Application (2018-2023)
- 4.2.3 Global Plasminogen Forecasted Market Size by Application (2024-2029)
- 4.3 Key Regions Market Size by Application
- 4.3.1 North America Plasminogen Sales Breakdown by Application (2018-2023)
- 4.3.2 Europe Plasminogen Sales Breakdown by Application (2018-2023)
- 4.3.3 Asia-Pacific Plasminogen Sales Breakdown by Application (2018-2023)
- 4.3.4 South America Plasminogen Sales Breakdown by Application (2018-2023)
- 4.3.5 Middle East and Africa Plasminogen Sales Breakdown by Application (2018-2023)
5 North America Plasminogen by Country
- 5.1 North America Plasminogen Historic Market Size by Country
- 5.1.1 North America Plasminogen Market Size Growth Rate (CAGR) by Country: 2018 VS 2022 VS 2029
- 5.1.2 North America Plasminogen Sales in Volume by Country (2018-2023)
- 5.1.3 North America Plasminogen Sales in Value by Country (2018-2023)
- 5.2 North America Plasminogen Forecasted Market Size by Country
- 5.2.1 North America Plasminogen Sales in Volume by Country (2024-2029)
- 5.2.2 North America Plasminogen Sales in Value by Country (2024-2029)
6 Europe Plasminogen by Country
- 6.1 Europe Plasminogen Historic Market Size by Country
- 6.1.1 Europe Plasminogen Market Size Growth Rate (CAGR) by Country: 2018 VS 2022 VS 2029
- 6.1.2 Europe Plasminogen Sales in Volume by Country (2018-2023)
- 6.1.3 Europe Plasminogen Sales in Value by Country (2018-2023)
- 6.2 Europe Plasminogen Forecasted Market Size by Country
- 6.2.1 Europe Plasminogen Sales in Volume by Country (2024-2029)
- 6.2.2 Europe Plasminogen Sales in Value by Country (2024-2029)
7 Asia-Pacific Plasminogen by Region
- 7.1 Asia-Pacific Plasminogen Historic Market Size by Region
- 7.1.1 Asia-Pacific Plasminogen Sales in Volume by Region (2018-2023)
- 7.1.2 Asia-Pacific Plasminogen Sales in Value by Region (2018-2023)
- 7.2 Asia-Pacific Plasminogen Forecasted Market Size by Region
- 7.2.1 Asia-Pacific Plasminogen Sales in Volume by Region (2024-2029)
- 7.2.2 Asia-Pacific Plasminogen Sales in Value by Region (2024-2029)
8 South America Plasminogen by Country
- 8.1 South America Plasminogen Historic Market Size by Country
- 8.1.1 South America Plasminogen Sales in Volume by Country (2018-2023)
- 8.1.2 South America Plasminogen Sales in Value by Country (2018-2023)
- 8.2 South America Plasminogen Forecasted Market Size by Country
- 8.2.1 South America Plasminogen Sales in Volume by Country (2024-2029)
- 8.2.2 South America Plasminogen Sales in Value by Country (2024-2029)
9 Middle East and Africa Plasminogen by Country
- 9.1 Middle East and Africa Plasminogen Historic Market Size by Country
- 9.1.1 Middle East and Africa Plasminogen Sales in Volume by Country (2018-2023)
- 9.1.2 Middle East and Africa Plasminogen Sales in Value by Country (2018-2023)
- 9.2 Middle East and Africa Plasminogen Forecasted Market Size by Country
- 9.2.1 Middle East and Africa Plasminogen Sales in Volume by Country (2024-2029)
- 9.2.2 Middle East and Africa Plasminogen Sales in Value by Country (2024-2029)
10 Company Profiles
- 10.1 Kedrion
- 10.1.1 Kedrion Company Information
- 10.1.2 Kedrion Introduction and Business Overview
- 10.1.3 Kedrion Plasminogen Sales, Revenue and Gross Margin (2018-2023)
- 10.1.4 Kedrion Plasminogen Products Offered
- 10.1.5 Kedrion Recent Development
11 Major Manufacturers Analysis of Plasminogen Activator Product
- 11.1 Genentech (Roche)
- 11.1.1 Genentech (Roche) Company Information
- 11.1.2 Genentech (Roche) Plasminogen Products Offered
- 11.2 Boehringer Ingelheim
- 11.2.1 Boehringer Ingelheim Company Information
- 11.2.2 Boehringer Ingelheim Plasminogen Products Offered
12 Upstream, Opportunities, Challenges, Risks and Influences Factors Analysis
- 12.1 Plasminogen Key Raw Materials
- 12.2 Manufacturing Cost Structure
- 12.2.1 Raw Materials
- 12.2.2 Labor Cost
- 12.2.3 Manufacturing Expenses
- 12.3 Manufacturing Process Analysis of Plasminogen
- 12.4 Plasminogen Industrial Chain Analysis
- 12.5 Plasminogen Market Dynamics
- 12.5.1 Plasminogen Industry Trends
- 12.5.2 Plasminogen Market Drivers
- 12.5.3 Plasminogen Market Challenges
- 12.5.4 Plasminogen Market Restraints
13 Marketing Strategy Analysis, Distributors
- 13.1 Sales Channel
- 13.2 Plasminogen Distributors
- 13.3 Orphan Drugs Market
- 13.3.1 Orphan Drugs Market Size
- 13.3.2 Global Orphan Drugs Market Share by Company Type (Tier 1, Tier 2, and Tier 3)
- 13.3.3 Orphan Drugs Type and Market Size
- 13.3.4 Mergers & Acquisitions, Expansion Plans
14 Research Findings and Conclusion
15 Appendix
- 15.1 Research Methodology
- 15.1.1 Methodology/Research Approach
- 15.1.2 Data Source
- 15.2 Author Details
- 15.3 Disclaimer
