|
|
市場調査レポート
商品コード
1327701
シェアレジストリーサービスの世界市場:2023年Global Share Registry Services Market Research Report 2023 |
||||||
|
|
|||||||
カスタマイズ可能
適宜更新あり
|
|||||||


| シェアレジストリーサービスの世界市場:2023年 |
|
出版日: 2023年08月14日
発行: QYResearch
ページ情報: 英文 103 Pages
納期: 2~3営業日
|

- 全表示
- 概要
- 図表
- 目次
世界のシェアレジストリーサービスの市場規模は、2022年の13億5,720万米ドルから、予測期間中は4.0%のCAGRで推移し、2029年には17億9,210万米ドルの規模に成長すると予測されています。
市場規模・推計にあたっては、COVID-19とロシア・ウクライナ戦争の影響を考慮しています。
世界のシェアレジストリーサービス上位ベンダー3社による2022年の収益シェアは約64%を示しています。
当レポートでは、世界のシェアレジストリーサービスの市場を調査し、市場および製品の概要、競合情勢、市場規模の推移・予測、各種区分・地域/主要国別の詳細分析、価格動向、市場成長への各種影響因子の分析、主要企業の分析などをまとめています。
目次
第1章 レポート概要
- 調査範囲
- 用途別市場
- 市場成長:2018年 vs 2022年 vs 2029年
- 発行者向け
- 投資家向け
- 前提・制限
- 調査目的
- 調査年数
第2章 世界の成長動向
- 市場の展望
- 成長動向:地域別
- 市場規模:2018年 vs 2022年 vs 2029年
- 市場規模の推移
- 市場規模の予測
- 市場力学
- 産業動向
- 市場促進要因
- 市場課題
第3章 競合情勢:主要企業別
- 世界の主要企業:収益別
- 市場シェア:企業タイプ別
- 主要企業ランキング
- 市場集中率
- 世界の主要企業:本社・サービス提供地域
- M&A・拡張計画
第4章 シェアレジストリーサービスの内訳データ:用途別
- 市場規模の推移
- 市場規模の予測
第5章 北米
第6章 欧州
第7章 アジア太平洋
第8章 ラテンアメリカ
第9章 中東・アフリカ
第10章 主要企業のプロファイル
- Computershare
- Equiniti
- AST
- Link Group
- Boardroom
- Tricor
- Automic Group
- Advanced Share Registry
- Apex(Mainstream)
- Central Depository Company
第11章 アナリストの展望・総論
第12章 付録
List of Tables
- Table 1. Global Share Registry Services Market Size Growth by Application (US$ Million): 2018 VS 2022 VS 2029
- Table 2. Global Share Registry Services Market Size by Region (US$ Million): 2018 VS 2022 VS 2029
- Table 3. Global Share Registry Services Market Size by Region (2018-2023) & (US$ Million)
- Table 4. Global Share Registry Services Market Share by Region (2018-2023)
- Table 5. Global Share Registry Services Forecasted Market Size by Region (2024-2029) & (US$ Million)
- Table 6. Global Share Registry Services Market Share by Region (2024-2029)
- Table 7. Share Registry Services Market Trends
- Table 8. Share Registry Services Market Drivers
- Table 9. Share Registry Services Market Challenges
- Table 10. Global Share Registry Services Revenue by Players (2018-2023) & (US$ Million)
- Table 11. Global Share Registry Services Market Share by Players (2018-2023)
- Table 12. Global Top Share Registry Services Players by Company Type (Tier 1, Tier 2, and Tier 3) & (based on the Revenue in Share Registry Services as of 2022)
- Table 13. Ranking of Global Top Share Registry Services Companies by Revenue (US$ Million) in 2022
- Table 14. Global 5 Largest Players Market Share by Share Registry Services Revenue (CR5) & (2018-2023)
- Table 15. Global Key Players of Share Registry Services, Headquarters and Area Served
- Table 16. Mergers & Acquisitions, Expansion Plans
- Table 17. Global Share Registry Services Market Size by Application (2018-2023) & (US$ Million)
- Table 18. Global Share Registry Services Revenue Market Share by Application (2018-2023)
- Table 19. Global Share Registry Services Forecasted Market Size by Application (2024-2029) & (US$ Million)
- Table 20. Global Share Registry Services Revenue Market Share by Application (2024-2029)
- Table 21. North America Share Registry Services Market Size Growth Rate by Country (US$ Million): 2018 VS 2022 VS 2029
- Table 22. North America Share Registry Services Market Size by Country (2018-2023) & (US$ Million)
- Table 23. North America Share Registry Services Market Size by Country (2024-2029) & (US$ Million)
- Table 24. Europe Share Registry Services Market Size Growth Rate by Country (US$ Million): 2018 VS 2022 VS 2029
- Table 25. Europe Share Registry Services Market Size by Country (2018-2023) & (US$ Million)
- Table 26. Europe Share Registry Services Market Size by Country (2024-2029) & (US$ Million)
- Table 27. Asia-Pacific Share Registry Services Market Size Growth Rate by Country (US$ Million): 2018 VS 2022 VS 2029
- Table 28. Asia-Pacific Share Registry Services Market Size by Region (2018-2023) & (US$ Million)
- Table 29. Asia-Pacific Share Registry Services Market Size by Region (2024-2029) & (US$ Million)
- Table 30. Latin America Share Registry Services Market Size Growth Rate by Country (US$ Million): 2018 VS 2022 VS 2029
- Table 31. Latin America Share Registry Services Market Size by Country (2018-2023) & (US$ Million)
- Table 32. Latin America Share Registry Services Market Size by Country (2024-2029) & (US$ Million)
- Table 33. Middle East & Africa Share Registry Services Market Size Growth Rate by Country (US$ Million): 2018 VS 2022 VS 2029
- Table 34. Middle East & Africa Share Registry Services Market Size by Country (2018-2023) & (US$ Million)
- Table 35. Middle East & Africa Share Registry Services Market Size by Country (2024-2029) & (US$ Million)
- Table 36. Computershare Company Details
- Table 37. Computershare Business Overview
- Table 38. Computershare Share Registry Services Product
- Table 39. Computershare Revenue in Share Registry Services Business (2018-2023) & (US$ Million)
- Table 40. Computershare Recent Development
- Table 41. Equiniti Company Details
- Table 42. Equiniti Business Overview
- Table 43. Equiniti Share Registry Services Product
- Table 44. Equiniti Revenue in Share Registry Services Business (2018-2023) & (US$ Million)
- Table 45. Equiniti Recent Development
- Table 46. AST Company Details
- Table 47. AST Business Overview
- Table 48. AST Share Registry Services Product
- Table 49. AST Revenue in Share Registry Services Business (2018-2023) & (US$ Million)
- Table 50. AST Recent Development
- Table 51. Link Group Company Details
- Table 52. Link Group Business Overview
- Table 53. Link Group Share Registry Services Product
- Table 54. Link Group Revenue in Share Registry Services Business (2018-2023) & (US$ Million)
- Table 55. Link Group Recent Development
- Table 56. Boardroom Company Details
- Table 57. Boardroom Business Overview
- Table 58. Boardroom Share Registry Services Product
- Table 59. Boardroom Revenue in Share Registry Services Business (2018-2023) & (US$ Million)
- Table 60. Boardroom Recent Development
- Table 61. Tricor Company Details
- Table 62. Tricor Business Overview
- Table 63. Tricor Share Registry Services Product
- Table 64. Tricor Revenue in Share Registry Services Business (2018-2023) & (US$ Million)
- Table 65. Tricor Recent Development
- Table 66. Automic Group Company Details
- Table 67. Automic Group Business Overview
- Table 68. Automic Group Share Registry Services Product
- Table 69. Automic Group Revenue in Share Registry Services Business (2018-2023) & (US$ Million)
- Table 70. Automic Group Recent Development
- Table 71. Advanced Share Registry Company Details
- Table 72. Advanced Share Registry Business Overview
- Table 73. Advanced Share Registry Share Registry Services Product
- Table 74. Advanced Share Registry Revenue in Share Registry Services Business (2018-2023) & (US$ Million)
- Table 75. Apex (Mainstream) Company Details
- Table 76. Apex (Mainstream) Business Overview
- Table 77. Apex (Mainstream) Share Registry Services Product
- Table 78. Apex (Mainstream) Revenue in Share Registry Services Business (2018-2023) & (US$ Million)
- Table 79. Apex (Mainstream) Recent Development
- Table 80. Central Depository Company Company Details
- Table 81. Central Depository Company Business Overview
- Table 82. Central Depository Company Share Registry Services Product
- Table 83. Central Depository Company Revenue in Share Registry Services Business (2018-2023) & (US$ Million)
- Table 84. Research Programs/Design for This Report
- Table 85. Key Data Information from Secondary Sources
- Table 86. Key Data Information from Primary Sources
- Table 87. Authors List of This Report
List of Figures
- Figure 1. Global Share Registry Services Market Size by Application (2023-2029) & (US$ Million)
- Figure 2. Global Share Registry Services Market Share by Application: 2022 VS 2029
- Figure 3. For Issuers Market Size (2018-2029)
- Figure 4. For Investors Market Size (2018-2029)
- Figure 5. Share Registry Services Report Years Considered
- Figure 6. Global Share Registry Services Market Size (US$ Million), Year-over-Year: 2018-2029
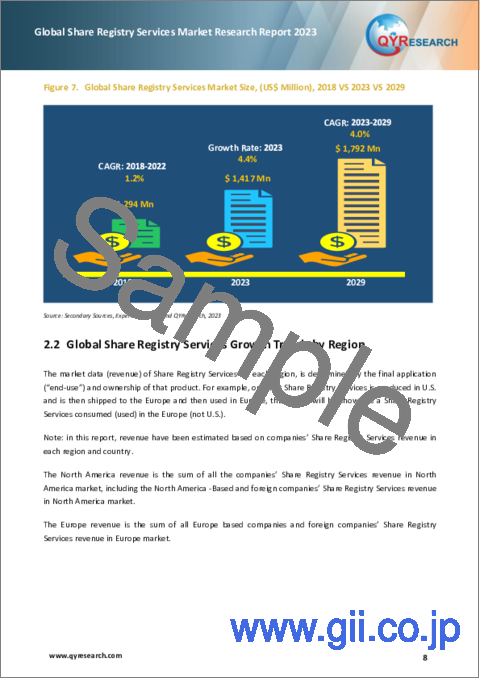
- Figure 7. Global Share Registry Services Market Size, (US$ Million), 2018 VS 2023 VS 2029
- Figure 8. Global Share Registry Services Market Share by Region: 2022 VS 2029
- Figure 9. Global Share Registry Services Market Share by Players in 2022
- Figure 10. Global Top Share Registry Services Players by Company Type (Tier 1, Tier 2, and Tier 3) & (based on the Revenue in Share Registry Services as of 2022)
- Figure 11. The Top 5 Players Market Share by Share Registry Services Revenue in 2022
- Figure 12. North America Share Registry Services Market Size YoY Growth (2018-2029) & (US$ Million)
- Figure 13. North America Share Registry Services Market Share by Country (2018-2029)
- Figure 14. United States Share Registry Services Market Size YoY Growth (2018-2029) & (US$ Million)
- Figure 15. Canada Share Registry Services Market Size YoY Growth (2018-2029) & (US$ Million)
- Figure 16. Europe Share Registry Services Market Size YoY Growth (2018-2029) & (US$ Million)
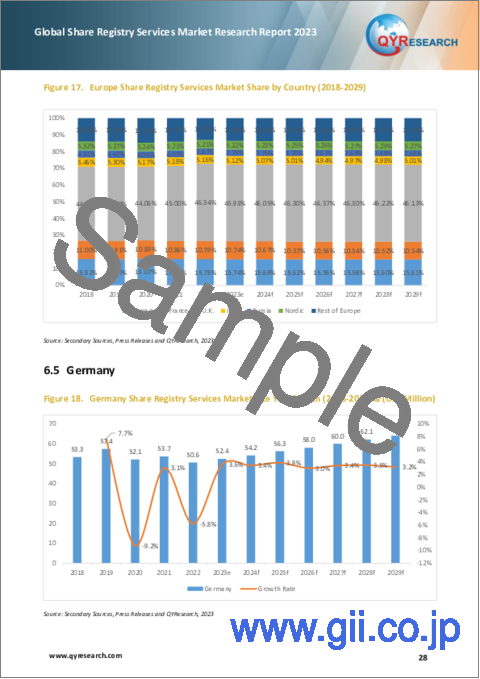
- Figure 17. Europe Share Registry Services Market Share by Country (2018-2029)
- Figure 18. Germany Share Registry Services Market Size YoY Growth (2018-2029) & (US$ Million)
- Figure 19. France Share Registry Services Market Size YoY Growth (2018-2029) & (US$ Million)
- Figure 20. U.K. Share Registry Services Market Size YoY Growth (2018-2029) & (US$ Million)
- Figure 21. Italy Share Registry Services Market Size YoY Growth (2018-2029) & (US$ Million)
- Figure 22. Russia Share Registry Services Market Size YoY Growth (2018-2029) & (US$ Million)
- Figure 23. Nordic Countries Share Registry Services Market Size YoY Growth (2018-2029) & (US$ Million)
- Figure 24. Asia-Pacific Share Registry Services Market Size YoY Growth (2018-2029) & (US$ Million)
- Figure 25. Asia-Pacific Share Registry Services Market Share by Region (2018-2029)
- Figure 26. China Share Registry Services Market Size YoY Growth (2018-2029) & (US$ Million)
- Figure 27. Japan Share Registry Services Market Size YoY Growth (2018-2029) & (US$ Million)
- Figure 28. South Korea Share Registry Services Market Size YoY Growth (2018-2029) & (US$ Million)
- Figure 29. Southeast Asia Share Registry Services Market Size YoY Growth (2018-2029) & (US$ Million)
- Figure 30. India Share Registry Services Market Size YoY Growth (2018-2029) & (US$ Million)
- Figure 31. Australia Share Registry Services Market Size YoY Growth (2018-2029) & (US$ Million)
- Figure 32. Latin America Share Registry Services Market Size YoY Growth (2018-2029) & (US$ Million)
- Figure 33. Latin America Share Registry Services Market Share by Country (2018-2029)
- Figure 34. Mexico Share Registry Services Market Size YoY Growth (2018-2029) & (US$ Million)
- Figure 35. Brazil Share Registry Services Market Size YoY Growth (2018-2029) & (US$ Million)
- Figure 36. Middle East & Africa Share Registry Services Market Size YoY Growth (2018-2029) & (US$ Million)
- Figure 37. Middle East & Africa Share Registry Services Market Share by Country (2018-2029)
- Figure 38. Turkey Share Registry Services Market Size YoY Growth (2018-2029) & (US$ Million)
- Figure 39. Saudi Arabia Share Registry Services Market Size YoY Growth (2018-2029) & (US$ Million)
- Figure 40. UAE Share Registry Services Market Size YoY Growth (2018-2029) & (US$ Million)
- Figure 41. Computershare Revenue Growth Rate in Share Registry Services Business (2018-2023)
- Figure 42. Equiniti Revenue Growth Rate in Share Registry Services Business (2018-2023)
- Figure 43. AST Revenue Growth Rate in Share Registry Services Business (2018-2023)
- Figure 44. Link Group Revenue Growth Rate in Share Registry Services Business (2018-2023)
- Figure 45. Boardroom Revenue Growth Rate in Share Registry Services Business (2018-2023)
- Figure 46. Tricor Revenue Growth Rate in Share Registry Services Business (2018-2023)
- Figure 47. Automic Group Revenue Growth Rate in Share Registry Services Business (2018-2023)
- Figure 48. Advanced Share Registry Revenue Growth Rate in Share Registry Services Business (2018-2023)
- Figure 49. Apex (Mainstream) Revenue Growth Rate in Share Registry Services Business (2018-2023)
- Figure 50. Central Depository Company Revenue Growth Rate in Share Registry Services Business (2018-2023)
- Figure 51. Bottom-up and Top-down Approaches for This Report
- Figure 52. Data Triangulation
- Figure 53. Key Executives Interviewed
The global Share Registry Services market was valued at US$ 1,357.2 million in 2022 and is anticipated to reach US$ 1,792.1 million by 2029, witnessing a CAGR of 4.0% during the forecast period 2023-2029. The influence of COVID-19 and the Russia-Ukraine War were considered while estimating market sizes.
The major global companies of Share Registry Services include: Computershare, Equiniti, AST, Link Group, Boardroom, Tricor, Automic Group, Advanced Share Registry, and Apex (Mainstream), etc. In 2022, the world's top three vendors accounted for approximately 64% of the revenue.
Report Scope
This report aims to provide a comprehensive presentation of the global market for Share Registry Services, with both quantitative and qualitative analysis, to help readers develop business/growth strategies, assess the market competitive situation, analyze their position in the current marketplace, and make informed business decisions regarding Share Registry Services.
The Share Registry Services market size, estimations, and forecasts are provided in terms of and revenue ($ millions), considering 2022 as the base year, with history and forecast data for the period from 2018 to 2029. This report segments the global Share Registry Services market comprehensively. Regional market sizes, concerning products by Type, by Application, and by players, are also provided.
For a more in-depth understanding of the market, the report provides profiles of the competitive landscape, key competitors, and their respective market ranks. The report also discusses technological trends and new product developments.
The report will help the Share Registry Services companies, new entrants, and industry chain related companies in this market with information on the revenues for the overall market and the sub-segments across the different segments, by company, by Type, by Application, and by regions.
By Company
- Computershare
- Equiniti
- AST
- Link Group
- Boardroom
- Tricor
- Automic Group
- Advanced Share Registry
- Apex (Mainstream)
- Central Depository Company
Segment by Application
- For Issuers
- For Investors
By Region
- North America
- United States
- Canada
- Asia-Pacific
- China
- Japan
- South Korea
- Southeast Asia
- India
- Australia
- Europe
- Germany
- France
- U.K.
- Italy
- Russia
- Nordic Countries
- Rest of Europe
- Latin America
- Mexico
- Brazil
- Rest of Latin America
- Middle East & Africa
- Turkey
- Saudi Arabia
- UAE
- Rest of MEA
Core Chapters
- Chapter 1: Introduces the report scope of the report, executive summary of different market segments (by Type, by Application, etc), including the market size of each market segment, future development potential, and so on. It offers a high-level view of the current state of the market and its likely evolution in the short to mid-term, and long term.
- Chapter 2: Introduces executive summary of global market size, regional market size, this section also introduces the market dynamics, latest developments of the market, the driving factors and restrictive factors of the market, the challenges and risks faced by companies in the industry, and the analysis of relevant policies in the industry.
- Chapter 3: Detailed analysis of Share Registry Services companies's competitive landscape, revenue market share, latest development plan, merger, and acquisition information, etc.
- Chapter 5: Provides the analysis of various market segments by Application, covering the market size and development potential of each market segment, to help readers find the blue ocean market in different downstream markets.
- Chapter 5, 6, 7, 8, 9: North America, Europe, Asia Pacific, Latin America, Middle East and Africa segment by country. It provides a quantitative analysis of the market size and development potential of each region and its main countries and introduces the market development, future development prospects, market space, and capacity of each country in the world.
- Chapter 10: Provides profiles of key players, introducing the basic situation of the main companies in the market in detail, including product sales, revenue, price, gross margin, product introduction, recent development, etc.
- Chapter 11: The main points and conclusions of the report.
Table of Contents
1 Report Overview
- 1.1 Study Scope
- 1.2 Market by Application
- 1.2.1 Global Share Registry Services Market Growth by Application: 2018 VS 2022 VS 2029
- 1.2.2 For Issuers
- 1.2.3 For Investors
- 1.3 Assumptions and Limitations
- 1.4 Study Objectives
- 1.5 Years Considered
2 Global Growth Trends
- 2.1 Global Share Registry Services Market Perspective (2018-2029)
- 2.2 Global Share Registry Services Growth Trends by Region
- 2.2.1 Global Share Registry Services Market Size by Region: 2018 VS 2022 VS 2029
- 2.2.2 Share Registry Services Historic Market Size by Region (2018-2023)
- 2.2.3 Share Registry Services Forecasted Market Size by Region (2024-2029)
- 2.3 Share Registry Services Market Dynamics
- 2.3.1 Share Registry Services Industry Trends
- 2.3.2 Share Registry Services Market Drivers
- 2.3.3 Share Registry Services Market Challenges
3 Competition Landscape by Key Players
- 3.1 Global Top Share Registry Services Players by Revenue
- 3.1.1 Global Top Share Registry Services Players by Revenue (2018-2023)
- 3.1.2 Global Share Registry Services Revenue Market Share by Players (2018-2023)
- 3.2 Global Share Registry Services Market Share by Company Type (Tier 1, Tier 2, and Tier 3)
- 3.3 Global Key Players Ranking by Share Registry Services Revenue
- 3.4 Global Share Registry Services Market Concentration Ratio
- 3.4.1 Global Share Registry Services Market Concentration Ratio (CR5)
- 3.4.2 Global Top 5 Companies by Share Registry Services Revenue in 2022
- 3.5 Global Key Players of Share Registry Services Head office and Area Served
- 3.6 Mergers & Acquisitions, Expansion Plans
4 Share Registry Services Breakdown Data by Application
- 4.1 Global Share Registry Services Historic Market Size by Application (2018-2023)
- 4.2 Global Share Registry Services Forecasted Market Size by Application (2024-2029)
5 North America
- 5.1 North America Share Registry Services Market Size (2018-2029)
- 5.2 North America Share Registry Services Market Growth Rate by Country: 2018 VS 2022 VS 2029
- 5.3 North America Share Registry Services Market Size by Country (2018-2023)
- 5.4 North America Share Registry Services Market Size by Country (2024-2029)
- 5.5 United States
- 5.6 Canada
6 Europe
- 6.1 Europe Share Registry Services Market Size (2018-2029)
- 6.2 Europe Share Registry Services Market Growth Rate by Country: 2018 VS 2022 VS 2029
- 6.3 Europe Share Registry Services Market Size by Country (2018-2023)
- 6.4 Europe Share Registry Services Market Size by Country (2024-2029)
- 6.5 Germany
- 6.6 France
- 6.7 U.K.
- 6.8 Italy
- 6.9 Russia
- 6.10 Nordic Countries
7 Asia-Pacific
- 7.1 Asia-Pacific Share Registry Services Market Size (2018-2029)
- 7.2 Asia-Pacific Share Registry Services Market Growth Rate by Country: 2018 VS 2022 VS 2029
- 7.3 Asia-Pacific Share Registry Services Market Size by Region (2018-2023)
- 7.4 Asia-Pacific Share Registry Services Market Size by Region (2024-2029)
- 7.5 China
- 7.6 Japan
- 7.7 South Korea
- 7.8 Southeast Asia
- 7.9 India
- 7.10 Australia
8 Latin America
- 8.1 Latin America Share Registry Services Market Size (2018-2029)
- 8.2 Latin America Share Registry Services Market Growth Rate by Country: 2018 VS 2022 VS 2029
- 8.3 Latin America Share Registry Services Market Size by Country (2018-2023)
- 8.4 Latin America Share Registry Services Market Size by Country (2024-2029)
- 8.5 Mexico
- 8.6 Brazil
9 Middle East & Africa
- 9.1 Middle East & Africa Share Registry Services Market Size (2018-2029)
- 9.2 Middle East & Africa Share Registry Services Market Growth Rate by Country: 2018 VS 2022 VS 2029
- 9.3 Middle East & Africa Share Registry Services Market Size by Country (2018-2023)
- 9.4 Middle East & Africa Share Registry Services Market Size by Country (2024-2029)
- 9.5 Turkey
- 9.6 Saudi Arabia
- 9.7 UAE
10 Key Players Profiles
- 10.1 Computershare
- 10.1.1 Computershare Company Details
- 10.1.2 Computershare Business Overview
- 10.1.3 Computershare Share Registry Services Introduction
- 10.1.4 Computershare Revenue in Share Registry Services Business (2018-2023)
- 10.1.5 Computershare Recent Development
- 10.2 Equiniti
- 10.2.1 Equiniti Company Details
- 10.2.2 Equiniti Business Overview
- 10.2.3 Equiniti Share Registry Services Introduction
- 10.2.4 Equiniti Revenue in Share Registry Services Business (2018-2023)
- 10.2.5 Equiniti Recent Development
- 10.3 AST
- 10.3.1 AST Company Details
- 10.3.2 AST Business Overview
- 10.3.3 AST Share Registry Services Introduction
- 10.3.4 AST Revenue in Share Registry Services Business (2018-2023)
- 10.3.5 AST Recent Development
- 10.4 Link Group
- 10.4.1 Link Group Company Details
- 10.4.2 Link Group Business Overview
- 10.4.3 Link Group Share Registry Services Introduction
- 10.4.4 Link Group Revenue in Share Registry Services Business (2018-2023)
- 10.4.5 Link Group Recent Development
- 10.5 Boardroom
- 10.5.1 Boardroom Company Details
- 10.5.2 Boardroom Business Overview
- 10.5.3 Boardroom Share Registry Services Introduction
- 10.5.4 Boardroom Revenue in Share Registry Services Business (2018-2023)
- 10.5.5 Boardroom Recent Development
- 10.6 Tricor
- 10.6.1 Tricor Company Details
- 10.6.2 Tricor Business Overview
- 10.6.3 Tricor Share Registry Services Introduction
- 10.6.4 Tricor Revenue in Share Registry Services Business (2018-2023)
- 10.6.5 Tricor Recent Development
- 10.7 Automic Group
- 10.7.1 Automic Group Company Details
- 10.7.2 Automic Group Business Overview
- 10.7.3 Automic Group Share Registry Services Introduction
- 10.7.4 Automic Group Revenue in Share Registry Services Business (2018-2023)
- 10.7.5 Automic Group Recent Development
- 10.8 Advanced Share Registry
- 10.8.1 Advanced Share Registry Company Details
- 10.8.2 Advanced Share Registry Business Overview
- 10.8.3 Advanced Share Registry Share Registry Services Introduction
- 10.8.4 Advanced Share Registry Revenue in Share Registry Services Business (2018-2023)
- 10.9 Apex (Mainstream)
- 10.9.1 Apex (Mainstream) Company Details
- 10.9.2 Apex (Mainstream) Business Overview
- 10.9.3 Apex (Mainstream) Share Registry Services Introduction
- 10.9.4 Apex (Mainstream) Revenue in Share Registry Services Business (2018-2023)
- 10.9.5 Apex (Mainstream) Recent Development
- 10.10 Central Depository Company
- 10.10.1 Central Depository Company Company Details
- 10.10.2 Central Depository Company Business Overview
- 10.10.3 Central Depository Company Share Registry Services Introduction
- 10.10.4 Central Depository Company Revenue in Share Registry Services Business (2018-2023)
11 Analyst's Viewpoints/Conclusions
12 Appendix
- 12.1 Research Methodology
- 12.1.1 Methodology/Research Approach
- 12.1.2 Data Source
- 12.2 Author Details
- 12.3 Disclaimer
