|
|
市場調査レポート
商品コード
1308551
エアフィルターの世界市場:2023年Global Air Filter Market Research Report 2023 |
||||||
|
|
|||||||
カスタマイズ可能
適宜更新あり
|
|||||||


| エアフィルターの世界市場:2023年 |
|
出版日: 2023年07月18日
発行: QYResearch
ページ情報: 英文 160 Pages
納期: 2~3営業日
|

- 全表示
- 概要
- 図表
- 目次
世界のエアフィルターの市場規模は、2022年の123億1,500万米ドルから、予測期間中は6.58%のCAGRで推移し、2029年には190億9,400万米ドルの規模に成長すると予測されています。
当レポートでは、世界のエアフィルターの市場を調査し、市場および製品の概要、競合情勢、市場規模の推移・予測、各種区分・地域/主要国別の詳細分析、価格動向、市場成長への各種影響因子の分析、主要企業の分析などをまとめています。
目次
第1章 エアフィルター:市場概要
- 製品の定義
- エアフィルター:タイプ別
- 成長率分析:2022 vs 2029
- HEPAフィルター
- 活性炭フィルター
- 静電フィルター
- UVエアフィルター
- その他
- エアフィルター:用途別
- 成長率分析:2022 vs 2029
- 住宅用
- 商業用
- 産業用
- 世界市場の成長見通し
- 製造額の推移・予測
- 製造数の推移・予測
- 平均価格の推移・予測
- 前提・制約
第2章 市場の競合情勢:製造業者別
- 製造数のシェア:製造業者別
- 製造額のシェア:製造業者別
- 主要企業・業界ランキング
- 市場シェア:企業タイプ別 (ティア1・2・3)
- 平均価格:製造業者別
- 世界の主要製造業者の製造拠点および販売エリア
- 主要製造業者の設立日
- 競合情勢・動向
- M&A・拡大
第3章 エアフィルターの製造動向:地域別
- 製造額の推計・予測:2018 vs 2022 vs 2029
- 製造額・市場シェア
- 製造数の推計・予測:2018 vs 2022 vs 2029
- 製造数・市場シェア
- 市場価格分析
- 製造数・製造額・前年比成長率
- 北米
- 欧州
- 中国
- 日本
第4章 エアフィルター動向:地域別
- 消費数の推計・予測:2018 vs 2022 vs 2029
- 消費数の推移・予測
- 北米
- 欧州
- アジア太平洋
- ラテンアメリカ・中東・アフリカ
第5章 タイプ別セグメント
- 製造数の推移・予測・市場シェア
- 製造額の推移・予測・市場シェア
- 価格の推移・予測
第6章 用途別セグメント
- 製造数の推移・予測・市場シェア
- 製造額の推移・予測・市場シェア
- 価格の推移・予測
第7章 主要企業の概要
- Camfil
- Mann-Hummel
- DENSO
- Daikin
- Mahle
- Atmus Filtration Technologies Inc.
- Freudenberg Filtration Technologies
- BOSCH
- UFI Filters
- Donaldson
- First Brands Group
- Sogefi
- Parker
- Toray
- Zhejiang Universe Filter
- YBM
- ACDelco
- Bengbu Phoenix
- TORA Group
- Okyia Auto
- Guangzhou Yifeng
- OST Filter
- DongGuan Shenglian
第8章 産業チェーン・販売チャネルの分析
- 産業チェーン分析
- 主な原材料
- 製造モードとプロセス
- 販売およびマーケティング
- 顧客
第9章 エアフィルター:市場力学
- 産業動向
- 市場促進要因
- 市場課題
- ポーターのファイブフォース分析
第10章 調査結果・総論
第11章 調査手法・データソース
List of Tables
- Table 1. Global Air Filter Market Value by Type, (US$ Million) & (2022 VS 2029)
- Table 2. Global Air Filter Market Value by Application, (US$ Million) & (2022 VS 2029)
- Table 3. Global Air Filter Production by Manufacturers (2018-2023) & (Million Units)
- Table 4. Global Air Filter Production Market Share by Manufacturers (2018-2023)
- Table 5. Global Air Filter Production Value by Manufacturers (2018-2023) & (US$ Million)
- Table 6. Global Air Filter Production Value Share by Manufacturers (2018-2023)
- Table 7. Global Key Players of Air Filter, Industry Ranking, 2021 VS 2022
- Table 8. Global Company Type (Tier 1, Tier 2, and Tier 3) & (based on the Production Value in Air Filter as of 2022)
- Table 9. Global Market Air Filter Average Price by Manufacturers (US$/Unit) & (2018-2023)
- Table 10. Global Key Manufacturers of Air Filter, Manufacturing Sites & Sales Area
- Table 11. Established Date of Key Air Filter Manufacturers
- Table 12. Global Air Filter Manufacturers Market Concentration Ratio (CR5)
- Table 13. Global Air Filter Production Value Growth Rate by Region: 2018 VS 2022 VS 2029 (US$ Million)
- Table 14. Global Air Filter Production Value (US$ Million) by Region (2018-2023)
- Table 15. Global Air Filter Production Value Market Share by Region (2018-2023)
- Table 16. Global Air Filter Production Value (US$ Million) Forecast by Region (2024-2029)
- Table 17. Global Air Filter Production Value Market Share Forecast by Region (2024-2029)
- Table 18. Global Air Filter Production Comparison by Region: 2018 VS 2022 VS 2029 (Million Units)
- Table 19. Global Air Filter Production (Million Units) by Region (2018-2023)
- Table 20. Global Air Filter Production Market Share by Region (2018-2023)
- Table 21. Global Air Filter Production (Million Units) Forecast by Region (2024-2029)
- Table 22. Global Air Filter Production Market Share Forecast by Region (2024-2029)
- Table 23. Global Air Filter Market Average Price (US$/Unit) by Region (2018-2023)
- Table 24. Global Air Filter Market Average Price (US$/Unit) by Region (2024-202*)
- Table 25. Global Air Filter Consumption Growth Rate by Region: 2018 VS 2022 VS 2029 (Million Units)
- Table 26. Global Air Filter Consumption by Region (2018-2023) & (Million Units)
- Table 27. Global Air Filter Consumption Market Share by Region (2018-2023)
- Table 28. Global Air Filter Forecasted Consumption by Region (2024-2029) & (Million Units)
- Table 29. Global Air Filter Forecasted Consumption Market Share by Region (2018-2023)
- Table 30. North America Air Filter Consumption Growth Rate by Country: 2018 VS 2022 VS 2029 (Million Units)
- Table 31. North America Air Filter Consumption by Country (2018-2023) & (Million Units)
- Table 32. North America Air Filter Consumption by Country (2024-2029) & (Million Units)
- Table 33. Europe Air Filter Consumption Growth Rate by Country: 2018 VS 2022 VS 2029 (Million Units)
- Table 34. Europe Air Filter Consumption by Country (2018-2023) & (Million Units)
- Table 35. Europe Air Filter Consumption by Country (2024-2029) & (Million Units)
- Table 36. Asia Pacific Air Filter Consumption Growth Rate by Country: 2018 VS 2022 VS 2029 (Million Units)
- Table 37. Asia Pacific Air Filter Consumption by Region (2018-2023) & (Million Units)
- Table 38. Asia Pacific Air Filter Consumption by Region (2024-2029) & (Million Units)
- Table 39. Latin America, Middle East & Africa Air Filter Consumption Growth Rate by Country: 2018 VS 2022 VS 2029 (Million Units)
- Table 40. Latin America, Middle East & Africa Air Filter Consumption by Country (2018-2023) & (Million Units)
- Table 41. Latin America, Middle East & Africa Air Filter Consumption by Country (2024-2029) & (Million Units)
- Table 42. Global Air Filter Production (Million Units) by Type (2018-2023)
- Table 43. Global Air Filter Production (Million Units) by Type (2024-2029)
- Table 44. Global Air Filter Production Market Share by Type (2018-2023)
- Table 45. Global Air Filter Production Market Share by Type (2024-2029)
- Table 46. Global Air Filter Production Value (US$ Million) by Type (2018-2023)
- Table 47. Global Air Filter Production Value (US$ Million) by Type (2024-2029)
- Table 48. Global Air Filter Production Value Market Share by Type (2018-2023)
- Table 49. Global Air Filter Production Value Market Share by Type (2024-2029)
- Table 50. Global Air Filter Price (US$/Unit) by Type (2018-2023)
- Table 51. Global Air Filter Price (US$/Unit) by Type (2024-2029)
- Table 52. Global Air Filter Production (Million Units) by Application (2018-2023)
- Table 53. Global Air Filter Production (Million Units) by Application (2024-2029)
- Table 54. Global Air Filter Production Market Share by Application (2018-2023)
- Table 55. Global Air Filter Production Market Share by Application (2024-2029)
- Table 56. Global Air Filter Production Value (US$ Million) by Application (2018-2023)
- Table 57. Global Air Filter Production Value (US$ Million) by Application (2024-2029)
- Table 58. Global Air Filter Production Value Market Share by Application (2018-2023)
- Table 59. Global Air Filter Production Value Market Share by Application (2024-2029)
- Table 60. Global Air Filter Price (US$/Unit) by Application (2018-2023)
- Table 61. Global Air Filter Price (US$/Unit) by Application (2024-2029)
- Table 62. Camfil Basic Information, Manufacturing Base, Sales Area and Its Competitors
- Table 63. Camfil Air Filter Production (Million Units), Revenue (US$ Million), Price (US$/Unit) and Gross Margin (%) (2018-2023)
- Table 64. Mann-Hummel Basic Information, Manufacturing Base, Sales Area and Its Competitors
- Table 65. Mann-Hummel Air Filter Production (Million Units), Revenue (US$ Million), Price (US$/Unit) and Gross Margin (%) (2018-2023)
- Table 66. DENSO Basic Information, Manufacturing Base, Sales Area and Its Competitors
- Table 67. DENSO Air Filter Production (Million Units), Revenue (US$ Million), Price (US$/Unit) and Gross Margin (%) (2018-2023)
- Table 68. Daikin Basic Information, Manufacturing Base, Sales Area and Its Competitors
- Table 69. Daikin Air Filter Production (Million Units), Revenue (US$ Million), Price (US$/Unit) and Gross Margin (%) (2018-2023)
- Table 70. Mahle Basic Information, Manufacturing Base, Sales Area and Its Competitors
- Table 71. Mahle Air Filter Production (Million Units), Revenue (US$ Million), Price (US$/Unit) and Gross Margin (%) (2018-2023)
- Table 72. Atmus Filtration Technologies Inc. Basic Information, Manufacturing Base, Sales Area and Its Competitors
- Table 73. Atmus Filtration Technologies Inc. Air Filter Production (Million Units), Revenue (US$ Million), Price (US$/Unit) and Gross Margin (%) (2018-2023)
- Table 74. Freudenberg Filtration Technologies Basic Information, Manufacturing Base, Sales Area and Its Competitors
- Table 75. Freudenberg Filtration Technologies Air Filter Production (Million Units), Revenue (US$ Million), Price (US$/Unit) and Gross Margin (%) (2018-2023)
- Table 76. BOSCH Basic Information, Manufacturing Base, Sales Area and Its Competitors
- Table 77. BOSCH Air Filter Production (Million Units), Revenue (US$ Million), Price (US$/Unit) and Gross Margin (%) (2018-2023)
- Table 78. UFI Filters Basic Information, Manufacturing Base, Sales Area and Its Competitors
- Table 79. UFI Filters Air Filter Production (Million Units), Revenue (US$ Million), Price (US$/Unit) and Gross Margin (%) (2018-2023)
- Table 80. Donaldson Basic Information, Manufacturing Base, Sales Area and Its Competitors
- Table 81. Donaldson Air Filter Production (Million Units), Revenue (US$ Million), Price (US$/Unit) and Gross Margin (%) (2018-2023)
- Table 82. First Brands Group Basic Information, Manufacturing Base, Sales Area and Its Competitors
- Table 83. First Brands Group Air Filter Production (Million Units), Revenue (US$ Million), Price (US$/Unit) and Gross Margin (%) (2018-2023)
- Table 84. Sogefi Basic Information, Manufacturing Base, Sales Area and Its Competitors
- Table 85. Sogefi Air Filter Production (Million Units), Revenue (US$ Million), Price (US$/Unit) and Gross Margin (%) (2018-2023)
- Table 86. Parker Basic Information, Manufacturing Base, Sales Area and Its Competitors
- Table 87. Parker Air Filter Production (Million Units), Revenue (US$ Million), Price (US$/Unit) and Gross Margin (%) (2018-2023)
- Table 88. Toray Basic Information, Manufacturing Base, Sales Area and Its Competitors
- Table 89. Toray Air Filter Production (Million Units), Revenue (US$ Million), Price (US$/Unit) and Gross Margin (%) (2018-2023)
- Table 90. Zhejiang Universe Filter Basic Information, Manufacturing Base, Sales Area and Its Competitors
- Table 91. Zhejiang Universe Filter Air Filter Production (Million Units), Revenue (US$ Million), Price (US$/Unit) and Gross Margin (%) (2018-2023)
- Table 92. YBM Basic Information, Manufacturing Base, Sales Area and Its Competitors
- Table 93. YBM Air Filter Production (Million Units), Revenue (US$ Million), Price (US$/Unit) and Gross Margin (%) (2018-2023)
- Table 94. ACDelco Basic Information, Manufacturing Base, Sales Area and Its Competitors
- Table 95. ACDelco Air Filter Production (Million Units), Revenue (US$ Million), Price (US$/Unit) and Gross Margin (%) (2018-2023)
- Table 96. Bengbu Phoenix Basic Information, Manufacturing Base, Sales Area and Its Competitors
- Table 97. Bengbu Phoenix Air Filter Production (Million Units), Revenue (US$ Million), Price (US$/Unit) and Gross Margin (%) (2018-2023)
- Table 98. TORA Group Basic Information, Manufacturing Base, Sales Area and Its Competitors
- Table 99. TORA Group Air Filter Production (Million Units), Revenue (US$ Million), Price (US$/Unit) and Gross Margin (%) (2018-2023)
- Table 100. Okyia Auto Basic Information, Manufacturing Base, Sales Area and Its Competitors
- Table 101. Okyia Auto Air Filter Production (Million Units), Revenue (US$ Million), Price (US$/Unit) and Gross Margin (%) (2018-2023)
- Table 102. Guangzhou Yifeng Basic Information, Manufacturing Base, Sales Area and Its Competitors
- Table 103. Guangzhou Yifeng Air Filter Production (Million Units), Revenue (US$ Million), Price (US$/Unit) and Gross Margin (%) (2018-2023)
- Table 104. OST Filter Basic Information, Manufacturing Base, Sales Area and Its Competitors
- Table 105. OST Filter Air Filter Production (Million Units), Revenue (US$ Million), Price (US$/Unit) and Gross Margin (%) (2018-2023)
- Table 106. DongGuan Shenglian Basic Information, Manufacturing Base, Sales Area and Its Competitors
- Table 107. DongGuan Shenglian Air Filter Production (Million Units), Revenue (US$ Million), Price (US$/Unit) and Gross Margin (%) (2018-2023)
- Table 108. Raw Materials Key Suppliers Lists
- Table 109. Air Filter Distributors Examples List
- Table 110. Air Filter Customers Examples List
- Table 111. Air Filter Market Trends
- Table 112. Air Filter Market Drivers
- Table 113. Air Filter Market Challenges
- Table 114. Research Programs/Design for This Report
- Table 115. Key Data Information from Secondary Sources
- Table 116. Key Data Information from Primary Sources
- Table 117. Authors List of This Report
- Table 118. QYR Business Unit and Senior & Team Lead Analysts
List of Figures
- Figure 1. Product Picture of Air Filter
- Figure 2. Global Air Filter Market Value by Type, (US$ Million) & (0218 VS 2022 VS 2029)
- Figure 3. Global Air Filter Market Share by Type: 2022 VS 2029
- Figure 4. HEPA Filters Product Picture
- Figure 5. Activated Carbon Filters Product Picture
- Figure 6. Electrostatic Filters Product Picture
- Figure 7. UV Air Filters Product Picture
- Figure 8. Others Product Picture
- Figure 9. Global Air Filter Market Value by Application, (US$ Million) & (2018 VS 2022 VS 2029)
- Figure 10. Global Air Filter Market Share by Application: 2022 VS 2029
- Figure 11. Residential
- Figure 12. Commercial
- Figure 13. Industrial
- Figure 14. Global Air Filter Production Value (US$ Million), 2018 VS 2022 VS 2029
- Figure 15. Global Air Filter Production Value (US$ Million) & (2018-2029)
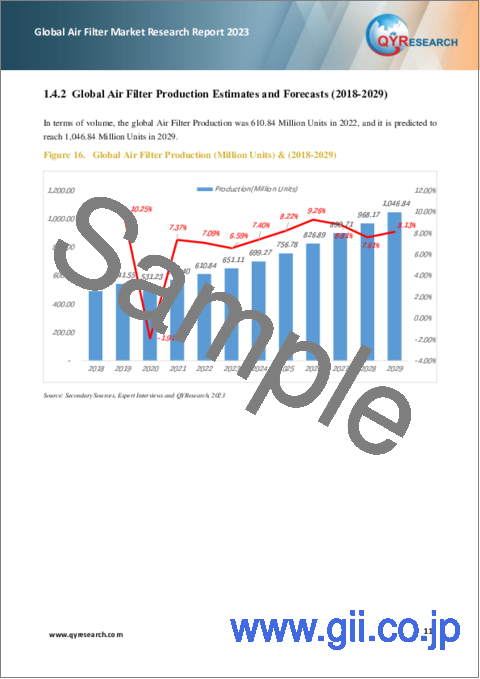
- Figure 16. Global Air Filter Production (Million Units) & (2018-2029)
- Figure 17. Global Air Filter Average Price (US$/Unit) & (2018-2029)
- Figure 18. Air Filter Report Years Considered
- Figure 19. Air Filter Production Share by Manufacturers in 2022
- Figure 20. Air Filter Market Share by Company Type (Tier 1, Tier 2, and Tier 3): 2022
- Figure 21. The Global 5 and 10 Largest Players: Market Share by Air Filter Revenue in 2022
- Figure 22. Global Air Filter Production Value Comparison by Region: 2018 VS 2022 VS 2029 (US$ Million)
- Figure 23. Global Air Filter Production Value Market Share by Region: 2018 VS 2022 VS 2029
- Figure 24. Global Air Filter Production Comparison by Region: 2018 VS 2022 VS 2029 (Million Units)
- Figure 25. Global Air Filter Production Market Share by Region: 2018 VS 2022 VS 2029
- Figure 26. North America Air Filter Production Value (US$ Million) Growth Rate (2018-2029)
- Figure 27. Europe Air Filter Production Value (US$ Million) Growth Rate (2018-2029)
- Figure 28. China Air Filter Production Value (US$ Million) Growth Rate (2018-2029)
- Figure 29. Japan Air Filter Production Value (US$ Million) Growth Rate (2018-2029)
- Figure 30. Global Air Filter Consumption by Region: 2018 VS 2022 VS 2029 (Million Units)
- Figure 31. Global Air Filter Consumption Market Share by Region: 2018 VS 2022 VS 2029
- Figure 32. North America Air Filter Consumption and Growth Rate (2018-2029) & (Million Units)
- Figure 33. North America Air Filter Consumption Market Share by Country (2018-2029)
- Figure 34. U.S. Air Filter Consumption and Growth Rate (2018-2029) & (Million Units)
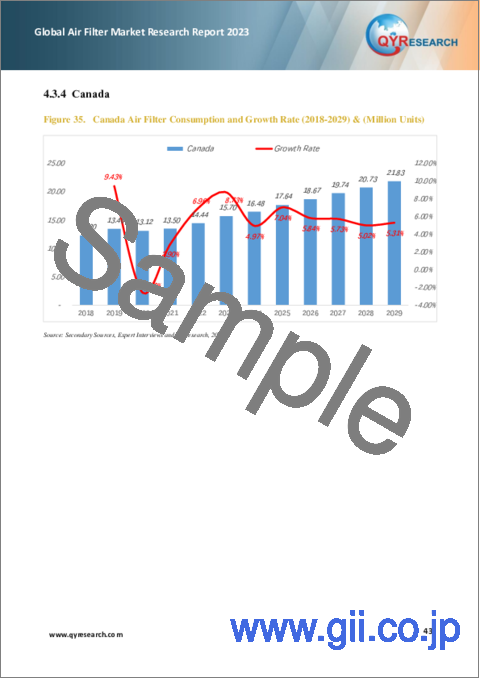
- Figure 35. Canada Air Filter Consumption and Growth Rate (2018-2029) & (Million Units)
- Figure 36. Europe Air Filter Consumption and Growth Rate (2018-2029) & (Million Units)
- Figure 37. Europe Air Filter Consumption Market Share by Country (2018-2029)
- Figure 38. Germany Air Filter Consumption and Growth Rate (2018-2029) & (Million Units)
- Figure 39. France Air Filter Consumption and Growth Rate (2018-2029) & (Million Units)
- Figure 40. U.K. Air Filter Consumption and Growth Rate (2018-2029) & (Million Units)
- Figure 41. Italy Air Filter Consumption and Growth Rate (2018-2029) & (Million Units)
- Figure 42. Russia Air Filter Consumption and Growth Rate (2018-2029) & (Million Units)
- Figure 43. Asia Pacific Air Filter Consumption and Growth Rate (2018-2029) & (Million Units)
- Figure 44. Asia Pacific Air Filter Consumption Market Share by Region (2024-2029)
- Figure 45. China Air Filter Consumption and Growth Rate (2018-2029) & (Million Units)
- Figure 46. Japan Air Filter Consumption and Growth Rate (2018-2029) & (Million Units)
- Figure 47. South Korea Air Filter Consumption and Growth Rate (2018-2029) & (Million Units)
- Figure 48. China Taiwan Air Filter Consumption and Growth Rate (2018-2029) & (Million Units)
- Figure 49. Southeast Asia Air Filter Consumption and Growth Rate (2018-2029) & (Million Units)
- Figure 50. India Air Filter Consumption and Growth Rate (2018-2029) & (Million Units)
- Figure 51. Latin America, Middle East & Africa Air Filter Consumption and Growth Rate (2018-2029) & (Million Units)
- Figure 52. Latin America, Middle East & Africa Air Filter Consumption Market Share by Country (2018-2029)
- Figure 53. Mexico Air Filter Consumption and Growth Rate (2018-2029) & (Million Units)
- Figure 54. Brazil Air Filter Consumption and Growth Rate (2018-2029) & (Million Units)
- Figure 55. Turkey Air Filter Consumption and Growth Rate (2018-2029) & (Million Units)
- Figure 56. GCC Countries Air Filter Consumption and Growth Rate (2018-2029) & (Million Units)
- Figure 57. Global Production Market Share of Air Filter by Type (2018-2029)
- Figure 58. Global Production Value Market Share of Air Filter by Type (2018-2029)
- Figure 59. Global Production Market Share of Air Filter by Application (2018-2029)
- Figure 60. Global Production Value Market Share of Air Filter by Application (2018-2029)
- Figure 61. Air Filter Product Picture Examples of Camfil
- Figure 62. Air Filter Product Picture Examples of Mann-Hummel
- Figure 63. Air Filter Product Picture Examples of DENSO
- Figure 64. Air Filter Product Picture Examples of Daikin
- Figure 65. Air Filter Product Picture Examples of Mahle
- Figure 66. Air Filter Product Picture Examples of Atmus Filtration Technologies Inc.
- Figure 67. Air Filter Product Picture Examples of Freudenberg Filtration Technologies
- Figure 68. Air Filter Product Picture Examples of BOSCH
- Figure 69. Air Filter Product Picture Examples of UFI Filters
- Figure 70. Air Filter Product Picture Examples of Donaldson
- Figure 71. Air Filter Product Picture Examples of First Brands Group
- Figure 72. Air Filter Product Picture Examples of Sogefi
- Figure 73. Air Filter Product Picture Examples of Parker
- Figure 74. Air Filter Product Picture Examples of Toray
- Figure 75. Air Filter Product Picture Examples of Zhejiang Universe Filter
- Figure 76. Air Filter Product Picture Examples of YBM
- Figure 77. Air Filter Product Picture Examples of ACDelco
- Figure 78. Air Filter Product Picture Examples of Bengbu Phoenix
- Figure 79. Air Filter Product Picture Examples of TORA Group
- Figure 80. Air Filter Product Picture Examples of Okyia Auto
- Figure 81. Air Filter Product Picture Examples of Guangzhou Yifeng
- Figure 82. Air Filter Product Picture Examples of OST Filter
- Figure 83. Air Filter Product Picture Examples of DongGuan Shenglian
- Figure 84. Air Filter Value Chain
- Figure 85. Air Filter Production Process
- Figure 86. Channels of Distribution
- Figure 87. Distributors Profiles
- Figure 88. Porter's Five Forces Analysis
- Figure 89. Bottom-up and Top-down Approaches for This Report
- Figure 90. Data Triangulation
The global Air Filter market was valued at US$ 12,315 million in 2022 and is anticipated to reach US$ 19,094 million by 2029, witnessing a CAGR of 6.58% during the forecast period 2023-2029.
The major global manufacturers of Air Filter include: Camfil, Mann-Hummel, DENSO, Daikin, Mahle, Atmus Filtration Technologies Inc., Freudenberg Filtration Technologies, BOSCH, UFI Filters, Donaldson, First Brands Group, Sogefi, Parker and Toray, etc. In 2022, the world's top three vendors accounted for approximately 23.18% of the revenue.
Report Scope
This report aims to provide a comprehensive presentation of the global market for Air Filter, with both quantitative and qualitative analysis, to help readers develop business/growth strategies, assess the market competitive situation, analyze their position in the current marketplace, and make informed business decisions regarding Air Filter.
The Air Filter market size, estimations, and forecasts are provided in terms of output/shipments (Million Units) and revenue ($ millions), considering 2022 as the base year, with history and forecast data for the period from 2018 to 2029. This report segments the global Air Filter market comprehensively. Regional market sizes, concerning products by Type, by Application, and by players, are also provided.
For a more in-depth understanding of the market, the report provides profiles of the competitive landscape, key competitors, and their respective market ranks. The report also discusses technological trends and new product developments.
The report will help the Air Filter manufacturers, new entrants, and industry chain related companies in this market with information on the revenues, production, and average price for the overall market and the sub-segments across the different segments, by company, by Type, by Application, and by regions.
By Company
- Camfil
- Mann-Hummel
- DENSO
- Daikin
- Mahle
- Atmus Filtration Technologies Inc.
- Freudenberg Filtration Technologies
- BOSCH
- UFI Filters
- Donaldson
- First Brands Group
- Sogefi
- Parker
- Toray
- Zhejiang universe filter
- YBM
- ACDelco
- Bengbu Phoenix
- TORA Group
- Okyia Auto
- Guangzhou Yifeng
- OST Filter
- DongGuan Shenglian
by Type
- HEPA Filters
- Activated Carbon Filters
- Electrostatic Filters
- UV Air Filters
- Others
by Application
- Residential
- Commercial
- Industrial
Production by Region
- North America
- Europe
- China
- Japan
Consumption by Region
- North America
- U.S.
- Canada
- Asia-Pacific
- China
- Japan
- South Korea
- China Taiwan
- India
- Southeast Asia
- Europe
- Germany
- France
- U.K.
- Italy
- Russia
- Rest of Europe
- Latin America, Middle East & Africa
- Mexico
- Brazil
- Turkey
- GCC Countries
Core Chapters
- Chapter 1: Introduces the report scope of the report, executive summary of different market segments (by region, by Type, by Application, etc), including the market size of each market segment, future development potential, and so on. It offers a high-level view of the current state of the market and its likely evolution in the short to mid-term, and long term.
- Chapter 2: Detailed analysis of Air Filter manufacturers competitive landscape, price, production and value market share, latest development plan, merger, and acquisition information, etc.
- Chapter 3: Production/output, value of Air Filter by region/country. It provides a quantitative analysis of the market size and development potential of each region in the next six years.
- Chapter 4: Consumption of Air Filter in regional level and country level. It provides a quantitative analysis of the market size and development potential of each region and its main countries and introduces the market development, future development prospects, market space, and production of each country in the world.
- Chapter 5: Provides the analysis of various market segments by Type, covering the market size and development potential of each market segment, to help readers find the blue ocean market in different market segments.
- Chapter 6: Provides the analysis of various market segments by Application, covering the market size and development potential of each market segment, to help readers find the blue ocean market in different downstream markets.
- Chapter 7: Provides profiles of key players, introducing the basic situation of the main companies in the market in detail, including product production/output, value, price, gross margin, product introduction, recent development, etc.
- Chapter 8: Analysis of industrial chain, including the upstream and downstream of the industry.
- Chapter 9: Introduces the market dynamics, latest developments of the market, the driving factors and restrictive factors of the market, the challenges and risks faced by manufacturers in the industry, and the analysis of relevant policies in the industry.
- Chapter 10: The main points and conclusions of the report.
Table of Contents
1 Air Filter Market Overview
- 1.1 Product Definition
- 1.2 Air Filter by Type
- 1.2.1 Global Air Filter Market Value Growth Rate Analysis by Type: 2022 VS 2029
- 1.2.2 HEPA Filters
- 1.2.3 Activated Carbon Filters
- 1.2.4 Electrostatic Filters
- 1.2.5 UV Air Filters
- 1.2.6 Others
- 1.3 Air Filter by Application
- 1.3.1 Global Air Filter Market Value Growth Rate Analysis by Application: 2022 VS 2029
- 1.3.2 Residential
- 1.3.3 Commercial
- 1.3.4 Industrial
- 1.4 Global Market Growth Prospects
- 1.4.1 Global Air Filter Production Value Estimates and Forecasts (2018-2029)
- 1.4.2 Global Air Filter Production Estimates and Forecasts (2018-2029)
- 1.4.3 Global Air Filter Market Average Price Estimates and Forecasts (2018-2029)
- 1.5 Assumptions and Limitations
2 Market Competition by Manufacturers
- 2.1 Global Air Filter Production Market Share by Manufacturers (2018-2023)
- 2.2 Global Air Filter Production Value Market Share by Manufacturers (2018-2023)
- 2.3 Global Key Players of Air Filter, Industry Ranking, 2021 VS 2022
- 2.4 Global Air Filter Market Share by Company Type (Tier 1, Tier 2, and Tier 3)
- 2.5 Global Air Filter Average Price by Manufacturers (2018-2023)
- 2.6 Global Key Manufacturers of Air Filter, Manufacturing Sites & Sales Area
- 2.7 Established Date of Key Air Filter Manufacturers
- 2.8 Global Air Filter Market Competitive Situation and Trends
- 2.8.1 Global Air Filter Market Concentration Rate
- 2.8.2 Global 5 and 10 Largest Air Filter Players Market Share by Revenue
- 2.9 Mergers & Acquisitions, Expansion
3 Air Filter Production by Region
- 3.1 Global Air Filter Production Value Estimates and Forecasts by Region: 2018 VS 2022 VS 2029
- 3.2 Global Air Filter Production Value by Region (2018-2029)
- 3.2.1 Global Air Filter Production Value Market Share by Region (2018-2023)
- 3.2.2 Global Forecasted Production Value of Air Filter by Region (2024-2029)
- 3.3 Global Air Filter Production Estimates and Forecasts by Region: 2018 VS 2022 VS 2029
- 3.4 Global Air Filter Production by Region (2018-2029)
- 3.4.1 Global Air Filter Production Market Share by Region (2018-2023)
- 3.4.2 Global Forecasted Production of Air Filter by Region (2024-2029)
- 3.5 Global Air Filter Market Price Analysis by Region (2018-2023)
- 3.6 Global Air Filter Production and Value, Year-over-Year Growth
- 3.6.1 North America Air Filter Production Value Estimates and Forecasts (2018-2029)
- 3.6.2 Europe Air Filter Production Value Estimates and Forecasts (2018-2029)
- 3.6.3 China Air Filter Production Value Estimates and Forecasts (2018-2029)
- 3.6.4 Japan Air Filter Production Value Estimates and Forecasts (2018-2029)
4 Air Filter Consumption by Region
- 4.1 Global Air Filter Consumption Estimates and Forecasts by Region: 2018 VS 2022 VS 2029
- 4.2 Global Air Filter Consumption by Region (2018-2029)
- 4.2.1 Global Air Filter Consumption by Region (2018-2029)
- 4.2.2 Global Air Filter Forecasted Consumption by Region (2024-2029)
- 4.3 North America
- 4.3.1 North America Air Filter Consumption Growth Rate by Country: 2018 VS 2022 VS 2029
- 4.3.2 North America Air Filter Consumption by Country (2018-2029)
- 4.3.3 U.S.
- 4.3.4 Canada
- 4.4 Europe
- 4.4.1 Europe Air Filter Consumption Growth Rate by Country: 2018 VS 2022 VS 2029
- 4.4.2 Europe Air Filter Consumption by Country (2018-2029)
- 4.4.3 Germany
- 4.4.4 France
- 4.4.5 U.K.
- 4.4.6 Italy
- 4.4.7 Russia
- 4.5 Asia Pacific
- 4.5.1 Europe Air Filter Consumption Growth Rate by Country: 2018 VS 2022 VS 2029
- 4.5.2 Asia Pacific Air Filter Consumption by Region (2018-2029)
- 4.5.3 China
- 4.5.4 Japan
- 4.5.5 South Korea
- 4.5.6 China Taiwan
- 4.5.7 Southeast Asia
- 4.5.8 India
- 4.6 Latin America, Middle East & Africa
- 4.6.1 Latin America, Middle East & Africa Air Filter Consumption Growth Rate by Country: 2018 VS 2022 VS 2029
- 4.6.2 Latin America, Middle East & Africa Air Filter Consumption by Country (2018-2029)
- 4.6.3 Mexico
- 4.6.4 Brazil
- 4.6.5 Turkey
- 4.6.6 GCC Countries
5 Segment by Type
- 5.1 Global Air Filter Production by Type (2018-2029)
- 5.1.1 Global Air Filter Production by Type (2018-2023)
- 5.1.2 Global Air Filter Production by Type (2024-2029)
- 5.1.3 Global Air Filter Production Market Share by Type (2018-2029)
- 5.2 Global Air Filter Production Value by Type (2018-2029)
- 5.2.1 Global Air Filter Production Value by Type (2018-2023)
- 5.2.2 Global Air Filter Production Value by Type (2024-2029)
- 5.2.3 Global Air Filter Production Value Market Share by Type (2018-2029)
- 5.3 Global Air Filter Price by Type (2018-2029)
6 Segment by Application
- 6.1 Global Air Filter Production by Application (2018-2029)
- 6.1.1 Global Air Filter Production by Application (2018-2023)
- 6.1.2 Global Air Filter Production by Application (2024-2029)
- 6.1.3 Global Air Filter Production Market Share by Application (2018-2029)
- 6.2 Global Air Filter Production Value by Application (2018-2029)
- 6.2.1 Global Air Filter Production Value by Application (2018-2023)
- 6.2.2 Global Air Filter Production Value by Application (2024-2029)
- 6.2.3 Global Air Filter Production Value Market Share by Application (2018-2029)
- 6.3 Global Air Filter Price by Application (2018-2029)
7 Key Companies Profiled
- 7.1 Camfil
- 7.1.1 Company Basic Information, Manufacturing Base, Sales Area and Its Competitors
- 7.1.2 Air Filter Product Overview
- 7.1.3 Camfil Air Filter Production (Million Units), Revenue (US$ Million), Price (US$/Unit) and Gross Margin (%) (2018-2023)
- 7.1.4 Main Business/Business Overview
- 7.2 Mann-Hummel
- 7.2.1 Company Basic Information, Manufacturing Base, Sales Area and Its Competitors
- 7.2.2 Air Filter Product Overview
- 7.2.3 Mann-Hummel Air Filter Production (Million Units), Revenue (US$ Million), Price (US$/Unit) and Gross Margin (%) (2018-2023)
- 7.2.4 Main Business/Business Overview
- 7.3 DENSO
- 7.3.1 Company Basic Information, Manufacturing Base, Sales Area and Its Competitors
- 7.3.2 Air Filter Product Overview
- 7.3.3 DENSO Air Filter Production (Million Units), Revenue (US$ Million), Price (US$/Unit) and Gross Margin (%) (2018-2023)
- 7.3.4 Main Business/Business Overview
- 7.4 Daikin
- 7.4.1 Company Basic Information, Manufacturing Base, Sales Area and Its Competitors
- 7.4.2 Air Filter Product Overview
- 7.4.3 Daikin Air Filter Production (Million Units), Revenue (US$ Million), Price (US$/Unit) and Gross Margin (%) (2018-2023)
- 7.4.4 Main Business/Business Overview
- 7.5 Mahle
- 7.5.1 Company Basic Information, Manufacturing Base, Sales Area and Its Competitors
- 7.5.2 Air Filter Product Overview
- 7.5.3 Mahle Air Filter Production (Million Units), Revenue (US$ Million), Price (US$/Unit) and Gross Margin (%) (2018-2023)
- 7.5.4 Main Business/Business Overview
- 7.6 Atmus Filtration Technologies Inc.
- 7.6.1 Company Basic Information, Manufacturing Base, Sales Area and Its Competitors
- 7.6.2 Air Filter Product Overview
- 7.6.3 Atmus Filtration Technologies Inc. Air Filter Production (Million Units), Revenue (US$ Million), Price (US$/Unit) and Gross Margin (%) (2018-2023)
- 7.6.4 Main Business/Business Overview
- 7.7 Freudenberg Filtration Technologies
- 7.7.1 Company Basic Information, Manufacturing Base, Sales Area and Its Competitors
- 7.7.2 Air Filter Product Overview
- 7.7.3 Freudenberg Filtration Technologies Air Filter Production (Million Units), Revenue (US$ Million), Price (US$/Unit) and Gross Margin (%) (2018-2023)
- 7.7.4 Main Business/Business Overview
- 7.8 BOSCH
- 7.8.1 Company Basic Information, Manufacturing Base, Sales Area and Its Competitors
- 7.8.2 Air Filter Product Overview
- 7.8.3 BOSCH Air Filter Production (Million Units), Revenue (US$ Million), Price (US$/Unit) and Gross Margin (%) (2018-2023)
- 7.8.4 Main Business/Business Overview
- 7.9 UFI Filters
- 7.9.1 Company Basic Information, Manufacturing Base, Sales Area and Its Competitors
- 7.9.2 Air Filter Product Overview
- 7.9.3 UFI Filters Air Filter Production (Million Units), Revenue (US$ Million), Price (US$/Unit) and Gross Margin (%) (2018-2023)
- 7.9.4 Main Business/Business Overview
- 7.10 Donaldson
- 7.10.1 Company Basic Information, Manufacturing Base, Sales Area and Its Competitors
- 7.10.2 Air Filter Product Overview
- 7.10.3 Donaldson Air Filter Production (Million Units), Revenue (US$ Million), Price (US$/Unit) and Gross Margin (%) (2018-2023)
- 7.10.4 Main Business/Business Overview
- 7.11 First Brands Group
- 7.11.1 Company Basic Information, Manufacturing Base, Sales Area and Its Competitors
- 7.11.2 Air Filter Product Overview
- 7.11.3 First Brands Group Air Filter Production (Million Units), Revenue (US$ Million), Price (US$/Unit) and Gross Margin (%) (2018-2023)
- 7.11.4 Main Business/Business Overview
- 7.12 Sogefi
- 7.12.1 Company Basic Information, Manufacturing Base, Sales Area and Its Competitors
- 7.12.2 Air Filter Product Overview
- 7.12.3 Sogefi Air Filter Production (Million Units), Revenue (US$ Million), Price (US$/Unit) and Gross Margin (%) (2018-2023)
- 7.12.4 Main Business/Business Overview
- 7.13 Parker
- 7.13.1 Company Basic Information, Manufacturing Base, Sales Area and Its Competitors
- 7.13.2 Air Filter Product Overview
- 7.13.3 Parker Air Filter Production (Million Units), Revenue (US$ Million), Price (US$/Unit) and Gross Margin (%) (2018-2023)
- 7.13.4 Main Business/Business Overview
- 7.14 Toray
- 7.14.1 Company Basic Information, Manufacturing Base, Sales Area and Its Competitors
- 7.14.2 Air Filter Product Overview
- 7.14.3 Toray Air Filter Production (Million Units), Revenue (US$ Million), Price (US$/Unit) and Gross Margin (%) (2018-2023)
- 7.14.4 Main Business/Business Overview
- 7.15 Zhejiang Universe Filter
- 7.15.1 Company Basic Information, Manufacturing Base, Sales Area and Its Competitors
- 7.15.2 Air Filter Product Overview
- 7.15.3 Zhejiang Universe Filter Air Filter Production (Million Units), Revenue (US$ Million), Price (US$/Unit) and Gross Margin (%) (2018-2023)
- 7.15.4 Main Business/Business Overview
- 7.16 YBM
- 7.16.1 Company Basic Information, Manufacturing Base, Sales Area and Its Competitors
- 7.16.2 Air Filter Product Overview
- 7.16.3 YBM Air Filter Production (Million Units), Revenue (US$ Million), Price (US$/Unit) and Gross Margin (%) (2018-2023)
- 7.16.4 Main Business/Business Overview
- 7.17 ACDelco
- 7.17.1 Company Basic Information, Manufacturing Base, Sales Area and Its Competitors
- 7.17.2 Air Filter Product Overview
- 7.17.3 ACDelco Air Filter Production (Million Units), Revenue (US$ Million), Price (US$/Unit) and Gross Margin (%) (2018-2023)
- 7.17.4 Main Business/Business Overview
- 7.18 Bengbu Phoenix
- 7.18.1 Company Basic Information, Manufacturing Base, Sales Area and Its Competitors
- 7.18.2 Air Filter Product Overview
- 7.18.3 Bengbu Phoenix Air Filter Production (Million Units), Revenue (US$ Million), Price (US$/Unit) and Gross Margin (%) (2018-2023)
- 7.18.4 Main Business/Business Overview
- 7.19 TORA Group
- 7.19.1 Company Basic Information, Manufacturing Base, Sales Area and Its Competitors
- 7.19.2 Air Filter Product Overview
- 7.19.3 TORA Group Air Filter Production (Million Units), Revenue (US$ Million), Price (US$/Unit) and Gross Margin (%) (2018-2023)
- 7.19.4 Main Business/Business Overview
- 7.20 Okyia Auto
- 7.20.1 Company Basic Information, Manufacturing Base, Sales Area and Its Competitors
- 7.20.2 Air Filter Product Overview
- 7.20.3 Okyia Auto Air Filter Production (Million Units), Revenue (US$ Million), Price (US$/Unit) and Gross Margin (%) (2018-2023)
- 7.20.4 Main Business/Business Overview
- 7.21 Guangzhou Yifeng
- 7.21.1 Company Basic Information, Manufacturing Base, Sales Area and Its Competitors
- 7.21.2 Air Filter Product Overview
- 7.21.3 Guangzhou Yifeng Air Filter Production (Million Units), Revenue (US$ Million), Price (US$/Unit) and Gross Margin (%) (2018-2023)
- 7.21.4 Main Business/Business Overview
- 7.22 OST Filter
- 7.22.1 Company Basic Information, Manufacturing Base, Sales Area and Its Competitors
- 7.22.2 Air Filter Product Overview
- 7.22.3 OST Filter Air Filter Production (Million Units), Revenue (US$ Million), Price (US$/Unit) and Gross Margin (%) (2018-2023)
- 7.22.4 Main Business/Business Overview
- 7.23 DongGuan Shenglian
- 7.23.1 Company Basic Information, Manufacturing Base, Sales Area and Its Competitors
- 7.23.2 Air Filter Product Overview
- 7.23.3 DongGuan Shenglian Air Filter Production (Million Units), Revenue (US$ Million), Price (US$/Unit) and Gross Margin (%) (2018-2023)
- 7.23.4 Main Business/Business Overview
8 Industry Chain and Sales Channels Analysis
- 8.1 Air Filter Industry Chain Analysis
- 8.2 Air Filter Key Raw Materials
- 8.2.1 Key Raw Materials
- 8.2.2 Raw Materials Key Suppliers
- 8.3 Air Filter Production Mode & Process
- 8.4 Air Filter Sales and Marketing
- 8.4.1 Air Filter Sales Channels
- 8.4.2 Air Filter Distributors
- 8.5 Air Filter Customers
9 Air Filter Market Dynamics
- 9.1 Air Filter Industry Trends
- 9.2 Air Filter Market Drivers
- 9.3 Air Filter Market Challenges
- 9.4 Porter's Five Forces Analysis
10 Research Findings and Conclusion
11 Methodology and Data Source
- 11.1 Methodology/Research Approach
- 11.1.1 Research Programs/Design
- 11.1.2 Market Size Estimation
- 11.1.3 Market Breakdown and Data Triangulation
- 11.2 Data Source
- 11.2.1 Secondary Sources
- 11.2.2 Primary Sources
- 11.3 Author List
- 11.4 Disclaimer