|
|
市場調査レポート
商品コード
1304138
液状合成ゴムの世界市場(2023年)Global Liquid Synthetic Rubber Sales Market Report 2023 |
||||||
|
|
|||||||
カスタマイズ可能
適宜更新あり
|
|||||||


| 液状合成ゴムの世界市場(2023年) |
|
出版日: 2023年07月11日
発行: QYResearch
ページ情報: 英文 121 Pages
納期: 2~3営業日
|

- 全表示
- 概要
- 図表
- 目次
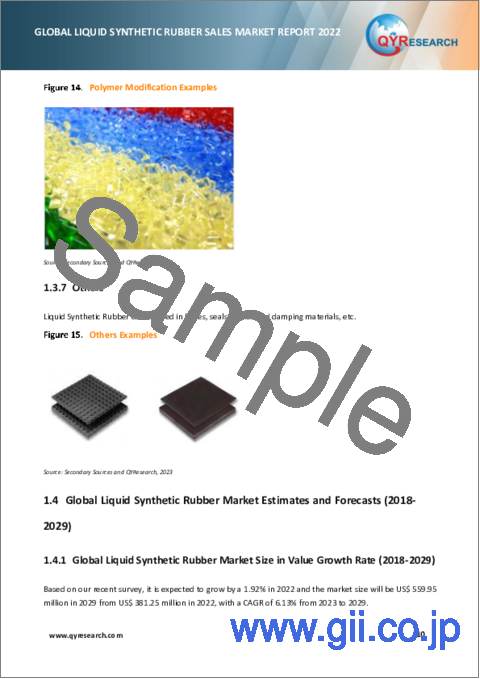
世界の液状合成ゴムの市場規模は、2022年の3億8,125万米ドルから2029年までに5億5,995万米ドルに達し、予測期間の2023年~2029年にCAGRで6.13%の成長が予測されています。
当レポートでは、世界の液状合成ゴム市場について調査分析し、市場規模と予測、地域とセグメントの分析、企業プロファイルなどを提供しています。
目次
第1章 液状合成ゴム市場の概要
- 液状合成ゴムの製品の範囲
- 液状合成ゴム:タイプ別
- 世界の液状合成ゴムの売上:タイプ別(2018年・2022年・2029年)
- 液体イソプレン
- 液体ブタジエン
- 液体スチレンブタジエン
- 液状合成ゴム:用途別
- 世界の液状合成ゴムの売上の比較:用途別(2018年・2022年・2029年)
- タイヤ
- 電子
- 工業用ゴム
- 接着剤、コーティング、シーラント
- ポリマー改質
- その他
- 世界の液状合成ゴム市場の推計と予測(2018年~2029年)
- 世界の液状合成ゴムの市場規模(金額成長率)(2018年~2029年)
- 世界の液状合成ゴムの市場規模(数量成長率)(2018年~2029年)
- 世界の液状合成ゴムの価格動向(2018年~2029年)
- 前提条件と制限
第2章 液状合成ゴムの推計と予測:地域別
- 世界の液状合成ゴムの市場規模:地域別(2018年・2022年・2029年)
- 世界の液状合成ゴムの過去の市場シナリオ:地域別(2018年~2023年)
- 世界の液状合成ゴムの売上の市場シェア:地域別(2018年~2023年)
- 世界の液状合成ゴムの収益の市場シェア:地域別(2018年~2023年)
- 世界の液状合成ゴム市場の推計と予測(2024年~2029年)
- 世界の液状合成ゴムの売上の推計と予測:地域別(2024年~2029年)
- 世界の液状合成ゴムの収益予測:地域別(2024年~2029年)
- 地域市場の分析:市場の事実と数字
- 米国の液状合成ゴムの推計と予測(2018年~2029年)
- 欧州の液状合成ゴムの推計と予測(2018年~2029年)
- 中国の液状合成ゴムの推計と予測(2018年~2029年)
- 日本の液状合成ゴムの推計と予測(2018年~2029年)
- 東南アジアの液状合成ゴムの推計と予測(2018年~2029年)
- インドの液状合成ゴムの推計と予測(2018年~2029年)
第3章 液状合成ゴム競合情勢:企業別
- 世界の液状合成ゴムの売上:企業別(2018年~2023年)
- 世界の液状合成ゴムの主要企業:収益別(2018年~2023年)
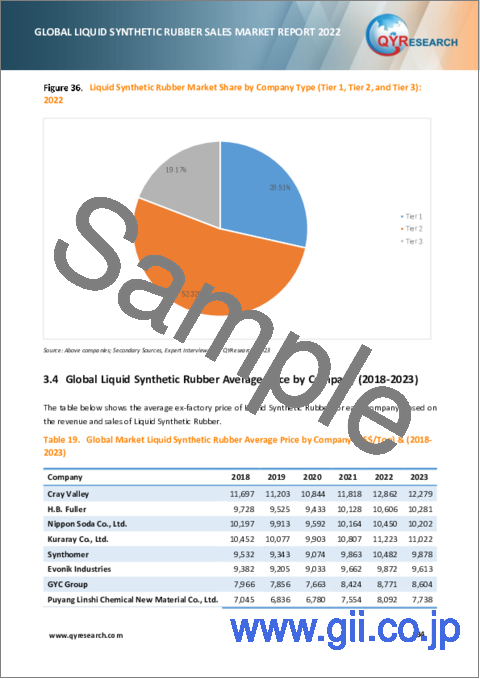
- 世界の液状合成ゴムの市場シェア:企業タイプ別(Tier 1、Tier 2、Tier 3)(2022年の液状合成ゴムの収益に基づく)
- 世界の液状合成ゴム平均価格:企業別(2018年~2023年)
- 世界の液状合成ゴムの主要メーカー、製造拠点、本社
- 世界の液状合成ゴムの主要メーカーの製品タイプ
- メーカーの合併・買収、拡張計画
第4章 液状合成ゴムの市場規模:タイプ別
- 世界の液状合成ゴム市場の実績レビュー:タイプ別(2018年~2023年)
- 世界の液状合成ゴムの売上:タイプ別(2018年~2023年)
- 世界の液状合成ゴムの収益:タイプ別(2018年~2023年)
- 世界の液状合成ゴムの価格:タイプ別(2018年~2023年)
- 世界の液状合成ゴム市場の推計と予測(2024年~2029年)
- 世界の液状合成ゴムの売上予測:タイプ別(2024年~2029年)
- 世界の液状合成ゴムの収益予測:タイプ別(2024年~2029年)
- 世界の液状合成ゴムの価格予測:タイプ別(2024年~2029年)
第5章 世界の液状合成ゴムの市場規模:用途別
- 世界の液状合成ゴム市場の実績レビュー:用途別(2018年~2023年)
- 世界の液状合成ゴムの売上:用途別(2018年~2023年)
- 世界の液状合成ゴムの収益:用途別(2018年~2023年)
- 世界の液状合成ゴムの価格:用途別(2018年~2023年)
- 世界の液状合成ゴム市場の推計と予測(2024年~2029年)
- 世界の液状合成ゴムの売上予測:用途別(2024年~2029年)
- 世界の液状合成ゴムの収益予測:用途別(2024年~2029年)
- 世界の液状合成ゴムの価格予測:用途別(2024年~2029年)
第6章 米国の液状合成ゴム市場の事実と数字
- 米国の液状合成ゴムの収益:企業別
- 米国の液状合成ゴムの売上の内訳:タイプ別
- 米国の液状合成ゴムの売上の内訳:用途別
第7章 欧州の液状合成ゴム市場の事実と数字
- 欧州の液状合成ゴムの収益:企業別
- 欧州の液状合成ゴムの売上の内訳:タイプ別
- 欧州の液状合成ゴムの売上の内訳:用途別
第8章 中国の液状合成ゴム市場の事実と数字
- 中国の液状合成ゴムの収益:企業別
- 中国の液状合成ゴムの売上の内訳:タイプ別
- 中国の液状合成ゴムの売上の内訳:用途別
第9章 日本の液状合成ゴム市場の事実と数字
- 日本の液状合成ゴムの収益:企業別
- 日本の液状合成ゴムの売上の内訳:タイプ別
- 日本の液状合成ゴムの売上の内訳:用途別
第10章 東南アジアの液状合成ゴム市場の事実と数字
- 東南アジアの液状合成ゴムの収益:企業別
- 東南アジアの液状合成ゴムの売上の内訳:タイプ別
- 東南アジアの液状合成ゴムの売上の内訳:用途別
第11章 インドの液状合成ゴム市場の事実と数字
- インドの液状合成ゴムの収益:企業別
- インドの液状合成ゴムの売上の内訳:タイプ別
- インドの液状合成ゴムの売上の内訳:用途別
第12章 企業プロファイルと主要指標
- Cray Valley
- HB Fuller
- Nippon Soda Co., Ltd.
- Kuraray Co., Ltd.
- Synthomer
- Evonik Industries
- GYC Group
- Puyang Linshi Chemical New Material Co., Ltd.
第13章 液状合成ゴムの製造コスト分析
- 液状合成ゴムの主な原材料の分析
- 主な原材料
- 原材料の主要サプライヤー
- 製造コスト構造比
- 液状合成ゴムの製造プロセス分析
- 液状合成ゴムの産業チェーン分析
第14章 マーケティングチャネル、販売業者、顧客
- マーケティングチャネル
- 液状合成ゴムの販売業者のリスト
- 液状合成ゴムの顧客
第15章 液状合成ゴムの市場力学
- 液状合成ゴム業界の動向
- 液状合成ゴム市場の促進要因
- 液状合成ゴム市場の課題、抑制要因
第16章 調査結果と結論
第17章 付録
List of Tables
- Table 1. Global Liquid Synthetic Rubber Sales (US$ Million) Growth Rate by Type (2018 & 2022 & 2029)
- Table 2. Major Manufacturers of Liquid Butadiene
- Table 3. Major Manufacturers of Liquid Styrene Butadiene
- Table 4. Global Liquid Synthetic Rubber Sales (US$ Million) Comparison by Application (2018 & 2022 & 2029)
- Table 5. Global Market Liquid Synthetic Rubber Market Size (US$ Million) by Region:2018 VS 2022 VS 2029
- Table 6. Global Liquid Synthetic Rubber Sales (Tons) by Region (2018-2023)
- Table 7. Global Liquid Synthetic Rubber Sales Market Share by Region (2018-2023)
- Table 8. Global Liquid Synthetic Rubber Revenue (US$ Million) Market Share by Region (2018-2023)
- Table 9. Global Liquid Synthetic Rubber Revenue Share by Region (2018-2023)
- Table 10. Global Liquid Synthetic Rubber Sales (Tons) Forecast by Region (2024-2029)
- Table 11. Global Liquid Synthetic Rubber Sales Market Share Forecast by Region (2024-2029)
- Table 12. Global Liquid Synthetic Rubber Revenue (US$ Million) Forecast by Region (2024-2029)
- Table 13. Global Liquid Synthetic Rubber Revenue Share Forecast by Region (2024-2029)
- Table 14. Global Liquid Synthetic Rubber Sales by Company (Tons) & (2018-2023)
- Table 15. Global Liquid Synthetic Rubber Sales Share by Company (2018-2023)
- Table 16. Global Liquid Synthetic Rubber Revenue by Company (US$ Million) & (2018-2023)
- Table 17. Global Liquid Synthetic Rubber Revenue Share by Company (2018-2023)
- Table 18. Global Liquid Synthetic Rubber by Company Type (Tier 1, Tier 2, and Tier 3) & (based on the Revenue in Liquid Synthetic Rubber as of 2022)
- Table 19. Global Market Liquid Synthetic Rubber Average Price by Company (US$/Ton) & (2018-2023)
- Table 20. Global Key Manufacturers of Liquid Synthetic Rubber, Manufacturing Sites & Headquarters
- Table 21. Global Key Manufacturers of Liquid Synthetic Rubber Product Type
- Table 22. Manufacturers Mergers & Acquisitions, Expansion Plans
- Table 23. Global Liquid Synthetic Rubber Sales by Type (Tons) & (2018-2023)
- Table 24. Global Liquid Synthetic Rubber Sales Share by Type (2018-2023)
- Table 25. Global Liquid Synthetic Rubber Revenue by Type (US$ Million) & (2018-2023)
- Table 26. Global Liquid Synthetic Rubber Price by Type (US$/Ton) & (2018-2023)
- Table 27. Global Liquid Synthetic Rubber Sales by Type (Tons) & (2024-2029)
- Table 28. Global Liquid Synthetic Rubber Revenue by Type (US$ Million) & (2024-2029)
- Table 29. Global Liquid Synthetic Rubber Price by Type (US$/Ton) & (2024-2029)
- Table 30. Global Liquid Synthetic Rubber Sales by Application (Tons) & (2018-2023)
- Table 31. Global Liquid Synthetic Rubber Sales Share by Application (2018-2023)
- Table 32. Global Liquid Synthetic Rubber Revenue by Application (US$ Million) & (2018-2023)
- Table 33. Global Liquid Synthetic Rubber Price by Application (US$/Ton) & (2018-2023)
- Table 34. Global Liquid Synthetic Rubber Sales by Application (Tons) & (2024-2029)
- Table 35. Global Liquid Synthetic Rubber Revenue Market Share by Application (US$ Million) & (2024-2029)
- Table 36. Global Liquid Synthetic Rubber Price by Application (US$/Ton) & (2024-2029)
- Table 37. United States Liquid Synthetic Rubber Revenue by Company (2018-2023) & (US$ Million)
- Table 38. United States Liquid Synthetic Rubber Revenue Market Share by Company (2018-2023)
- Table 39. United States Liquid Synthetic Rubber Sales by Type (2018-2023) & (Tons)
- Table 40. United States Liquid Synthetic Rubber Sales Market Share by Type (2018-2023)
- Table 41. United States Liquid Synthetic Rubber Sales by Type (2024-2029) & (Tons)
- Table 42. United States Liquid Synthetic Rubber Sales Market Share by Type (2024-2029)
- Table 43. United States Liquid Synthetic Rubber Sales by Application (2018-2023) & (Tons)
- Table 44. United States Liquid Synthetic Rubber Sales Market Share by Application (2018-2023)
- Table 45. United States Liquid Synthetic Rubber Sales by Application (2024-2029) & (Tons)
- Table 46. United States Liquid Synthetic Rubber Sales Market Share by Application (2024-2029)
- Table 47. Europe Liquid Synthetic Rubber Revenue by Company (2018-2023) & (US$ Million)
- Table 48. Europe Liquid Synthetic Rubber Revenue Market Share by Company (2018-2023)
- Table 49. Europe Liquid Synthetic Rubber Sales by Type (2018-2023) & (Tons)
- Table 50. Europe Liquid Synthetic Rubber Sales Market Share by Type (2018-2023)
- Table 51. Europe Liquid Synthetic Rubber Sales by Type (2024-2029) & (Tons)
- Table 52. Europe Liquid Synthetic Rubber Sales Market Share by Type (2024-2029)
- Table 53. Europe Liquid Synthetic Rubber Sales by Application (2018-2023) & (Tons)
- Table 54. Europe Liquid Synthetic Rubber Sales Market Share by Application (2018-2023)
- Table 55. Europe Liquid Synthetic Rubber Sales by Application (2024-2029) & (Tons)
- Table 56. Europe Liquid Synthetic Rubber Sales Market Share by Application (2024-2029)
- Table 57. China Liquid Synthetic Rubber Revenue by Company (2018-2023) & (US$ Million)
- Table 58. China Liquid Synthetic Rubber Revenue Market Share by Company (2018-2023)
- Table 59. China Liquid Synthetic Rubber Sales by Type (2018-2023) & (Tons)
- Table 60. China Liquid Synthetic Rubber Sales Market Share by Type (2018-2023)
- Table 61. China Liquid Synthetic Rubber Sales by Type (2024-2029) & (Tons)
- Table 62. China Liquid Synthetic Rubber Sales Market Share by Type (2024-2029)
- Table 63. China Liquid Synthetic Rubber Sales by Application (2018-2023) & (Tons)
- Table 64. China Liquid Synthetic Rubber Sales Market Share by Application (2018-2023)
- Table 65. China Liquid Synthetic Rubber Sales by Application (2024-2029) & (Tons)
- Table 66. China Liquid Synthetic Rubber Sales Market Share by Application (2024-2029)
- Table 67. Japan Liquid Synthetic Rubber Revenue by Company (2018-2023) & (US$ Million)
- Table 68. Japan Liquid Synthetic Rubber Revenue Market Share by Company (2018-2023)
- Table 69. Japan Liquid Synthetic Rubber Sales by Type (2018-2023) & (Tons)
- Table 70. Japan Liquid Synthetic Rubber Sales Market Share by Type (2018-2023)
- Table 71. Japan Liquid Synthetic Rubber Sales by Type (2024-2029) & (Tons)
- Table 72. Japan Liquid Synthetic Rubber Sales Market Share by Type (2024-2029)
- Table 73. Japan Liquid Synthetic Rubber Sales by Application (2018-2023) & (Tons)
- Table 74. Japan Liquid Synthetic Rubber Sales Market Share by Application (2018-2023)
- Table 75. Japan Liquid Synthetic Rubber Sales by Application (2024-2029) & (Tons)
- Table 76. Japan Liquid Synthetic Rubber Sales Market Share by Application (2024-2029)
- Table 77. Southeast Asia Liquid Synthetic Rubber Revenue by Company (2018-2023) & (US$ Million)
- Table 78. Southeast Asia Liquid Synthetic Rubber Revenue Market Share by Company (2018-2023)
- Table 79. Southeast Asia Liquid Synthetic Rubber Sales by Type (2018-2023) & (Tons)
- Table 80. Southeast Asia Liquid Synthetic Rubber Sales Market Share by Type (2018-2023)
- Table 81. Southeast Asia Liquid Synthetic Rubber Sales by Type (2024-2029) & (Tons)
- Table 82. Southeast Asia Liquid Synthetic Rubber Sales Market Share by Type (2024-2029)
- Table 83. Southeast Asia Liquid Synthetic Rubber Sales by Application (2018-2023) & (Tons)
- Table 84. Southeast Asia Liquid Synthetic Rubber Sales Market Share by Application (2018-2023)
- Table 85. Southeast Asia Liquid Synthetic Rubber Sales by Application (2024-2029) & (Tons)
- Table 86. Southeast Asia Liquid Synthetic Rubber Sales Market Share by Application (2024-2029)
- Table 87. India Liquid Synthetic Rubber Revenue by Company (2018-2023) & (US$ Million)
- Table 88. India Liquid Synthetic Rubber Revenue Market Share by Company (2018-2023)
- Table 89. India Liquid Synthetic Rubber Sales by Type (2018-2023) & (Tons)
- Table 90. India Liquid Synthetic Rubber Sales Market Share by Type (2018-2023)
- Table 91. India Liquid Synthetic Rubber Sales by Type (2024-2029) & (Tons)
- Table 92. India Liquid Synthetic Rubber Sales Market Share by Type (2024-2029)
- Table 93. India Liquid Synthetic Rubber Sales by Application (2018-2023) & (Tons)
- Table 94. India Liquid Synthetic Rubber Sales Market Share by Application (2018-2023)
- Table 95. India Liquid Synthetic Rubber Sales by Application (2024-2029) & (Tons)
- Table 96. India Liquid Synthetic Rubber Sales Market Share by Application (2024-2029)
- Table 97. Cray Valley Corporation Information
- Table 98. Cray Valley Description and Major Businesses
- Table 99. Cray Valley Liquid Synthetic Rubber Sales (Tons), Revenue (US$ Million), Price (US$/Ton) and Gross Margin (2018-2023E)
- Table 100. Cray Valley Liquid Synthetic Rubber Product Model Numbers, Pictures, Descriptions and Specifications
- Table 101. H.B. Fuller Corporation Information
- Table 102. H.B. Fuller Description and Major Businesses
- Table 103. H.B. Fuller Liquid Synthetic Rubber Sales (Tons), Revenue (US$ Million), Price (US$/Ton) and Gross Margin (2018-2023E)
- Table 104. H.B. Fuller Liquid Synthetic Rubber Product Model Numbers, Pictures, Descriptions and Specifications
- Table 105. Nippon Soda Co., Ltd. Corporation Information
- Table 106. Nippon Soda Co., Ltd. Description and Major Businesses
- Table 107. Nippon Soda Co., Ltd. Liquid Synthetic Rubber Sales (Tons), Revenue (US$ Million), Price (US$/Ton) and Gross Margin (2018-2023E)
- Table 108. Nippon Soda Co., Ltd. Liquid Synthetic Rubber Product Model Numbers, Pictures, Descriptions and Specifications
- Table 109. Kuraray Co., Ltd. Corporation Information
- Table 110. Kuraray Co., Ltd. Description and Major Businesses
- Table 111. Kuraray Co., Ltd. Liquid Synthetic Rubber Sales (Tons), Revenue (US$ Million), Price (US$/Ton) and Gross Margin (2018-2023E)
- Table 112. Kuraray Co., Ltd. Liquid Synthetic Rubber Product Model Numbers, Pictures, Descriptions and Specifications
- Table 113. Synthomer Corporation Information
- Table 114. Synthomer Description and Major Businesses
- Table 115. Synthomer Liquid Synthetic Rubber Sales (Tons), Revenue (US$ Million), Price (US$/Ton) and Gross Margin (2018-2023E)
- Table 116. Synthomer Liquid Synthetic Rubber Product Model Numbers, Pictures, Descriptions and Specifications
- Table 117. Evonik Industries Corporation Information
- Table 118. Evonik Industries Description and Major Businesses
- Table 119. Evonik Industries Liquid Synthetic Rubber Sales (Tons), Revenue (US$ Million), Price (US$/Ton) and Gross Margin (2018-2023E)
- Table 120. Evonik Industries Liquid Synthetic Rubber Product Model Numbers, Pictures, Descriptions and Specifications
- Table 121. GYC Group Corporation Information
- Table 122. GYC Group Description and Major Businesses
- Table 123. GYC Group Liquid Synthetic Rubber Sales (Tons), Revenue (US$ Million), Price (US$/Ton) and Gross Margin (2018-2023E)
- Table 124. GYC Group Liquid Synthetic Rubber Product Model Numbers, Pictures, Descriptions and Specifications
- Table 125. Puyang Linshi Chemical New Material Co., Ltd. Corporation Information
- Table 126. Puyang Linshi Chemical New Material Co., Ltd. Description and Major Businesses
- Table 127. Puyang Linshi Chemical New Material Co., Ltd. Liquid Synthetic Rubber Sales (Tons), Revenue (US$ Million), Price (US$/Ton) and Gross Margin (2018-2023E)
- Table 128. Puyang Linshi Chemical New Material Co., Ltd. Liquid Synthetic Rubber Product Model Numbers, Pictures, Descriptions and Specifications
- Table 129. Key Raw Material List
- Table 130. Key Suppliers of Raw Materials
- Table 131. Liquid Synthetic Rubber Distributors List
- Table 132. Liquid Synthetic Rubber Customers List
- Table 133. Liquid Synthetic Rubber Market Trends
- Table 134. Liquid Synthetic Rubber Market Drivers
- Table 135. Liquid Synthetic Rubber Market Challenges and Restraints
- Table 136. Research Programs/Design for This Report
- Table 137. Key Data Information from Secondary Sources
- Table 138. Key Data Information from Primary Sources
- Table 139. QYR Business Unit and Senior & Team Lead Analysts
List of Figures
- Figure 1. Liquid Synthetic Rubber Product Picture
- Figure 2. Global Liquid Synthetic Rubber Sales (US$ Million) by Type (2018 & 2022 & 2029)
- Figure 3. Global Liquid Synthetic Rubber Sales Market Share by Type in 2022
- Figure 4. Liquid Isoprene Product Picture
- Figure 5. Major Manufacturers of Liquid Isoprene
- Figure 6. Liquid Butadiene Product Picture
- Figure 7. Liquid Styrene Butadiene Product Picture
- Figure 8. Global Liquid Synthetic Rubber Sales (US$ Million) by Application (2018 & 2022 & 2029)
- Figure 9. Global Liquid Synthetic Rubber Sales Market Share by Application in 2022
- Figure 10. Tire Examples
- Figure 11. Electronic Examples
- Figure 12. Industrial Rubber Examples
- Figure 13. Adhesives, Coatings and Sealants Examples
- Figure 14. Polymer Modification Examples
- Figure 15. Others Examples
- Figure 16. Global Liquid Synthetic Rubber Sales, (US$ Million), 2018 VS 2022 VS 2029
- Figure 17. Global Liquid Synthetic Rubber Sales Growth Rate (2018-2029) & (US$ Million)
- Figure 18. Global Liquid Synthetic Rubber Sales (Tons) Growth Rate (2018-2029)
- Figure 19. Global Liquid Synthetic Rubber Price Trends Growth Rate (2018-2029) & (US$/Ton)
- Figure 20. Liquid Synthetic Rubber Report Years Considered
- Figure 21. Global Market Liquid Synthetic Rubber Market Size (US$ Million) by Region:2018 VS 2022 VS 2029
- Figure 22. Global Liquid Synthetic Rubber Revenue Market Share by Region: 2018-2022
- Figure 23. United States Liquid Synthetic Rubber Revenue (US$ Million) Growth Rate (2018-2029)
- Figure 24. United States Liquid Synthetic Rubber Sales (Tons) Growth Rate (2018-2029)
- Figure 25. Europe Liquid Synthetic Rubber Revenue (US$ Million) Growth Rate (2018-2029)
- Figure 26. Europe Liquid Synthetic Rubber Sales (Tons) Growth Rate (2018-2029)
- Figure 27. China Liquid Synthetic Rubber Revenue (US$ Million) Growth Rate (2018-2029)
- Figure 28. China Liquid Synthetic Rubber Sales (Tons) Growth Rate (2018-2029)
- Figure 29. Japan Liquid Synthetic Rubber Revenue (US$ Million) Growth Rate (2018-2029)
- Figure 30. Japan Liquid Synthetic Rubber Sales (Tons) Growth Rate (2018-2029)
- Figure 31. Southeast Asia Liquid Synthetic Rubber Revenue (US$ Million) Growth Rate (2018-2029)
- Figure 32. Southeast Asia Liquid Synthetic Rubber Sales (Tons) Growth Rate (2018-2029)
- Figure 33. India Liquid Synthetic Rubber Revenue (US$ Million) Growth Rate (2018-2029)
- Figure 34. India Liquid Synthetic Rubber Sales (Tons) Growth Rate (2018-2029)
- Figure 35. Global 5 Largest Liquid Synthetic Rubber Players Market Share by Revenue in Liquid Synthetic Rubber: 2022
- Figure 36. Liquid Synthetic Rubber Market Share by Company Type (Tier 1, Tier 2, and Tier 3): 2022
- Figure 37. Global Liquid Synthetic Rubber Revenue Share by Type (2018-2023)
- Figure 38. Global Liquid Synthetic Rubber Sales Share by Type (2024-2029)
- Figure 39. Global Liquid Synthetic Rubber Revenue Share by Type (2024-2029)
- Figure 40. Global Liquid Synthetic Rubber Revenue Share by Application (2018-2023)
- Figure 41. Global Liquid Synthetic Rubber Sales Share by Application (2024-2029)
- Figure 42. Global Liquid Synthetic Rubber Revenue Share by Application (2024-2029)
- Figure 43. Manufacturing Cost Structure of Liquid Synthetic Rubber
- Figure 44. Liquid Synthetic Rubber Industrial Chain
- Figure 45. Channels of Distribution
- Figure 46. Distributors Profiles
- Figure 47. Bottom-up and Top-down Approaches for This Report
- Figure 48. Data Triangulation
- Figure 49. Key Executives Interviewed
Due to the COVID-19 pandemic, the global Liquid Synthetic Rubber market size was US$ 381.25 million in 2022 and is forecast to a readjusted size of US$ 559.95 million by 2029 with a CAGR of 6.13% during the forecast period 2023-2029.
The global key manufacturers of Liquid Synthetic Rubber include: Cray Valley, H.B. Fuller, Nippon Soda Co., Ltd., Kuraray Co., Ltd., Synthomer, Evonik Industries, GYC Group, Puyang Linshi Chemical New Material Co., Ltd., and etc. In 2022, the global top five players occupied for a share approximately 71.54% in terms of revenue.
Scope and Market Size:
The global Liquid Synthetic Rubber market is segmented by company, region (country), by Type, and by Application. Players, stakeholders, and other participants in the global Liquid Synthetic Rubber market will be able to gain the upper hand as they use the report as a powerful resource. The segmental analysis focuses on sales, revenue and forecast by region (country), by Type and by Application for the period 2018-2029.
By Company
- Cray Valley
- H.B. Fuller
- Nippon Soda Co., Ltd.
- Kuraray Co., Ltd.
- Synthomer
- Evonik Industries
- GYC Group
- Puyang Linshi Chemical New Material Co., Ltd.
Segment by Type
- Liquid Isoprene
- Liquid Butadiene
- Liquid Styrene Butadiene
Segment by Application
- Tire
- Electronic
- Industrial Rubber
- Adhesives, Coatings and Sealants
- Polymer Modification
- Others
By Region
- United States
- Europe
- China
- Japan
- Southeast Asia
- India
- Other Regions
Table of Contents
1 Liquid Synthetic Rubber Market Overview
- 1.1 Liquid Synthetic Rubber Product Scope
- 1.2 Liquid Synthetic Rubber by Type
- 1.2.1 Global Liquid Synthetic Rubber Sales by Type (2018 & 2022 & 2029)
- 1.2.2 Liquid Isoprene
- 1.2.3 Liquid Butadiene
- 1.2.4 Liquid Styrene Butadiene
- 1.3 Liquid Synthetic Rubber by Application
- 1.3.1 Global Liquid Synthetic Rubber Sales Comparison by Application (2018 & 2022 & 2029)
- 1.3.2 Tire
- 1.3.3 Electronic
- 1.3.4 Industrial Rubber
- 1.3.5 Adhesives, Coatings and Sealants
- 1.3.6 Polymer Modification
- 1.3.7 Others
- 1.4 Global Liquid Synthetic Rubber Market Estimates and Forecasts (2018-2029)
- 1.4.1 Global Liquid Synthetic Rubber Market Size in Value Growth Rate (2018-2029)
- 1.4.2 Global Liquid Synthetic Rubber Market Size in Volume Growth Rate (2018-2029)
- 1.4.3 Global Liquid Synthetic Rubber Price Trends (2018-2029)
- 1.5 Assumptions and Limitations
2 Liquid Synthetic Rubber Estimates and Forecasts by Region
- 2.1 Global Liquid Synthetic Rubber Market Size by Region: 2018 VS 2022 VS 2029
- 2.2 Global Liquid Synthetic Rubber Retrospective Market Scenario by Region (2018-2023)
- 2.2.1 Global Liquid Synthetic Rubber Sales Market Share by Region (2018-2023)
- 2.2.2 Global Liquid Synthetic Rubber Revenue Market Share by Region (2018-2023)
- 2.3 Global Liquid Synthetic Rubber Market Estimates and Forecasts by Region (2024-2029)
- 2.3.1 Global Liquid Synthetic Rubber Sales Estimates and Forecasts by Region (2024-2029)
- 2.3.2 Global Liquid Synthetic Rubber Revenue Forecast by Region (2024-2029)
- 2.4 Geographic Market Analysis: Market Facts & Figures
- 2.4.1 United States Liquid Synthetic Rubber Estimates and Projections (2018-2029)
- 2.4.2 Europe Liquid Synthetic Rubber Estimates and Projections (2018-2029)
- 2.4.3 China Liquid Synthetic Rubber Estimates and Projections (2018-2029)
- 2.4.4 Japan Liquid Synthetic Rubber Estimates and Projections (2018-2029)
- 2.4.5 Southeast Asia Liquid Synthetic Rubber Estimates and Projections (2018-2029)
- 2.4.6 India Liquid Synthetic Rubber Estimates and Projections (2018-2029)
3 Liquid Synthetic Rubber Competition Landscape by Players
- 3.1 Global Liquid Synthetic Rubber Sales by Players (2018-2023)
- 3.2 Global Top Liquid Synthetic Rubber Players by Revenue (2018-2023)
- 3.3 Global Liquid Synthetic Rubber Market Share by Company Type (Tier 1, Tier 2, and Tier 3) & (based on the Revenue in Liquid Synthetic Rubber as of 2022)
- 3.4 Global Liquid Synthetic Rubber Average Price by Company (2018-2023)
- 3.5 Global Key Manufacturers of Liquid Synthetic Rubber, Manufacturing Sites & Headquarters
- 3.6 Global Key Manufacturers of Liquid Synthetic Rubber Product Type
- 3.7 Manufacturers Mergers & Acquisitions, Expansion Plans
4 Liquid Synthetic Rubber Market Size by Type
- 4.1 Global Liquid Synthetic Rubber Historic Market Review by Type (2018-2023)
- 4.1.1 Global Liquid Synthetic Rubber Sales by Type (2018-2023)
- 4.1.2 Global Liquid Synthetic Rubber Revenue by Type (2018-2023)
- 4.1.3 Global Liquid Synthetic Rubber Price by Type (2018-2023)
- 4.2 Global Liquid Synthetic Rubber Market Estimates and Forecasts by Type (2024-2029)
- 4.2.1 Global Liquid Synthetic Rubber Sales Forecast by Type (2024-2029)
- 4.2.2 Global Liquid Synthetic Rubber Revenue Forecast by Type (2024-2029)
- 4.2.3 Global Liquid Synthetic Rubber Price Forecast by Type (2024-2029)
5 Global Liquid Synthetic Rubber Market Size by Application
- 5.1 Global Liquid Synthetic Rubber Historic Market Review by Application (2018-2023)
- 5.1.1 Global Liquid Synthetic Rubber Sales by Application (2018-2023)
- 5.1.2 Global Liquid Synthetic Rubber Revenue by Application (2018-2023)
- 5.1.3 Global Liquid Synthetic Rubber Price by Application (2018-2023)
- 5.2 Global Liquid Synthetic Rubber Market Estimates and Forecasts by Application (2024-2029)
- 5.2.1 Global Liquid Synthetic Rubber Sales Forecast by Application (2024-2029)
- 5.2.2 Global Liquid Synthetic Rubber Revenue Forecast by Application (2024-2029)
- 5.2.3 Global Liquid Synthetic Rubber Price Forecast by Application (2024-2029)
6 United States Liquid Synthetic Rubber Market Facts & Figures
- 6.1 United States Liquid Synthetic Rubber Revenue by Company
- 6.2 United States Liquid Synthetic Rubber Sales Breakdown by Type
- 6.2.1 United States Liquid Synthetic Rubber Sales Breakdown by Type (2018-2023)
- 6.2.2 United States Liquid Synthetic Rubber Sales Breakdown by Type (2024-2029)
- 6.3 United States Liquid Synthetic Rubber Sales Breakdown by Application
- 6.3.1 United States Liquid Synthetic Rubber Sales Breakdown by Application (2018-2023)
- 6.3.2 United States Liquid Synthetic Rubber Sales Breakdown by Application (2024-2029)
7 Europe Liquid Synthetic Rubber Market Facts & Figures
- 7.1 Europe Liquid Synthetic Rubber Revenue by Company
- 7.2 Europe Liquid Synthetic Rubber Sales Breakdown by Type
- 7.2.1 Europe Liquid Synthetic Rubber Sales Breakdown by Type (2018-2023)
- 7.2.2 Europe Liquid Synthetic Rubber Sales Breakdown by Type (2024-2029)
- 7.3 Europe Liquid Synthetic Rubber Sales Breakdown by Application
- 7.3.1 Europe Liquid Synthetic Rubber Sales Breakdown by Application (2018-2023)
- 7.3.2 Europe Liquid Synthetic Rubber Sales Breakdown by Application (2024-2029)
8 China Liquid Synthetic Rubber Market Facts & Figures
- 8.1 China Liquid Synthetic Rubber Revenue by Company
- 8.2 China Liquid Synthetic Rubber Sales Breakdown by Type
- 8.2.1 China Liquid Synthetic Rubber Sales Breakdown by Type (2018-2023)
- 8.2.2 China Liquid Synthetic Rubber Sales Breakdown by Type (2024-2029)
- 8.3 China Liquid Synthetic Rubber Sales Breakdown by Application
- 8.3.1 China Liquid Synthetic Rubber Sales Breakdown by Application (2018-2023)
- 8.3.2 China Liquid Synthetic Rubber Sales Breakdown by Application (2024-2029)
9 Japan Liquid Synthetic Rubber Market Facts & Figures
- 9.1 Japan Liquid Synthetic Rubber Revenue by Company
- 9.2 Japan Liquid Synthetic Rubber Sales Breakdown by Type
- 9.2.1 Japan Liquid Synthetic Rubber Sales Breakdown by Type (2018-2023)
- 9.2.2 Japan Liquid Synthetic Rubber Sales Breakdown by Type (2024-2029)
- 9.3 Japan Liquid Synthetic Rubber Sales Breakdown by Application
- 9.3.1 Japan Liquid Synthetic Rubber Sales Breakdown by Application (2018-2023)
- 9.3.2 Japan Liquid Synthetic Rubber Sales Breakdown by Application (2024-2029)
10 Southeast Asia Liquid Synthetic Rubber Market Facts & Figures
- 10.1 Southeast Asia Liquid Synthetic Rubber Revenue by Company
- 10.2 Southeast Asia Liquid Synthetic Rubber Sales Breakdown by Type
- 10.2.1 Southeast Asia Liquid Synthetic Rubber Sales Breakdown by Type (2018-2023)
- 10.2.2 Southeast Asia Liquid Synthetic Rubber Sales Breakdown by Type (2024-2029)
- 10.3 Southeast Asia Liquid Synthetic Rubber Sales Breakdown by Application
- 10.3.1 Southeast Asia Liquid Synthetic Rubber Sales Breakdown by Application (2018-2023)
- 10.3.2 Southeast Asia Liquid Synthetic Rubber Sales Breakdown by Application (2024-2029)
11 India Liquid Synthetic Rubber Market Facts & Figures
- 11.1 India Liquid Synthetic Rubber Revenue by Company
- 11.2 India Liquid Synthetic Rubber Sales Breakdown by Type
- 11.2.1 India Liquid Synthetic Rubber Sales Breakdown by Type (2018-2023)
- 11.2.2 India Liquid Synthetic Rubber Sales Breakdown by Type (2024-2029)
- 11.3 India Liquid Synthetic Rubber Sales Breakdown by Application
- 11.3.1 India Liquid Synthetic Rubber Sales Breakdown by Application (2018-2023)
- 11.3.2 India Liquid Synthetic Rubber Sales Breakdown by Application (2024-2029)
12 Corporate Profile and Key Figures
- 12.1 Cray Valley
- 12.1.1 Cray Valley Corporation Information
- 12.1.2 Cray Valley Overview
- 12.1.3 Cray Valley Liquid Synthetic Rubber Sales, Price, Revenue and Gross Margin (2018-2023E)
- 12.1.4 Cray Valley Liquid Synthetic Rubber Product Model Numbers, Pictures, Descriptions and Specifications
- 12.2 H.B. Fuller
- 12.2.1 H.B. Fuller Corporation Information
- 12.2.2 H.B. Fuller Overview
- 12.2.3 H.B. Fuller Liquid Synthetic Rubber Sales, Price, Revenue and Gross Margin (2018-2023E)
- 12.2.4 H.B. Fuller Liquid Synthetic Rubber Product Model Numbers, Pictures, Descriptions and Specifications
- 12.3 Nippon Soda Co., Ltd.
- 12.3.1 Nippon Soda Co., Ltd. Corporation Information
- 12.3.2 Nippon Soda Co., Ltd. Overview
- 12.3.3 Nippon Soda Co., Ltd. Liquid Synthetic Rubber Sales, Price, Revenue and Gross Margin (2018-2023E)
- 12.3.4 Nippon Soda Co., Ltd. Liquid Synthetic Rubber Product Model Numbers, Pictures, Descriptions and Specifications
- 12.4 Kuraray Co., Ltd.
- 12.4.1 Kuraray Co., Ltd. Corporation Information
- 12.4.2 Kuraray Co., Ltd. Overview
- 12.4.3 Kuraray Co., Ltd. Liquid Synthetic Rubber Sales, Price, Revenue and Gross Margin (2018-2023E)
- 12.4.4 Kuraray Co., Ltd. Liquid Synthetic Rubber Product Model Numbers, Pictures, Descriptions and Specifications
- 12.5 Synthomer
- 12.5.1 Synthomer Corporation Information
- 12.5.2 Synthomer Overview
- 12.5.3 Synthomer Liquid Synthetic Rubber Sales, Price, Revenue and Gross Margin (2018-2023E)
- 12.5.4 Synthomer Liquid Synthetic Rubber Product Model Numbers, Pictures, Descriptions and Specifications
- 12.6 Evonik Industries
- 12.6.1 Evonik Industries Corporation Information
- 12.6.2 Evonik Industries Overview
- 12.6.3 Evonik Industries Liquid Synthetic Rubber Sales, Price, Revenue and Gross Margin (2018-2023E)
- 12.6.4 Evonik Industries Liquid Synthetic Rubber Product Model Numbers, Pictures, Descriptions and Specifications
- 12.7 GYC Group
- 12.7.1 GYC Group Corporation Information
- 12.7.2 GYC Group Overview
- 12.7.3 GYC Group Liquid Synthetic Rubber Sales, Price, Revenue and Gross Margin (2018-2023E)
- 12.7.4 GYC Group Liquid Synthetic Rubber Product Model Numbers, Pictures, Descriptions and Specifications
- 12.8 Puyang Linshi Chemical New Material Co., Ltd.
- 12.8.1 Puyang Linshi Chemical New Material Co., Ltd. Corporation Information
- 12.8.2 Puyang Linshi Chemical New Material Co., Ltd. Overview
- 12.8.3 Puyang Linshi Chemical New Material Co., Ltd. Liquid Synthetic Rubber Sales, Price, Revenue and Gross Margin (2018-2023E)
- 12.8.4 Puyang Linshi Chemical New Material Co., Ltd. Liquid Synthetic Rubber Product Model Numbers, Pictures, Descriptions and Specifications
13 Liquid Synthetic Rubber Manufacturing Cost Analysis
- 13.1 Liquid Synthetic Rubber Key Raw Materials Analysis
- 13.1.1 Key Raw Materials
- 13.1.2 Key Suppliers of Raw Materials
- 13.2 Proportion of Manufacturing Cost Structure
- 13.3 Manufacturing Process Analysis of Liquid Synthetic Rubber
- 13.4 Liquid Synthetic Rubber Industrial Chain Analysis
14 Marketing Channel, Distributors and Customers
- 14.1 Marketing Channel
- 14.2 Liquid Synthetic Rubber Distributors List
- 14.3 Liquid Synthetic Rubber Customers
15 Liquid Synthetic Rubber Market Dynamics
- 15.1.1 Liquid Synthetic Rubber Industry Trends
- 15.1.2 Liquid Synthetic Rubber Market Drivers
- 15.1.3 Liquid Synthetic Rubber Market Challenges and Restraints
16 Research Findings and Conclusion
17 Appendix
- 17.1 Research Methodology
- 17.1.1 Methodology/Research Approach
- 17.1.2 Data Source
- 17.2 Author Details
- 17.3 Disclaimer
