|
|
市場調査レポート
商品コード
1300722
CO2インキュベーターの世界市場 (2023-2029年):市場規模・製造業者・サプライチェーン・販売チャネル・顧客Global CO2 Incubators Market Size, Manufacturers, Supply Chain, Sales Channel and Clients, 2023-2029 |
||||||
|
|
|||||||
カスタマイズ可能
適宜更新あり
|
|||||||


| CO2インキュベーターの世界市場 (2023-2029年):市場規模・製造業者・サプライチェーン・販売チャネル・顧客 |
|
出版日: 2023年07月04日
発行: QYResearch
ページ情報: 英文 147 Pages
納期: 2~3営業日
|

- 全表示
- 概要
- 図表
- 目次
COVID-19とロシア・ウクライナ戦争の影響を考慮すると、世界のCO2インキュベーターの市場規模は、2023年の5億5,500万米ドルから、予測期間中は6.7%のCAGRで推移し、2029年には8億1,900万米ドルの規模に成長すると予測されています。
当レポートでは、世界のCO2インキュベーターの市場を調査し、市場および製品の概要、競合情勢、市場規模の推移・予測、各種区分・地域/主要国別の詳細分析、価格動向、市場成長への各種影響因子の分析、主要企業の分析などをまとめています。
目次
第1章 調査範囲
- 製品概要
- タイプ別市場
- 成長率(2018年 vs 2022年 vs 2029年)
- 100~200L
- 200L超
- 100L未満
- 用途別市場
- 成長率(2018年 vs 2022年 vs 2029年)
- 産業用
- バイオテクノロジー
- 農業
- その他
- 調査目的
- 調査年数
第2章 エグゼクティブサマリー
- 市場規模の推移・予測
- 収益の推移・予測
- 販売数の推移・予測
- 市場規模:2022年・2029年
- 販売数の推移・予測・市場シェア
- 市場推計・予測
- 収益の推移
- 収益の予測
- 市場シェアの推移・予測
第3章 世界のCO2インキュベーター:製造業者別
- 世界の主要製造業者:販売数別
- 世界の主要製造業者:収益別
- 価格:製造業者別
- 競合情勢
- 製造拠点の分布・製品タイプ
- 製造業者のM&A・拡張計画
第4章 企業プロファイル
- Thermo Scientific
- Eppendorf
- PHC(Panasonic Healthcare)
- Binder
- NuAire
- LEEC
- ESCO
- Memmert
- Caron
- Sheldon Manufacturing
- Boxun
- Noki
第5章 内訳データ:タイプ別
- 販売数の推移・予測・市場シェア
- 収益の推移・予測・市場シェア
- 平均販売価格の推移・予測
第6章 内訳データ:用途別
- 販売数の推移・予測・市場シェア
- 収益の推移・予測・市場シェア
- 平均販売価格の推移・予測
第7章 北米
第8章 欧州
第9章 アジア太平洋
第10章 ラテンアメリカ
第11章 中東・アフリカ
第12章 サプライチェーン・販売チャネルの分析
- サプライチェーン分析
- 主要原材料と上流サプライヤー
- 顧客分析
- 販売チャネルと販売モデルの分析
第13章 CO2インキュベーター:市場力学
- 産業動向
- 市場促進要因
- 市場課題
第14章 調査結果・総論
第15章 付録
List of Tables
- Table 1. Global CO2 Incubators Market Size Growth Rate by Type (US$ Million): 2018 VS 2022 VS 2029
- Table 2. Global CO2 Incubators Market Size Growth Rate by Type (US$ Million): 2018 VS 2022 VS 2029
- Table 3. Major Manufacturers of Above 100L and Below 200L
- Table 4. Major Manufacturers of Above 200L
- Table 5. Major Manufacturers of Below 100L
- Table 6. Global CO2 Incubators Market Size Growth by Application (US$ Million): 2018 VS 2022 VS 2029
- Table 7. Global CO2 Incubators Market Size by Region (US$ Million): 2022 VS 2029
- Table 8. Global CO2 Incubators Sales by Region (2018-2023) & (Units)
- Table 9. Global CO2 Incubators Sales Forecast by Region (2024-2029) & (Units)
- Table 10. Global CO2 Incubators Revenue by Region (2018-2023) & (US$ Million)
- Table 11. Global CO2 Incubators Revenue Forecast by Region (2024-2029) & (US$ Million)
- Table 12. Global CO2 Incubators Sales by Manufacturer (2018-2023) & (Units)
- Table 13. Global CO2 Incubators Sales Share by Manufacturer (2018-2023)
- Table 14. CO2 Incubators Revenue by Manufacturer (2018-2023) & (US$ Million)
- Table 15. CO2 Incubators Revenue Share by Manufacturer (2018-2023)
- Table 16. Key Manufacturers CO2 Incubators Price (2018-2023) & (thousand USD/Unit)
- Table 17. Ranking of Global Top CO2 Incubators Manufacturers by Revenue (US$ Million) in 2022
- Table 18. Global CO2 Incubators Manufacturers Market Concentration Ratio (CR5) & (2018-2023)
- Table 19. Global CO2 Incubators by Company Type (Tier 1, Tier 2, and Tier 3) & (based on the Revenue in CO2 Incubators as of 2022)
- Table 20. CO2 Incubators Manufacturers Manufacturing Base Distribution and Headquarters
- Table 21. Manufacturers CO2 Incubators Product Type
- Table 22. Date of International Manufacturers Enter into CO2 Incubators Market
- Table 23. Manufacturers Mergers & Acquisitions, Expansion Plans
- Table 24. Thermo Scientific Company Information
- Table 25. Thermo Scientific Description and Business Overview
- Table 26. Thermo Scientific CO2 Incubators Product
- Table 27. Thermo Scientific CO2 Incubators Sales (Units), Revenue (US$ Million), Price (thousand USD/Unit) and Gross Margin (2018-2023)
- Table 28. Thermo Scientific Sales Proportion of CO2 Incubators by Product in 2022
- Table 29. Thermo Scientific Sales Proportion of CO2 Incubators by Application in 2022
- Table 30. Thermo Scientific Sales Proportion of CO2 Incubators by Geographic Area in 2022
- Table 31. Eppendorf Company Information
- Table 32. Eppendorf Description and Business Overview
- Table 33. Eppendorf CO2 Incubators Product
- Table 34. Eppendorf CO2 Incubators Sales (Units), Revenue (US$ Million), Price (thousand USD/Unit) and Gross Margin (2018-2023)
- Table 35. Eppendorf Sales Proportion of CO2 Incubators by Product in 2022
- Table 36. Eppendorf Sales Proportion of CO2 Incubators by Application in 2022
- Table 37. Eppendorf Sales Proportion of CO2 Incubators by Geographic Area in 2022
- Table 38. PHC (Panasonic Healthcare) Company Information
- Table 39. PHC (Panasonic Healthcare) Description and Business Overview
- Table 40. PHC (Panasonic Healthcare) CO2 Incubators Product
- Table 41. PHC (Panasonic Healthcare) CO2 Incubators Sales (Units), Revenue (US$ Million), Price (thousand USD/Unit) and Gross Margin (2018-2023)
- Table 42. PHC (Panasonic Healthcare) Sales Proportion of CO2 Incubators by Product in 2022
- Table 43. PHC (Panasonic Healthcare) Sales Proportion of CO2 Incubators by Application in 2022
- Table 44. PHC (Panasonic Healthcare) Sales Proportion of CO2 Incubators by Geographic Area in 2022
- Table 45. PHC (Panasonic Healthcare) Recent Developments
- Table 46. Binder Company Information
- Table 47. Binder Description and Business Overview
- Table 48. Binder CO2 Incubators Product
- Table 49. Binder CO2 Incubators Sales (Units), Revenue (US$ Million), Price (thousand USD/Unit) and Gross Margin (2018-2023)
- Table 50. Binder Sales Proportion of CO2 Incubators by Product in 2022
- Table 51. Binder Sales Proportion of CO2 Incubators by Application in 2022
- Table 52. Binder Sales Proportion of CO2 Incubators by Geographic Area in 2022
- Table 53. NuAire Company Information
- Table 54. NuAire Description and Business Overview
- Table 55. NuAire CO2 Incubators Product
- Table 56. NuAire CO2 Incubators Sales (Units), Revenue (US$ Million), Price (thousand USD/Unit) and Gross Margin (2018-2023)
- Table 57. NuAire Sales Proportion of CO2 Incubators by Product in 2022
- Table 58. NuAire Sales Proportion of CO2 Incubators by Application in 2022
- Table 59. NuAire Sales Proportion of CO2 Incubators by Geographic Area in 2022
- Table 60. LEEC Company Information
- Table 61. LEEC Description and Business Overview
- Table 62. LEEC CO2 Incubators Product
- Table 63. LEEC CO2 Incubators Sales (Units), Revenue (US$ Million), Price (thousand USD/Unit) and Gross Margin (2018-2023)
- Table 64. LEEC Sales Proportion of CO2 Incubators by Product in 2022
- Table 65. LEEC Sales Proportion of CO2 Incubators by Application in 2022
- Table 66. LEEC Sales Proportion of CO2 Incubators by Geographic Area in 2022
- Table 67. ESCO Company Information
- Table 68. ESCO Description and Business Overview
- Table 69. ESCO CO2 Incubators Product
- Table 70. ESCO CO2 Incubators Sales (Units), Revenue (US$ Million), Price (thousand USD/Unit) and Gross Margin (2018-2023)
- Table 71. ESCO Sales Proportion of CO2 Incubators by Product in 2022
- Table 72. ESCO Sales Proportion of CO2 Incubators by Application in 2022
- Table 73. ESCO Sales Proportion of CO2 Incubators by Geographic Area in 2022
- Table 74. Memmert Company Information
- Table 75. Memmert Description and Business Overview
- Table 76. Memmert CO2 Incubators Product
- Table 77. Memmert CO2 Incubators Sales (Units), Revenue (US$ Million), Price (thousand USD/Unit) and Gross Margin (2018-2023)
- Table 78. Memmert Sales Proportion of CO2 Incubators by Product in 2022
- Table 79. Memmert Sales Proportion of CO2 Incubators by Application in 2022
- Table 80. Memmert Sales Proportion of CO2 Incubators by Geographic Area in 2022
- Table 81. Caron Company Information
- Table 82. Caron Description and Business Overview
- Table 83. Caron CO2 Incubators Product
- Table 84. Caron CO2 Incubators Sales (Units), Revenue (US$ Million), Price (thousand USD/Unit) and Gross Margin (2018-2023)
- Table 85. Caron Sales Proportion of CO2 Incubators by Product in 2022
- Table 86. Caron Sales Proportion of CO2 Incubators by Application in 2022
- Table 87. Caron Sales Proportion of CO2 Incubators by Geographic Area in 2022
- Table 88. Sheldon Manufacturing Company Information
- Table 89. Sheldon Manufacturing Description and Business Overview
- Table 90. Sheldon Manufacturing CO2 Incubators Product
- Table 91. Sheldon Manufacturing CO2 Incubators Sales (Units), Revenue (US$ Million), Price (thousand USD/Unit) and Gross Margin (2018-2023)
- Table 92. Sheldon Manufacturing Sales Proportion of CO2 Incubators by Product in 2022
- Table 93. Sheldon Manufacturing Sales Proportion of CO2 Incubators by Application in 2022
- Table 94. Sheldon Manufacturing Sales Proportion of CO2 Incubators by Geographic Area in 2022
- Table 95. Boxun Company Information
- Table 96. Boxun Description and Business Overview
- Table 97. Boxun CO2 Incubators Product
- Table 98. Boxun CO2 Incubators Sales (Units), Revenue (US$ Million), Price (thousand USD/Unit) and Gross Margin (2018-2023)
- Table 99. Boxun Sales Proportion of CO2 Incubators by Product in 2022
- Table 100. Boxun Sales Proportion of CO2 Incubators by Application in 2022
- Table 101. Boxun Sales Proportion of CO2 Incubators by Geographic Area in 2022
- Table 102. Noki Company Information
- Table 103. Noki Description and Business Overview
- Table 104. Noki CO2 Incubators Product
- Table 105. Noki CO2 Incubators Sales (Units), Revenue (US$ Million), Price (thousand USD/Unit) and Gross Margin (2018-2023)
- Table 106. Noki Sales Proportion of CO2 Incubators by Product in 2022
- Table 107. Noki Sales Proportion of CO2 Incubators by Application in 2022
- Table 108. Noki Sales Proportion of CO2 Incubators by Geographic Area in 2022
- Table 109. Global CO2 Incubators Sales by Type (2018-2023) & (Units)
- Table 110. Global CO2 Incubators Sales Forecast by Type (2024-2029) & (Units)
- Table 111. Global CO2 Incubators Revenue by Type (2018-2023) & (US$ Million)
- Table 112. Global CO2 Incubators Revenue Forecast by Type (2024-2029) & (US$ Million)
- Table 113. Global CO2 Incubators Sales by Application (2018-2023) & (Units)
- Table 114. Global CO2 Incubators Sales Forecast by Application (2024-2029) & (Units)
- Table 115. Global CO2 Incubators Revenue by Application (2018-2023) & (US$ Million)
- Table 116. Global CO2 Incubators Revenue Forecast by Application (2024-2029) & (US$ Million)
- Table 117. North America CO2 Incubators Sales by Country (2018-2023) & (Units)
- Table 118. North America CO2 Incubators Sales by Country (2024-2029) & (Units)
- Table 119. North America CO2 Incubators Revenue by Country (2018-2023) & (US$ Million)
- Table 120. North America CO2 Incubators Revenue by Country (2024-2029) & (US$ Million)
- Table 121. North America CO2 Incubators Sales by Type (2018-2023) & (Units)
- Table 122. North America CO2 Incubators Sales by Application (2018-2023) & (Units)
- Table 123. Europe CO2 Incubators Sales by Country (2018-2023) & (Units)
- Table 124. Europe CO2 Incubators Sales by Country (2024-2029) & (Units)
- Table 125. Europe CO2 Incubators Revenue by Country (2018-2023) & (US$ Million)
- Table 126. Europe CO2 Incubators Revenue by Country (2024-2029) & (US$ Million)
- Table 127. Europe CO2 Incubators Sales by Type (2018-2023) & (Units)
- Table 128. Europe CO2 Incubators Sales by Application (2018-2023) & (Units)
- Table 129. Asia-Pacific CO2 Incubators Sales by Region (2018-2023) & (Units)
- Table 130. Asia-Pacific CO2 Incubators Sales by Region (2024-2029) & (Units)
- Table 131. Asia-Pacific CO2 Incubators Revenue by Region (2018-2023) & (US$ Million)
- Table 132. Asia-Pacific CO2 Incubators Revenue by Region (2024-2029) & (US$ Million)
- Table 133. Asia-Pacific CO2 Incubators Sales by Type (2018-2023) & (Units)
- Table 134. Asia-Pacific CO2 Incubators Sales by Application (2018-2023) & (Units)
- Table 135. Latin America CO2 Incubators Sales by Country (2018-2023) & (Units)
- Table 136. Latin America CO2 Incubators Sales by Country (2024-2029) & (Units)
- Table 137. Latin America CO2 Incubators Revenue by Country (2018-2023) & (US$ Million)
- Table 138. Latin America CO2 Incubators Revenue by Country (2024-2029) & (US$ Million)
- Table 139. Latin America CO2 Incubators Sales by Type (2018-2023) & (Units)
- Table 140. Latin America CO2 Incubators Sales by Application (2018-2023) & (Units)
- Table 141. Middle East and Africa CO2 Incubators Sales by Country (2018-2023) & (Units)
- Table 142. Middle East and Africa CO2 Incubators Sales by Country (2024-2029) & (Units)
- Table 143. Middle East and Africa CO2 Incubators Revenue by Country (2018-2023) & (US$ Million)
- Table 144. Middle East and Africa CO2 Incubators Revenue by Country (2024-2029) & (US$ Million)
- Table 145. Middle East and Africa CO2 Incubators Sales by Type (2018-2023) & (Units)
- Table 146. Middle East and Africa CO2 Incubators Sales by Application (2018-2023) & (Units)
- Table 147. CO2 Incubators Key Raw Materials and Upstream Suppliers
- Table 148. CO2 Incubators Typical Clients
- Table 149. CO2 Incubators Distributors
- Table 150. CO2 Incubators Market Trends
- Table 151. CO2 Incubators Market Drivers
- Table 152. CO2 Incubators Market Challenges
- Table 153. Research Programs/Design for This Report
- Table 154. Key Data Information from Secondary Sources
- Table 155. Key Data Information from Primary Sources
List of Figures
- Figure 1. CO2 Incubators Product Picture
- Figure 2. Global CO2 Incubators Market Size by Type (US$ Million): 2018 VS 2022 VS 2029
- Figure 3. Global CO2 Incubators Sales Market Share by Type in 2022 & 2029
- Figure 4. Above 100L and Below 200L Product Picture - Thermo Scientific™ Forma™ Direct Heat CO2 Incubator, 184 L
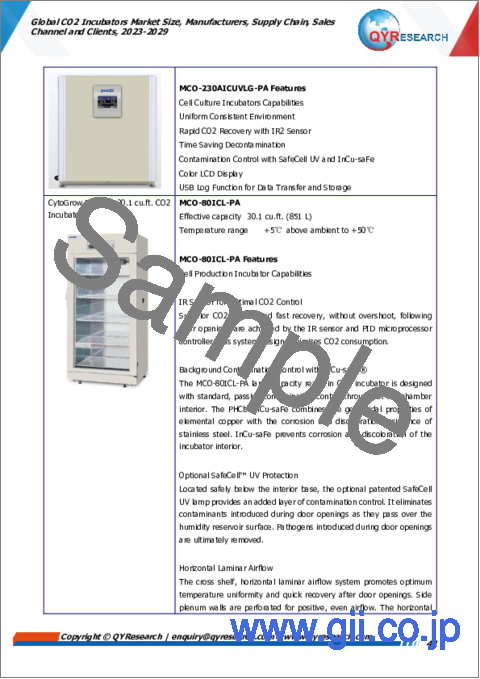
- Figure 5. Above 200L Product Picture - Thermo Scientific™ Large-Capacity Reach-In CO2 Incubator, 821 L
- Figure 6. Below 100L Product Picture - CelMate? CO? Incubator 50L
- Figure 7. Global CO2 Incubators Market Size by Application (US$ Million): 2018 VS 2022 VS 2029
- Figure 8. Global CO2 Incubators Sales Market Share by Application in 2022 & 2029
- Figure 9. Industrial
- Figure 10. Biotechnology
- Figure 11. Agriculture
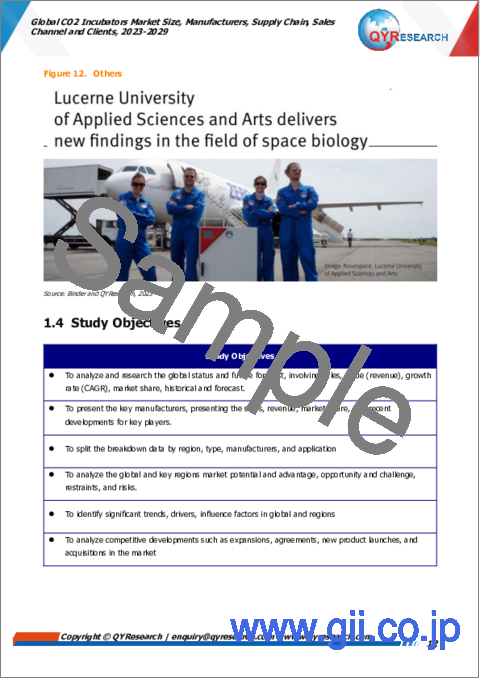
- Figure 12. Others
- Figure 13. CO2 Incubators Report Years Considered
- Figure 14. Global CO2 Incubators Revenue, (US$ Million), 2018 VS 2023 VS 2029
- Figure 15. Global CO2 Incubators Market Size 2018-2029 (US$ Million)
- Figure 16. Global CO2 Incubators Sales 2018-2029 (Units)
- Figure 17. Global CO2 Incubators Sales Market Share Forecast by Region (2018-2029)
- Figure 18. Global CO2 Incubators Revenue Market Share by Region (2018-2029)
- Figure 19. Global CO2 Incubators Sales Share by Manufacturer in 2022
- Figure 20. CO2 Incubators Market Share by Company Type (Tier 1, Tier 2, and Tier 3): 2018 VS 2022
- Figure 21. Global CO2 Incubators Sales Market Share Forecast by Type (2018-2029)
- Figure 22. Global CO2 Incubators Revenue Market Share Forecast by Type (2018-2029)
- Figure 23. CO2 Incubators Average Selling Price (ASP) by Type (2018-2023) & (thousand USD/Unit)
- Figure 24. Global CO2 Incubators Sales Market Share Forecast by Application (2018-2029)
- Figure 25. Global CO2 Incubators Revenue Market Share Forecast by Application (2018-2029)
- Figure 26. CO2 Incubators Average Selling Price (ASP) by Application (2018-2023) & (thousand USD/Unit)
- Figure 27. North America CO2 Incubators Revenue 2018-2029 (US$ Million)
- Figure 28. North America CO2 Incubators Sales Market Share by Type (2018-2023)
- Figure 29. North America CO2 Incubators Sales Market Share by Application (2018-2023)
- Figure 30. Europe CO2 Incubators Revenue Growth Rate 2018-2029 (US$ Million)
- Figure 31. Europe CO2 Incubators Sales Market Share by Country (2018-2029)
- Figure 32. Europe CO2 Incubators Revenue Market Share by Country (2018-2029)
- Figure 33. Europe CO2 Incubators Sales Market Share by Type (2018-2023)
- Figure 34. Europe CO2 Incubators Sales Market Share by Application (2018-2023)
- Figure 35. Asia-Pacific CO2 Incubators Revenue 2018-2029 (US$ Million)
- Figure 36. Asia-Pacific CO2 Incubators Sales Market Share by Region (2018-2029)
- Figure 37. Asia-Pacific CO2 Incubators Revenue Market Share by Region (2018-2029)
- Figure 38. Asia-Pacific CO2 Incubators Sales Market Share by Type (2018-2023)
- Figure 39. Asia-Pacific CO2 Incubators Sales Market Share by Application (2018-2023)
- Figure 40. Latin America CO2 Incubators Revenue Growth Rate 2018-2029 (US$ Million)
- Figure 41. Latin America CO2 Incubators Sales Market Share by Country (2018-2029)
- Figure 42. Latin America CO2 Incubators Revenue Market Share by Country (2018-2029)
- Figure 43. Latin America CO2 Incubators Sales Market Share by Type (2018-2023)
- Figure 44. Latin America CO2 Incubators Sales Market Share by Application (2018-2023)
- Figure 45. Middle East and Africa CO2 Incubators Revenue Growth Rate 2018-2029 (US$ Million)
- Figure 46. Middle East and Africa CO2 Incubators Sales Market Share by Country (2018-2029)
- Figure 47. Middle East and Africa CO2 Incubators Revenue Market Share by Country (2018-2029)
- Figure 48. Middle East and Africa CO2 Incubators Sales Market Share by Type (2018-2023)
- Figure 49. Middle East and Africa CO2 Incubators Sales Market Share by Application (2018-2023)
- Figure 50. CO2 Incubators Supply Chain (Upstream and Downstream Market)
- Figure 51. CO2 Incubators Structure
- Figure 52. CO2 Incubators Distribution Channels
- Figure 53. Global CO2 Incubators Percentage 2018-2029: Indirect Sales VS Direct Sales
- Figure 54. Bottom-up and Top-down Approaches for This Report
- Figure 55. Data Triangulation
- Figure 56. Key Executives Interviewed
Considering the economic change due to COVID-19 and Russia-Ukraine War Influence, the global CO2 Incubators market is projected to reach US$ 819 million by 2029 from an estimated US$ 555 million in 2023, at a CAGR of 6.7% during 2023 and 2029.
The global key companies of CO2 Incubators include: Thermo Scientific, Eppendorf, PHC (Panasonic Healthcare), Binder, NuAire, LEEC, ESCO, Memmert, and Caron, etc. In 2022, the global five largest players hold a share approximately 2/3 in terms of revenue.
Report Scope
This report aims to provide a comprehensive presentation of the global market for CO2 Incubators, with both quantitative and qualitative analysis, to help readers develop business/growth strategies, assess the market competitive situation, analyze their position in the current marketplace, and make informed business decisions regarding CO2 Incubators.
The CO2 Incubators market size, estimations, and forecasts are provided in terms of sales volume (K Units) and revenue ($ millions), considering 2022 as the base year, with history and forecast data for the period from 2018 to 2029. This report segments the global CO2 Incubators market comprehensively. Regional market sizes, concerning products by Type, by Application, and by players, are also provided. The influence of COVID-19 and the Russia-Ukraine War were considered while estimating market sizes.
For a more in-depth understanding of the market, the report provides profiles of the competitive landscape, key competitors, and their respective market ranks. The report also discusses technological trends and new product developments.
The report will help the CO2 Incubators manufacturers, new entrants, and industry chain related companies in this market with information on the revenues, sales volume, and average price for the overall market and the sub-segments across the different segments, by company, by Type, by Application, and regions.
By Company
- Thermo Scientific
- Eppendorf
- PHC (Panasonic Healthcare)
- Binder
- NuAire
- LEEC
- ESCO
- Memmert
- Caron
- Sheldon Manufacturing
- Boxun
- Noki
Segment by Type
- Above 100L and Below 200L
- Above 200L
- Below 100L
Segment by Application
- Industrial
- Biotechnology
- Agriculture
- Others
By Region
- North America
- United States
- Canada
- Asia-Pacific
- China
- Japan
- South Korea
- India
- Southeast Asia
- Australia
- Europe
- Germany
- France
- U.K.
- Italy
- Russia
- Rest of Europe
- Latin America
- Mexico
- Brazil
- Rest of Latin America
- Middle East & Africa
- Turkey
- Saudi Arabia
- UAE
- Rest of MEA
Table of Contents
1 Study Coverage
- 1.1 CO2 Incubators Product Introduction
- 1.2 Market by Type
- 1.2.1 Global CO2 Incubators Market Size Growth Rate by Type (2018 VS 2022 VS 2029)
- 1.2.2 Above 100L and Below 200L
- 1.2.3 Above 200L
- 1.2.4 Below 100L
- 1.3 Market by Application
- 1.3.1 Global CO2 Incubators Market Size Growth Rate by Application (2018 VS 2022 VS 2029)
- 1.3.2 Industrial
- 1.3.3 Biotechnology
- 1.3.4 Agriculture
- 1.3.5 Others
- 1.4 Study Objectives
- 1.5 Years Considered
2 Executive Summary
- 2.1 Global CO2 Incubators Market Size Estimates and Forecasts
- 2.1.1 Global CO2 Incubators Revenue 2018-2029
- 2.1.2 Global CO2 Incubators Sales 2018-2029
- 2.2 CO2 Incubators Market Size by Region: 2022 Versus 2029
- 2.3 CO2 Incubators Sales by Region (2018-2029)
- 2.3.1 Global CO2 Incubators Sales by Region: 2018-2023
- 2.3.2 Global CO2 Incubators Sales Forecast by Region (2024-2029)
- 2.3.3 Global CO2 Incubators Sales Market Share by Region (2018-2029)
- 2.4 CO2 Incubators Market Estimates and Projections by Region (2024-2029)
- 2.4.1 Global CO2 Incubators Revenue by Region: 2018-2023
- 2.4.2 Global CO2 Incubators Revenue Forecast by Region (2024-2029)
- 2.4.3 Global CO2 Incubators Revenue Market Share by Region (2018-2029)
3 Global CO2 Incubators by Manufacturers
- 3.1 Global Top CO2 Incubators Manufacturers by Sales (2018-2023)
- 3.1.1 Global CO2 Incubators Sales by Manufacturer (2018-2023)
- 3.1.2 Global CO2 Incubators Sales Market Share by Manufacturer (2018-2023)
- 3.2 Global Top CO2 Incubators Manufacturers by Revenue (2018-2023)
- 3.2.1 Global CO2 Incubators Revenue by Manufacturer (2018-2023)
- 3.2.2 Global CO2 Incubators Revenue Share by Manufacturer (2018-2023)
- 3.3 Global CO2 Incubators Price by Manufacturer (2018-2023)
- 3.4 Competitive Landscape
- 3.4.1 Key CO2 Incubators Manufacturers Covered: Ranking by Revenue
- 3.4.2 Global CO2 Incubators Market Concentration Ratio (CR5) & (2018-2023)
- 3.4.3 Global CO2 Incubators Market Share by Company Type (Tier 1, Tier 2, and Tier 3)
- 3.5 Global CO2 Incubators Manufacturing Base Distribution, Product Type
- 3.5.1 CO2 Incubators Manufacturers Manufacturing Base Distribution, Headquarters
- 3.5.2 Manufacturers CO2 Incubators Product Type
- 3.5.3 Date of International Manufacturers Enter into CO2 Incubators Market
- 3.6 Manufacturers Mergers & Acquisitions, Expansion Plans
4 Company Profiles
- 4.1 Thermo Scientific
- 4.1.1 Thermo Scientific Company Information
- 4.1.2 Thermo Scientific Description, Business Overview
- 4.1.3 Thermo Scientific CO2 Incubators Products Offered
- 4.1.4 Thermo Scientific CO2 Incubators Sales, Revenue and Gross Margin (2018-2023)
- 4.1.5 Thermo Scientific CO2 Incubators Sales by Product in 2022
- 4.1.6 Thermo Scientific CO2 Incubators Sales by Application in 2022
- 4.1.7 Thermo Scientific CO2 Incubators Sales by Geographic Area in 2022
- 4.2 Eppendorf
- 4.2.1 Eppendorf Company Information
- 4.2.2 Eppendorf Description, Business Overview
- 4.2.3 Eppendorf CO2 Incubators Products Offered
- 4.2.4 Eppendorf CO2 Incubators Sales, Revenue and Gross Margin (2018-2023)
- 4.2.5 Eppendorf CO2 Incubators Sales by Product in 2022
- 4.2.6 Eppendorf CO2 Incubators Sales by Application in 2022
- 4.2.7 Eppendorf CO2 Incubators Sales by Geographic Area in 2022
- 4.3 PHC (Panasonic Healthcare)
- 4.3.1 PHC (Panasonic Healthcare) Company Information
- 4.3.2 PHC (Panasonic Healthcare) Description, Business Overview
- 4.3.3 PHC (Panasonic Healthcare) CO2 Incubators Products Offered
- 4.3.4 PHC (Panasonic Healthcare) CO2 Incubators Sales, Revenue and Gross Margin (2018-2023)
- 4.3.5 PHC (Panasonic Healthcare) CO2 Incubators Sales by Product in 2022
- 4.3.6 PHC (Panasonic Healthcare) CO2 Incubators Sales by Application in 2022
- 4.3.7 PHC (Panasonic Healthcare) CO2 Incubators Sales by Geographic Area in 2022
- 4.3.8 PHC (Panasonic Healthcare) Recent Developments
- 4.4 Binder
- 4.4.1 Binder Company Information
- 4.4.2 Binder Description, Business Overview
- 4.4.3 Binder CO2 Incubators Products Offered
- 4.4.4 Binder CO2 Incubators Sales, Revenue and Gross Margin (2018-2023)
- 4.4.5 Binder CO2 Incubators Sales by Product in 2022
- 4.4.6 Binder CO2 Incubators Sales by Application in 2022
- 4.4.7 Binder CO2 Incubators Sales by Geographic Area in 2022
- 4.5 NuAire
- 4.5.1 NuAire Company Information
- 4.5.2 NuAire Description, Business Overview
- 4.5.3 NuAire CO2 Incubators Products Offered
- 4.5.4 NuAire CO2 Incubators Sales, Revenue and Gross Margin (2018-2023)
- 4.5.5 NuAire CO2 Incubators Sales by Product in 2022
- 4.5.6 NuAire CO2 Incubators Sales by Application in 2022
- 4.5.7 NuAire CO2 Incubators Sales by Geographic Area in 2022
- 4.6 LEEC
- 4.6.1 LEEC Company Information
- 4.6.2 LEEC Description, Business Overview
- 4.6.3 LEEC CO2 Incubators Products Offered
- 4.6.4 LEEC CO2 Incubators Sales, Revenue and Gross Margin (2018-2023)
- 4.6.5 LEEC CO2 Incubators Sales by Product in 2022
- 4.6.6 LEEC CO2 Incubators Sales by Application in 2022
- 4.6.7 LEEC CO2 Incubators Sales by Geographic Area in 2022
- 4.7 ESCO
- 4.7.1 ESCO Company Information
- 4.7.2 ESCO Description, Business Overview
- 4.7.3 ESCO CO2 Incubators Products Offered
- 4.7.4 ESCO CO2 Incubators Sales, Revenue and Gross Margin (2018-2023)
- 4.7.5 ESCO CO2 Incubators Sales by Product in 2022
- 4.7.6 ESCO CO2 Incubators Sales by Application in 2022
- 4.7.7 ESCO CO2 Incubators Sales by Geographic Area in 2022
- 4.8 Memmert
- 4.8.1 Memmert Company Information
- 4.8.2 Memmert Description, Business Overview
- 4.8.3 Memmert CO2 Incubators Products Offered
- 4.8.4 Memmert CO2 Incubators Sales, Revenue and Gross Margin (2018-2023)
- 4.8.5 Memmert CO2 Incubators Sales by Product in 2022
- 4.8.6 Memmert CO2 Incubators Sales by Application in 2022
- 4.8.7 Memmert CO2 Incubators Sales by Geographic Area in 2022
- 4.9 Caron
- 4.9.1 Caron Company Information
- 4.9.2 Caron Description, Business Overview
- 4.9.3 Caron CO2 Incubators Products Offered
- 4.9.4 Caron CO2 Incubators Sales, Revenue and Gross Margin (2018-2023)
- 4.9.5 Caron CO2 Incubators Sales by Product in 2022
- 4.9.6 Caron CO2 Incubators Sales by Application in 2022
- 4.9.7 Caron CO2 Incubators Sales by Geographic Area in 2022
- 4.10 Sheldon Manufacturing
- 4.10.1 Sheldon Manufacturing Company Information
- 4.10.2 Sheldon Manufacturing Description, Business Overview
- 4.10.3 Sheldon Manufacturing CO2 Incubators Products Offered
- 4.10.4 Sheldon Manufacturing CO2 Incubators Sales, Revenue and Gross Margin (2018-2023)
- 4.10.5 Sheldon Manufacturing CO2 Incubators Sales by Product in 2022
- 4.10.6 Sheldon Manufacturing CO2 Incubators Sales by Application in 2022
- 4.10.7 Sheldon Manufacturing CO2 Incubators Sales by Geographic Area in 2022
- 4.11 Boxun
- 4.11.1 Boxun Company Information
- 4.11.2 Boxun Description, Business Overview
- 4.11.3 Boxun CO2 Incubators Products Offered
- 4.11.4 Boxun CO2 Incubators Sales, Revenue and Gross Margin (2018-2023)
- 4.11.5 Boxun CO2 Incubators Sales by Product in 2022
- 4.11.6 Boxun CO2 Incubators Sales by Application in 2022
- 4.11.7 Boxun CO2 Incubators Sales by Geographic Area in 2022
- 4.12 Noki
- 4.12.1 Noki Company Information
- 4.12.2 Noki Description, Business Overview
- 4.12.3 Noki CO2 Incubators Products Offered
- 4.12.4 Noki CO2 Incubators Sales, Revenue and Gross Margin (2018-2023)
- 4.12.5 Noki CO2 Incubators Sales by Product in 2022
- 4.12.6 Noki CO2 Incubators Sales by Application in 2022
- 4.12.7 Noki CO2 Incubators Sales by Geographic Area in 2022
5 Breakdown Data by Type
- 5.1 Global CO2 Incubators Sales by Type (2018-2029)
- 5.1.1 Global CO2 Incubators Sales by Type (2018-2023)
- 5.1.2 Global CO2 Incubators Sales Forecast by Type (2024-2029)
- 5.1.3 Global CO2 Incubators Sales Market Share by Type (2018-2029)
- 5.2 Global CO2 Incubators Revenue Forecast by Type (2018-2029)
- 5.2.1 Global CO2 Incubators Revenue by Type (2018-2023)
- 5.2.2 Global CO2 Incubators Revenue Forecast by Type (2024-2029)
- 5.2.3 Global CO2 Incubators Revenue Market Share by Type (2018-2029)
- 5.3 CO2 Incubators Average Selling Price (ASP) by Type (2018-2029)
6 Breakdown Data by Application
- 6.1 Global CO2 Incubators Sales by Application (2018-2029)
- 6.1.1 Global CO2 Incubators Sales by Application (2018-2023)
- 6.1.2 Global CO2 Incubators Sales Forecast by Application (2024-2029)
- 6.1.3 Global CO2 Incubators Sales Market Share by Application (2018-2029)
- 6.2 Global CO2 Incubators Revenue Forecast by Application (2018-2029)
- 6.2.1 Global CO2 Incubators Revenue by Application (2018-2023)
- 6.2.2 Global CO2 Incubators Revenue Forecast by Application (2024-2029)
- 6.2.3 Global CO2 Incubators Revenue Market Share by Application (2018-2029)
- 6.3 CO2 Incubators Average Selling Price (ASP) by Application (2018-2029)
7 North America
- 7.1 North America CO2 Incubators Market Size YoY Growth 2018-2029
- 7.2 North America CO2 Incubators Market Facts & Figures by Country
- 7.2.1 North America CO2 Incubators Sales by Country (2018-2029)
- 7.2.2 North America CO2 Incubators Revenue by Country (2018-2029)
- 7.3 North America CO2 Incubators Sales by Type (2018-2023)
- 7.4 North America CO2 Incubators Sales by Application (2018-2023)
8 Europe
- 8.1 Europe CO2 Incubators Market Size YoY Growth 2018-2029
- 8.2 Europe CO2 Incubators Market Facts & Figures by Country
- 8.2.1 Europe CO2 Incubators Sales by Country (2018-2029)
- 8.2.2 Europe CO2 Incubators Revenue by Country (2018-2029)
- 8.3 Europe CO2 Incubators Sales by Type (2018-2023)
- 8.4 Europe CO2 Incubators Sales by Application (2018-2023)
9 Asia-Pacific
- 9.1 Asia-Pacific CO2 Incubators Market Size YoY Growth 2018-2029
- 9.2 Asia-Pacific CO2 Incubators Market Facts & Figures by Region
- 9.2.1 Asia-Pacific CO2 Incubators Sales by Region (2018-2029)
- 9.2.2 Asia-Pacific CO2 Incubators Revenue by Region (2018-2029)
- 9.3 Asia-Pacific CO2 Incubators Sales by Type (2018-2023)
- 9.4 Asia-Pacific CO2 Incubators Sales by Application (2018-2023)
10 Latin America
- 10.1 Latin America CO2 Incubators Market Size YoY Growth 2018-2029
- 10.2 Latin America CO2 Incubators Market Facts & Figures by Country
- 10.2.1 Latin America CO2 Incubators Sales by Country (2018-2029)
- 10.2.2 Latin America CO2 Incubators Revenue by Country (2018-2029)
- 10.3 Latin America CO2 Incubators Sales by Type (2018-2023)
- 10.4 Latin America CO2 Incubators Sales by Application (2018-2023)
11 Middle East and Africa
- 11.1 Latin America CO2 Incubators Market Size YoY Growth 2018-2029
- 11.2 Middle East and Africa CO2 Incubators Market Facts & Figures by Country
- 11.2.1 Middle East and Africa CO2 Incubators Sales by Country (2018-2029)
- 11.2.2 Middle East and Africa CO2 Incubators Revenue by Country (2018-2029)
- 11.3 Middle East and Africa CO2 Incubators Sales by Type (2018-2023)
- 11.4 Middle East and Africa CO2 Incubators Sales by Application (2018-2023)
12 Supply Chain and Sales Channel analysis
- 12.1 CO2 Incubators Supply Chain Analysis
- 12.2 CO2 Incubators Key Raw Materials and Upstream Suppliers
- 12.3 CO2 Incubators Clients Analysis
- 12.4 CO2 Incubators Sales Channel and Sales Model Analysis
- 12.4.1 CO2 Incubators Distribution Channel Analysis: Indirect Sales VS Direct Sales
- 12.4.2 CO2 Incubators Distribution Channel Analysis: Online Sales VS Offline Sales
- 12.4.3 CO2 Incubators Distributors
13 CO2 Incubators Market Dynamics
- 13.1 CO2 Incubators Industry Trends
- 13.2 CO2 Incubators Market Drivers
- 13.3 CO2 Incubators Market Challenges
14 Research Findings and Conclusion
15 Appendix
- 15.1 Research Methodology
- 15.1.1 Methodology/Research Approach
- 15.1.2 Data Source
- 15.2 Author Details
- 15.3 Disclaimer
