|
|
市場調査レポート
商品コード
1297992
世界と米国のエコストーン(SPC)フローリング市場:予測(2023年~2029年)Global and United States Stone Plastic Composite (SPC) Flooring Market Report & Forecast 2023-2029 |
||||||
|
|
|||||||
カスタマイズ可能
適宜更新あり
|
|||||||


| 世界と米国のエコストーン(SPC)フローリング市場:予測(2023年~2029年) |
|
出版日: 2023年06月28日
発行: QYResearch
ページ情報: 英文 160 Pages
納期: 2~3営業日
|

- 全表示
- 概要
- 図表
- 目次
世界のエコストーン(SPC)フローリングの収益は、2022年に43億3,738万米ドルとなりました。
同市場は、レビュー期間(2023年~2029年)に6.56%のCAGRで拡大し、2029年までに55億8,586万米ドルになると予測されています。
米国では、石材プラスチック複合材(SPC)フローリングの売上高は、2022年の23億2,426万米ドルから2029年には26億9,895万米ドルに成長し、予測期間(2023年~2029年)のCAGRは5.47%になると予測されています。
当レポートでは、世界と米国のエコストーン(SPC)フローリング市場について調査し、市場の概要とともに、企業別、タイプ別、用途別、地域別の動向、および市場に参入する企業のプロファイルなどを提供しています。
目次
第1章 調査範囲
第2章 エコストーン(SPC)フローリング、タイプ別
- エコストーン(SPC)フローリング市場、タイプ別
- 世界のエコストーン(SPC)フローリング市場規模、タイプ別
- 米国のエコストーン(SPC)フローリング市場規模、タイプ別
第3章 エコストーン(SPC)フローリング、用途別
- エコストーン(SPC)フローリング市場、用途別
- 世界のエコストーン(SPC)フローリング市場規模、用途別
- 米国のエコストーン(SPC)フローリング市場規模、用途別
第4章 世界のエコストーン(SPC)フローリングの競合情勢、企業別
- 世界のエコストーン(SPC)フローリング市場規模、企業別
- 世界のエコストーン(SPC)フローリングの濃度
- エコストーン(SPC)フローリングの世界的主要メーカー、製造拠点、流通および本社
- エコストーン(SPC)フローリングの世界の主要メーカー、提供される製品と用途
- メーカーの合併・買収、拡張計画
- 米国の石材プラスチック複合材(SPC)フローリング市場規模(企業別)
第5章 世界のエコストーン(SPC)フローリング市場規模、地域別
第6章 南北アメリカ
第7章 EMEA
第8章 中国
第9章 アジア太平洋
第10章 企業プロファイル
- Tianzhen Bamboo Flooring
- Zhejiang Walrus New Material
- CFL Flooring
- Zhejiang Kingdom
- Novalis
- Zhejiang GIMIG Technology
- Mohawk
- Taizhou Huali New Materials
- Decno Group
- Mannington Mills
- Zhejiang Hailide New Material
- Snmo LVT
- Armstrong Flooring
第11章 産業チェーンと販売チャネルの分析
- エコストーン(SPC)フローリング産業チェーン分析
- エコストーン(SPC)フローリングの主な原材料
- エコストーン(SPC)フローリングの製造モードとプロセス
- エコストーン(SPC)フローリングの販売およびマーケティング
- エコストーン(SPC)フローリングの顧客
第12章 調査結果と結論
第13章 付録
List of Tables
- Table 1. Stone Plastic Composite (SPC) Flooring CAGR in Value, United States VS Global, 2018 VS 2023 VS 2029
- Table 2. Stone Plastic Composite (SPC) Flooring Market Trends
- Table 3. Stone Plastic Composite (SPC) Flooring Market Drivers
- Table 4. Stone Plastic Composite (SPC) Flooring Market Challenges
- Table 5. Global Stone Plastic Composite (SPC) Flooring Sales Growth Rate (CAGR) by Type: 2018 VS 2023 VS 2029 (US$ Million)
- Table 6. Global Stone Plastic Composite (SPC) Flooring Sales in Value by Type (2018-2023) & (US$ Million)
- Table 7. Global Stone Plastic Composite (SPC) Flooring Sales in Value by Type (2024-2029) & (US$ Million)
- Table 8. Global Stone Plastic Composite (SPC) Flooring Sales by Type (2018-2023) & (K Sq.m)
- Table 9. Global Stone Plastic Composite (SPC) Flooring Sales by Type (2024-2029) & (K Sq.m)
- Table 10. Global Stone Plastic Composite (SPC) Flooring Price by Type (2018-2023) & (USD/Sq.m)
- Table 11. Global Stone Plastic Composite (SPC) Flooring Price by Type (2024-2029) & (USD/Sq.m)
- Table 12. United States Stone Plastic Composite (SPC) Flooring Sales Growth Rate (CAGR) by Type: 2018 VS 2023 VS 2029 (US$ Million)
- Table 13. United States Stone Plastic Composite (SPC) Flooring Sales in Value by Type (2018-2023) & (US$ Million)
- Table 14. United States Stone Plastic Composite (SPC) Flooring Sales in Value by Type (2024-2029) & (US$ Million)
- Table 15. United States Stone Plastic Composite (SPC) Flooring Sales by Type (2018-2023) & (K Sq.m)
- Table 16. United States Stone Plastic Composite (SPC) Flooring Sales by Type (2024-2029) & (K Sq.m)
- Table 17. United States Stone Plastic Composite (SPC) Flooring Price by Type (2018-2023) & (USD/Sq.m)
- Table 18. United States Stone Plastic Composite (SPC) Flooring Price by Type (2024-2029) & (USD/Sq.m)
- Table 19. Global Stone Plastic Composite (SPC) Flooring Sales Growth Rate (CAGR) by Application: 2018 VS 2023 VS 2029 (US$ Million)
- Table 20. Global Stone Plastic Composite (SPC) Flooring Sales in Value by Application (2018-2023) & (US$ Million)
- Table 21. Global Stone Plastic Composite (SPC) Flooring Sales in Value by Application (2024-2029) & (US$ Million)
- Table 22. Global Stone Plastic Composite (SPC) Flooring Sales by Application (2018-2023) & (K Sq.m)
- Table 23. Global Stone Plastic Composite (SPC) Flooring Sales by Application (2024-2029) & (K Sq.m)
- Table 24. Global Stone Plastic Composite (SPC) Flooring Price by Application (2018-2023) & (USD/Sq.m)
- Table 25. Global Stone Plastic Composite (SPC) Flooring Price by Application (2024-2029) & (USD/Sq.m)
- Table 26. United States Stone Plastic Composite (SPC) Flooring Sales Growth Rate (CAGR) by Application: 2018 VS 2023 VS 2029 (US$ Million)
- Table 27. United States Stone Plastic Composite (SPC) Flooring Sales in Value by Application (2018-2023) & (US$ Million)
- Table 28. United States Stone Plastic Composite (SPC) Flooring Sales in Value by Application (2024-2029) & (US$ Million)
- Table 29. United States Stone Plastic Composite (SPC) Flooring Sales by Application (2018-2023) & (K Sq.m)
- Table 30. United States Stone Plastic Composite (SPC) Flooring Sales by Application (2024-2029) & (K Sq.m)
- Table 31. United States Stone Plastic Composite (SPC) Flooring Price by Application (2018-2023) & (USD/Sq.m)
- Table 32. United States Stone Plastic Composite (SPC) Flooring Price by Application (2024-2029) & (USD/Sq.m)
- Table 33. Global Key Manufacturers of Stone Plastic Composite (SPC) Flooring, Ranked by Revenue (2022) & (US$ Million)
- Table 34. Global Stone Plastic Composite (SPC) Flooring Revenue by Manufacturer, (US$ Million) & (2018-2023)
- Table 35. Global Stone Plastic Composite (SPC) Flooring Revenue Share by Manufacturer, 2018-2023
- Table 36. Global Stone Plastic Composite (SPC) Flooring Sales by Manufacturer, (K Sq.m), 2018-2023
- Table 37. Global Stone Plastic Composite (SPC) Flooring Sales Share by Manufacturer, 2018-2023
- Table 38. Global Stone Plastic Composite (SPC) Flooring Price by Manufacturer (2018-2023) & (USD/Sq.m)
- Table 39. Global Stone Plastic Composite (SPC) Flooring by Company Type (Tier 1, Tier 2, and Tier 3) & (based on the Revenue in Stone Plastic Composite (SPC) Flooring as of 2022)
- Table 40. Global Key Manufacturers of Stone Plastic Composite (SPC) Flooring, Manufacturing Base Distribution and Headquarters
- Table 41. Global Key Manufacturers of Stone Plastic Composite (SPC) Flooring, Product Offered and Application
- Table 42. Manufacturers Mergers & Acquisitions, Expansion Plans
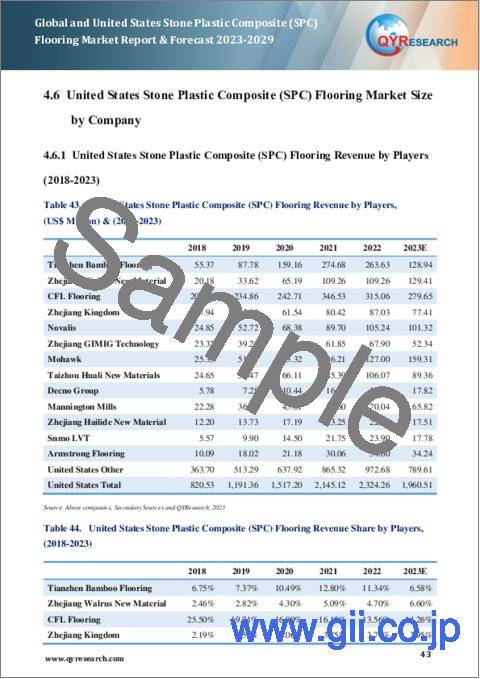
- Table 43. United States Stone Plastic Composite (SPC) Flooring Revenue by Players, (US$ Million) & (2018-2023)
- Table 44. United States Stone Plastic Composite (SPC) Flooring Revenue Share by Players, (2018-2023)
- Table 45. United States Stone Plastic Composite (SPC) Flooring Sales by Players, (K Sq.m) & (2018-2023)
- Table 46. United States Stone Plastic Composite (SPC) Flooring Sales Share by Players, (2018-2023)
- Table 47. Global Stone Plastic Composite (SPC) Flooring Market Size Growth Rate (CAGR) by Region (US$ Million): 2018 VS 2023 VS 2029
- Table 48. Global Stone Plastic Composite (SPC) Flooring Sales in Volume by Region (2018-2023) & (K Sq.m)
- Table 49. Global Stone Plastic Composite (SPC) Flooring Sales in Volume Forecast by Region (2023-2029) & (K Sq.m)
- Table 50. Global Stone Plastic Composite (SPC) Flooring Sales in Value by Region (2018-2023) & (US$ Million)
- Table 51. Global Stone Plastic Composite (SPC) Flooring Sales in Value Forecast by Region (2023-2029) & (US$ Million)
- Table 52. Americas Stone Plastic Composite (SPC) Flooring Sales by Type (2018-2023) & (K Sq.m)
- Table 53. Americas Stone Plastic Composite (SPC) Flooring Sales by Type (2024-2029) & (K Sq.m)
- Table 54. Americas Stone Plastic Composite (SPC) Flooring Sales by Application (2018-2023) & (K Sq.m)
- Table 55. Americas Stone Plastic Composite (SPC) Flooring Sales by Application (2024-2029) & (K Sq.m)
- Table 56. Americas Stone Plastic Composite (SPC) Flooring Market Size Growth Rate (CAGR) by Country (US$ Million): 2018 VS 2023 VS 2029
- Table 57. Americas Stone Plastic Composite (SPC) Flooring Sales in Value by Country (2018-2023) & (US$ Million)
- Table 58. Americas Stone Plastic Composite (SPC) Flooring Sales in Value by Country (2024-2029) & (US$ Million)
- Table 59. Americas Stone Plastic Composite (SPC) Flooring Sales in Volume by Country (2018-2023) & (K Sq.m)
- Table 60. Americas Stone Plastic Composite (SPC) Flooring Sales in Volume by Country (2024-2029) & (K Sq.m)
- Table 61. EMEA Stone Plastic Composite (SPC) Flooring Sales by Type (2018-2023) & (K Sq.m)
- Table 62. EMEA Stone Plastic Composite (SPC) Flooring Sales by Type (2024-2029) & (K Sq.m)
- Table 63. EMEA Stone Plastic Composite (SPC) Flooring Sales by Application (2018-2023) & (K Sq.m)
- Table 64. EMEA Stone Plastic Composite (SPC) Flooring Sales by Application (2024-2029) & (K Sq.m)
- Table 65. EMEA Stone Plastic Composite (SPC) Flooring Market Size Growth Rate (CAGR) by Country (US$ Million): 2018 VS 2023 VS 2029
- Table 66. EMEA Stone Plastic Composite (SPC) Flooring Sales in Value by Country (2018-2023) & (US$ Million)
- Table 67. EMEA Stone Plastic Composite (SPC) Flooring Sales in Value by Country (2024-2029) & (US$ Million)
- Table 68. EMEA Stone Plastic Composite (SPC) Flooring Sales in Volume by Country (2018-2023) & (K Sq.m)
- Table 69. EMEA Stone Plastic Composite (SPC) Flooring Sales in Volume by Country (2024-2029) & (K Sq.m)
- Table 70. China Stone Plastic Composite (SPC) Flooring Sales by Type (2018-2023) & (K Sq.m)
- Table 71. China Stone Plastic Composite (SPC) Flooring Sales by Type (2024-2029) & (K Sq.m)
- Table 72. China Stone Plastic Composite (SPC) Flooring Sales by Application (2018-2023) & (K Sq.m)
- Table 73. China Stone Plastic Composite (SPC) Flooring Sales by Application (2024-2029) & (K Sq.m)
- Table 74. APAC Stone Plastic Composite (SPC) Flooring Sales by Type (2018-2023) & (K Sq.m)
- Table 75. APAC Stone Plastic Composite (SPC) Flooring Sales by Type (2024-2029) & (K Sq.m)
- Table 76. APAC Stone Plastic Composite (SPC) Flooring Sales by Application (2018-2023) & (K Sq.m)
- Table 77. APAC Stone Plastic Composite (SPC) Flooring Sales by Application (2024-2029) & (K Sq.m)
- Table 78. APAC Stone Plastic Composite (SPC) Flooring Market Size Growth Rate (CAGR) by Country (US$ Million): 2018 VS 2023 VS 2029
- Table 79. APAC Stone Plastic Composite (SPC) Flooring Sales in Value by Country (2018-2023) & (US$ Million)
- Table 80. APAC Stone Plastic Composite (SPC) Flooring Sales in Value by Country (2024-2029) & (US$ Million)
- Table 81. APAC Stone Plastic Composite (SPC) Flooring Sales in Volume by Country (2018-2023) & (K Sq.m)
- Table 82. APAC Stone Plastic Composite (SPC) Flooring Sales in Volume by Country (2024-2029) & (K Sq.m)
- Table 83. Tianzhen Bamboo Flooring Corporation Information
- Table 84. Tianzhen Bamboo Flooring Description and Major Businesses
- Table 85. Tianzhen Bamboo Flooring Stone Plastic Composite (SPC) Flooring Sales (K Sq.m), Revenue (US$ Million), Price (USD/Sq.m) and Gross Margin (2018-2023)
- Table 86. Tianzhen Bamboo Flooring Stone Plastic Composite (SPC) Flooring Product Model Numbers, Pictures, Descriptions and Specifications
- Table 87. Zhejiang Walrus New Material Corporation Information
- Table 88. Zhejiang Walrus New Material Description and Major Businesses
- Table 89. Zhejiang Walrus New Material Stone Plastic Composite (SPC) Flooring Sales (K Sq.m), Revenue (US$ Million), Price (USD/Sq.m) and Gross Margin (2018-2023)
- Table 90. Zhejiang Walrus New Material Stone Plastic Composite (SPC) Flooring Product Model Numbers, Pictures, Descriptions and Specifications
- Table 91. CFL Flooring Corporation Information
- Table 92. CFL Flooring Description and Major Businesses
- Table 93. CFL Flooring Stone Plastic Composite (SPC) Flooring Sales (K Sq.m), Revenue (US$ Million), Price (USD/Sq.m) and Gross Margin (2018-2023)
- Table 94. CFL Flooring Stone Plastic Composite (SPC) Flooring Product Model Numbers, Pictures, Descriptions and Specifications
- Table 95. Zhejiang Kingdom Corporation Information
- Table 96. Zhejiang Kingdom Description and Major Businesses
- Table 97. Zhejiang Kingdom Stone Plastic Composite (SPC) Flooring Sales (K Sq.m), Revenue (US$ Million), Price (USD/Sq.m) and Gross Margin (2018-2023)
- Table 98. Zhejiang Kingdom Stone Plastic Composite (SPC) Flooring Product Model Numbers, Pictures, Descriptions and Specifications
- Table 99. Novalis Corporation Information
- Table 100. Novalis Description and Major Businesses
- Table 101. Novalis Stone Plastic Composite (SPC) Flooring Sales (K Sq.m), Revenue (US$ Million), Price (USD/Sq.m) and Gross Margin (2018-2023)
- Table 102. Novalis Stone Plastic Composite (SPC) Flooring Product Model Numbers, Pictures, Descriptions and Specifications
- Table 103. Zhejiang GIMIG Technology Corporation Information
- Table 104. Zhejiang GIMIG Technology Description and Major Businesses
- Table 105. Zhejiang GIMIG Technology Stone Plastic Composite (SPC) Flooring Sales (K Sq.m), Revenue (US$ Million), Price (USD/Sq.m) and Gross Margin (2018-2023)
- Table 106. Zhejiang GIMIG Technology Stone Plastic Composite (SPC) Flooring Product Model Numbers, Pictures, Descriptions and Specifications
- Table 107. Mohawk Corporation Information
- Table 108. Mohawk Description and Major Businesses
- Table 109. Mohawk Stone Plastic Composite (SPC) Flooring Sales (K Sq.m), Revenue (US$ Million), Price (USD/Sq.m) and Gross Margin (2018-2023)
- Table 110. Mohawk Stone Plastic Composite (SPC) Flooring Product Model Numbers, Pictures, Descriptions and Specifications
- Table 111. Taizhou Huali New Materials Corporation Information
- Table 112. Taizhou Huali New Materials Description and Major Businesses
- Table 113. Taizhou Huali New Materials Stone Plastic Composite (SPC) Flooring Sales (K Sq.m), Revenue (US$ Million), Price (USD/Sq.m) and Gross Margin (2018-2023)
- Table 114. Taizhou Huali New Materials Stone Plastic Composite (SPC) Flooring Product Model Numbers, Pictures, Descriptions and Specifications
- Table 115. Decno Group Corporation Information
- Table 116. Decno Group Description and Major Businesses
- Table 117. Decno Group Stone Plastic Composite (SPC) Flooring Sales (K Sq.m), Revenue (US$ Million), Price (USD/Sq.m) and Gross Margin (2018-2023)
- Table 118. Decno Group Stone Plastic Composite (SPC) Flooring Product Model Numbers, Pictures, Descriptions and Specifications
- Table 119. Mannington Mills Corporation Information
- Table 120. Mannington Mills Description and Major Businesses
- Table 121. Mannington Mills Stone Plastic Composite (SPC) Flooring Sales (K Sq.m), Revenue (US$ Million), Price (USD/Sq.m) and Gross Margin (2018-2023)
- Table 122. Mannington Mills Stone Plastic Composite (SPC) Flooring Product Model Numbers, Pictures, Descriptions and Specifications
- Table 123. Zhejiang Hailide New Material Corporation Information
- Table 124. Zhejiang Hailide New Material Description and Major Businesses
- Table 125. Zhejiang Hailide New Material Stone Plastic Composite (SPC) Flooring Sales (K Sq.m), Revenue (US$ Million), Price (USD/Sq.m) and Gross Margin (2018-2023)
- Table 126. Zhejiang Hailide New Material Stone Plastic Composite (SPC) Flooring Product Model Numbers, Pictures, Descriptions and Specifications
- Table 127. Snmo LVT Corporation Information
- Table 128. Snmo LVT Description and Major Businesses
- Table 129. Snmo LVT Stone Plastic Composite (SPC) Flooring Sales (K Sq.m), Revenue (US$ Million), Price (USD/Sq.m) and Gross Margin (2018-2023)
- Table 130. Snmo LVT Stone Plastic Composite (SPC) Flooring Product Model Numbers, Pictures, Descriptions and Specifications
- Table 131. Armstrong Flooring Corporation Information
- Table 132. Armstrong Flooring Description and Major Businesses
- Table 133. Armstrong Flooring Stone Plastic Composite (SPC) Flooring Sales (K Sq.m), Revenue (US$ Million), Price (USD/Sq.m) and Gross Margin (2018-2023)
- Table 134. Armstrong Flooring Stone Plastic Composite (SPC) Flooring Product Model Numbers, Pictures, Descriptions and Specifications
- Table 135. Key Raw Materials Lists
- Table 136. Raw Materials Key Suppliers Lists
- Table 137. Stone Plastic Composite (SPC) Flooring Distributors List
- Table 138. Stone Plastic Composite (SPC) Flooring Customers List
- Table 139. Research Programs/Design for This Report
- Table 140. Key Data Information from Secondary Sources
- Table 141. Key Data Information from Primary Sources
- Table 142. QYR Business Unit and Senior & Team Lead Analysts
List of Figures
- Figure 1. Stone Plastic Composite (SPC) Flooring Product Picture
- Figure 2. Global Stone Plastic Composite (SPC) Flooring Revenue, (US$ Million), 2018 VS 2023 VS 2029
- Figure 3. Global Stone Plastic Composite (SPC) Flooring Market Size 2018-2029 (US$ Million)
- Figure 4. Global Stone Plastic Composite (SPC) Flooring Sales 2018-2029 (K Sq.m)
- Figure 5. United States Stone Plastic Composite (SPC) Flooring Revenue, (US$ Million), 2018 VS 2023 VS 2029
- Figure 6. United States Stone Plastic Composite (SPC) Flooring Market Size 2018-2029 (US$ Million)
- Figure 7. United States Stone Plastic Composite (SPC) Flooring Sales 2018-2029 (K Sq.m)
- Figure 8. United States Stone Plastic Composite (SPC) Flooring Market Share in Global, in Value (US$ Million) 2018-2029
- Figure 9. United States Stone Plastic Composite (SPC) Flooring Market Share in Global, in Volume (K Sq.m) 2018-2029
- Figure 10. Stone Plastic Composite (SPC) Flooring Report Years Considered
- Figure 11. Global Stone Plastic Composite (SPC) Flooring Market Share by Type in 2022 & 2029
- Figure 12. Global Stone Plastic Composite (SPC) Flooring Sales Market Share in Value by Type (2018-2029)
- Figure 13. Global Stone Plastic Composite (SPC) Flooring Sales Market Share in Volume by Type (2018-2029)
- Figure 14. United States Stone Plastic Composite (SPC) Flooring Market Share by Type in 2022 & 2029
- Figure 15. United States Stone Plastic Composite (SPC) Flooring Sales Market Share in Value by Type (2018-2029)
- Figure 16. United States Stone Plastic Composite (SPC) Flooring Sales Market Share in Volume by Type (2018-2029)
- Figure 17. Residential Use
- Figure 18. Commercial
- Figure 19. Global Stone Plastic Composite (SPC) Flooring Market Share by Application in 2022 & 2029
- Figure 20. Global Stone Plastic Composite (SPC) Flooring Sales Market Share in Value by Application (2018-2029)
- Figure 21. Global Stone Plastic Composite (SPC) Flooring Sales Market Share in Volume by Application (2018-2029)
- Figure 22. United States Stone Plastic Composite (SPC) Flooring Market Share by Application in 2022 & 2029
- Figure 23. United States Stone Plastic Composite (SPC) Flooring Sales Market Share in Value by Application (2018-2029)
- Figure 24. United States Stone Plastic Composite (SPC) Flooring Sales Market Share in Volume by Application (2018-2029)
- Figure 25. The Top 5 Largest Manufacturers of Stone Plastic Composite (SPC) Flooring in the World: Market Share by Stone Plastic Composite (SPC) Flooring Revenue in 2022
- Figure 26. Global Stone Plastic Composite (SPC) Flooring Market Size Market Share by Region: 2018 VS 2023 VS 2029
- Figure 27. Global Stone Plastic Composite (SPC) Flooring Sales in Volume Market Share by Region (2018-2029)
- Figure 28. Global Stone Plastic Composite (SPC) Flooring Sales in Value Market Share by Region (2018-2029)
- Figure 29. Americas Stone Plastic Composite (SPC) Flooring Sales in Volume Growth Rate 2018-2029 (K Sq.m)
- Figure 30. Americas Stone Plastic Composite (SPC) Flooring Sales in Value Growth Rate 2018-2029 (US$ Million)
- Figure 31. Americas Stone Plastic Composite (SPC) Flooring Sales Market Share in Volume by Type (2018-2029)
- Figure 32. Americas Stone Plastic Composite (SPC) Flooring Sales Market Share in Volume by Application (2018-2029)
- Figure 33. United States Stone Plastic Composite (SPC) Flooring Sales in Value Growth Rate (2018-2029) & (US$ Million)
- Figure 34. Canada Stone Plastic Composite (SPC) Flooring Sales in Value Growth Rate (2018-2029) & (US$ Million)
- Figure 35. Mexico Stone Plastic Composite (SPC) Flooring Sales in Value Growth Rate (2018-2029) & (US$ Million)
- Figure 36. Brazil Stone Plastic Composite (SPC) Flooring Sales in Value Growth Rate (2018-2029) & (US$ Million)
- Figure 37. Argentina Stone Plastic Composite (SPC) Flooring Sales in Value Growth Rate (2018-2029) & (US$ Million)
- Figure 38. EMEA Stone Plastic Composite (SPC) Flooring Sales in Volume Growth Rate 2018-2029 (K Sq.m)
- Figure 39. EMEA Stone Plastic Composite (SPC) Flooring Sales in Value Growth Rate 2018-2029 (US$ Million)
- Figure 40. EMEA Stone Plastic Composite (SPC) Flooring Sales Market Share in Volume by Type (2018-2029)
- Figure 41. EMEA Stone Plastic Composite (SPC) Flooring Sales Market Share in Volume by Application (2018-2029)
- Figure 42. Germany Stone Plastic Composite (SPC) Flooring Sales in Value Growth Rate (2018-2029) & (US$ Million)
- Figure 43. UK Stone Plastic Composite (SPC) Flooring Sales in Value Growth Rate (2018-2029) & (US$ Million)
- Figure 44. France Stone Plastic Composite (SPC) Flooring Sales in Value Growth Rate (2018-2029) & (US$ Million)
- Figure 45. Italy Stone Plastic Composite (SPC) Flooring Sales in Value Growth Rate (2018-2029) & (US$ Million)
- Figure 46. Spain Stone Plastic Composite (SPC) Flooring Sales in Value Growth Rate (2018-2029) & (US$ Million)
- Figure 47. Saudi Arabia Stone Plastic Composite (SPC) Flooring Sales in Value Growth Rate (2018-2029) & (US$ Million)
- Figure 48. Turkey Stone Plastic Composite (SPC) Flooring Sales in Value Growth Rate (2018-2029) & (US$ Million)
- Figure 49. South Africa Stone Plastic Composite (SPC) Flooring Sales in Value Growth Rate (2018-2029) & (US$ Million)
- Figure 50. China Stone Plastic Composite (SPC) Flooring Sales in Volume Growth Rate 2018-2029 (K Sq.m)
- Figure 51. China Stone Plastic Composite (SPC) Flooring Sales in Value Growth Rate 2018-2029 (US$ Million)
- Figure 52. China Stone Plastic Composite (SPC) Flooring Sales Market Share in Volume by Type (2018-2029)
- Figure 53. China Stone Plastic Composite (SPC) Flooring Sales Market Share in Volume by Application (2018-2029)
- Figure 54. APAC Stone Plastic Composite (SPC) Flooring Sales in Volume Growth Rate 2018-2029 (K Sq.m)
- Figure 55. APAC Stone Plastic Composite (SPC) Flooring Sales in Value Growth Rate 2018-2029 (US$ Million)
- Figure 56. APAC Stone Plastic Composite (SPC) Flooring Sales Market Share in Volume by Type (2018-2029)
- Figure 57. APAC Stone Plastic Composite (SPC) Flooring Sales Market Share in Volume by Application (2018-2029)
- Figure 58. Japan Stone Plastic Composite (SPC) Flooring Sales in Value Growth Rate (2018-2029) & (US$ Million)
- Figure 59. South Korea Stone Plastic Composite (SPC) Flooring Sales in Value Growth Rate (2018-2029) & (US$ Million)
- Figure 60. Southeast Asia Stone Plastic Composite (SPC) Flooring Sales in Value Growth Rate (2018-2029) & (US$ Million)
- Figure 61. India Stone Plastic Composite (SPC) Flooring Sales in Value Growth Rate (2018-2029) & (US$ Million)
- Figure 62. Australia Stone Plastic Composite (SPC) Flooring Sales in Value Growth Rate (2018-2029) & (US$ Million)
- Figure 63. Stone Plastic Composite (SPC) Flooring Value Chain
- Figure 64. Stone Plastic Composite (SPC) Flooring Production Process
- Figure 65. Channels of Distribution
- Figure 66. Distributors Profiles
- Figure 67. Bottom-up and Top-down Approaches for This Report
- Figure 68. Data Triangulation
- Figure 69. Key Executives Interviewed
Market Analysis and Insights:
This report focuses on global and United States Stone Plastic Composite (SPC) Flooring market, also covers the segmentation data of other regions in regional level and county level.
The global Stone Plastic Composite (SPC) Flooring revenue was US$ 4,337.38 million in 2022 and is forecast to a readjusted size of US$ 5,585.86 million by 2029 with a CAGR of 6.56% during the review period (2023-2029).
In United States the Stone Plastic Composite (SPC) Flooring revenue is expected to grow from US$ 2,324.26 million in 2022 to US$ 2,698.95 million by 2029, at a CAGR of 5.47% during the forecast period (2023-2029).
The global key players of Stone Plastic Composite (SPC) Flooring include: Tianzhen Bamboo Flooring, Zhejiang Walrus New Material, CFL Flooring, Zhejiang Kingdom, Novalis, Zhejiang GIMIG Technology, Mohawk, Taizhou Huali New Materials, and Decno Group, etc. The global five biggest players hold a share of 30.69% in 2022.
Scope and Market Size:
Stone Plastic Composite (SPC) Flooring market is segmented in regional and country level, by players, by Type, and by Application. Companies, stakeholders, and other participants in the global Stone Plastic Composite (SPC) Flooring market will be able to gain the upper hand as they use the report as a powerful resource. The segmental analysis focuses on sales, revenue and forecast by Type and by Application for the period 2018-2029.
For United States market, this report focuses on the Stone Plastic Composite (SPC) Flooring market size by players, by Type, and by Application, for the period 2018-2029. The key players include the global and local players which play important roles in United States.
By Company
- Tianzhen Bamboo Flooring
- Zhejiang Walrus New Material
- CFL Flooring
- Zhejiang Kingdom
- Novalis
- Zhejiang GIMIG Technology
- Mohawk
- Taizhou Huali New Materials
- Decno Group
- Mannington Mills
- Zhejiang Hailide New Material
- Snmo LVT
- Armstrong Flooring
Segment by Type
- Recycled PVC Type
- Non-recycled PVC Type
Segment by Application
- Residential Use
- Commercial Use
By Region
- Americas
- United States
- Canada
- Mexico
- Brazil
- Argentina
- China
- APAC (excluding China)
- Japan
- Japan
- Korea
- India
- SEA
- Australia
- EMEA
- Africa
- Germany
- UK
- France
- Italy
- Spain
- Saudi Arabia
- Turkey
- South Africa
Chapter Introduction
- Chapter 1: Introduces Stone Plastic Composite (SPC) Flooring definition, global sales (volume and revenue), United States market size, United States percentage in global market. This section also introduces the market dynamics, latest developments of the market, the driving factors and restrictive factors of the market, the challenges and risks faced by companies in the industry, and the analysis of relevant policies in the industry.
- Chapter 2: Provides the analysis of various market segments by Type, covering the volume, price, revenue, and development potential of each market segment, to help readers find the blue ocean market in different market segments.
- Chapter 3: Provides the analysis of various market segments by Application, covering the revenue, price, volume, and development potential of each market segment, to help readers find the blue ocean market in different downstream markets.
- Chapter 4: Detailed analysis of Stone Plastic Composite (SPC) Flooring companies competitive landscape, revenue, market share and industry ranking, latest development plan, merger, and acquisition information, etc.
- Chapter 5: Revenue and volume of Stone Plastic Composite (SPC) Flooring in global and regional level. It provides a quantitative analysis of the market size and development potential of each region and introduces the market development, future development prospects, market space, and capacity of each country in the world.
- Chapter 6: Americas by Type, by Application and by country, sales, and revenue for each segment.
- Chapter 7: EMEA by Type, by Application and by region, sales, and revenue for each segment.
- Chapter 8: China by Type, and by Application, sales, and revenue for each segment.
- Chapter 9: APAC (excluding China) by Type, by Application and by region, sales, and revenue for each segment.
- Chapter 10: Provides profiles of key companies, introducing the basic situation of the main companies in the market in detail, including product descriptions and specifications, Stone Plastic Composite (SPC) Flooring sales, revenue, gross margin, and recent development, etc.
- Chapter 11: Analysis of industrial chain, sales channel, key raw materials, distributors, and customers.
- Chapter 12: research findings and conclusion
Table of Contents
1 Study Coverage
- 1.1 Stone Plastic Composite (SPC) Flooring Product Introduction
- 1.2 Global Stone Plastic Composite (SPC) Flooring Outlook 2018 VS 2023 VS 2029
- 1.2.1 Global Stone Plastic Composite (SPC) Flooring Sales in US$ Million for the Year 2018-2029
- 1.2.2 Global Stone Plastic Composite (SPC) Flooring Sales in Volume for the Year 2018-2029
- 1.3 United States Stone Plastic Composite (SPC) Flooring Outlook 2018 VS 2023 VS 2029
- 1.3.1 United States Stone Plastic Composite (SPC) Flooring Sales in US$ Million for the Year 2018-2029
- 1.3.2 United States Stone Plastic Composite (SPC) Flooring Sales in Volume for the Year 2018-2029
- 1.4 Stone Plastic Composite (SPC) Flooring Market Size, United States VS Global, 2018 VS 2023 VS 2029
- 1.4.1 The Market Share of United States Stone Plastic Composite (SPC) Flooring in Global, 2018 VS 2023 VS 2029
- 1.4.2 The Growth Rate of Stone Plastic Composite (SPC) Flooring Market Size, United States VS Global, 2018 VS 2023 VS 2029
- 1.5 Stone Plastic Composite (SPC) Flooring Market Dynamics
- 1.5.1 Stone Plastic Composite (SPC) Flooring Industry Trends
- 1.5.2 Stone Plastic Composite (SPC) Flooring Market Drivers
- 1.5.3 Stone Plastic Composite (SPC) Flooring Market Challenges
- 1.5.4 Stone Plastic Composite (SPC) Flooring Market Restraints
- 1.6 Assumptions and Limitations
- 1.7 Study Objectives
- 1.8 Years Considered
2 Stone Plastic Composite (SPC) Flooring by Type
- 2.1 Stone Plastic Composite (SPC) Flooring Market by Type
- 2.1.1 Recycled PVC Type
- 2.1.2 Non-recycled PVC Type
- 2.2 Global Stone Plastic Composite (SPC) Flooring Market Size by Type
- 2.2.1 Global Stone Plastic Composite (SPC) Flooring Sales in Value, by Type (2018, 2022 & 2029)
- 2.2.2 Global Stone Plastic Composite (SPC) Flooring Sales in Volume, by Type (2018, 2022 & 2029)
- 2.2.3 Global Stone Plastic Composite (SPC) Flooring Average Selling Price (ASP) by Type (2018, 2022 & 2029)
- 2.3 United States Stone Plastic Composite (SPC) Flooring Market Size by Type
- 2.3.1 United States Stone Plastic Composite (SPC) Flooring Sales in Value, by Type (2018, 2022 & 2029)
- 2.3.2 United States Stone Plastic Composite (SPC) Flooring Sales in Volume, by Type (2018, 2022 & 2029)
- 2.3.3 United States Stone Plastic Composite (SPC) Flooring Average Selling Price (ASP) by Type (2018, 2022 & 2029)
3 Stone Plastic Composite (SPC) Flooring by Application
- 3.1 Stone Plastic Composite (SPC) Flooring Market by Application
- 3.1.1 Residential Use
- 3.1.2 Commercial
- 3.2 Global Stone Plastic Composite (SPC) Flooring Market Size by Application
- 3.2.1 Global Stone Plastic Composite (SPC) Flooring Sales in Value, by Application (2018, 2022 & 2029)
- 3.2.2 Global Stone Plastic Composite (SPC) Flooring Sales in Volume, by Application (2018, 2022 & 2029)
- 3.2.3 Global Stone Plastic Composite (SPC) Flooring Average Selling Price (ASP) by Application (2018, 2022 & 2029)
- 3.3 United States Stone Plastic Composite (SPC) Flooring Market Size by Application
- 3.3.1 United States Stone Plastic Composite (SPC) Flooring Sales in Value, by Application (2018, 2022 & 2029)
- 3.3.2 United States Stone Plastic Composite (SPC) Flooring Sales in Volume, by Application (2018, 2022 & 2029)
- 3.3.3 United States Stone Plastic Composite (SPC) Flooring Average Selling Price (ASP) by Application (2018, 2022 & 2029)
4 Global Stone Plastic Composite (SPC) Flooring Competitor Landscape by Company
- 4.1 Global Stone Plastic Composite (SPC) Flooring Market Size by Company
- 4.1.1 Global Key Manufacturers of Stone Plastic Composite (SPC) Flooring, Ranked by Revenue (2022)
- 4.1.2 Global Stone Plastic Composite (SPC) Flooring Revenue by Manufacturer (2018-2023)
- 4.1.3 Global Stone Plastic Composite (SPC) Flooring Sales by Manufacturer (2018-2023)
- 4.1.4 Global Stone Plastic Composite (SPC) Flooring Price by Manufacturer (2018-2023)
- 4.2 Global Stone Plastic Composite (SPC) Flooring Concentration
- 4.2.1 Stone Plastic Composite (SPC) Flooring Market Concentration
- 4.2.2 Global Top 5 Largest Manufacturers of Stone Plastic Composite (SPC) Flooring in 2022
- 4.2.3 Global Stone Plastic Composite (SPC) Flooring Market Share by Company Type (Tier 1, Tier 2, and Tier 3)
- 4.3 Global Key Manufacturers of Stone Plastic Composite (SPC) Flooring, Manufacturing Base Distribution and Headquarters
- 4.4 Global Key Manufacturers of Stone Plastic Composite (SPC) Flooring, Product Offered and Application
- 4.5 Manufacturers Mergers & Acquisitions, Expansion Plans
- 4.6 United States Stone Plastic Composite (SPC) Flooring Market Size by Company
- 4.6.1 United States Stone Plastic Composite (SPC) Flooring Revenue by Players (2018-2023)
- 4.6.2 United States Stone Plastic Composite (SPC) Flooring Sales by Players (2018-2023)
5 Global Stone Plastic Composite (SPC) Flooring Market Size by Region
- 5.1 Global Stone Plastic Composite (SPC) Flooring Market Size by Region: 2018 VS 2023 VS 2029
- 5.2 Global Stone Plastic Composite (SPC) Flooring Market Size in Volume by Region (2018-2029)
- 5.2.1 Global Stone Plastic Composite (SPC) Flooring Sales in Volume by Region: 2018-2023
- 5.2.2 Global Stone Plastic Composite (SPC) Flooring Sales in Volume Forecast by Region (2023-2029)
- 5.3 Global Stone Plastic Composite (SPC) Flooring Market Size in Value by Region (2018-2029)
- 5.3.1 Global Stone Plastic Composite (SPC) Flooring Sales in Value by Region: 2018-2023
- 5.3.2 Global Stone Plastic Composite (SPC) Flooring Sales in Value by Region: 2023-2029
6 Americas
- 6.1 Americas Stone Plastic Composite (SPC) Flooring Market Size YoY Growth 2018-2029
- 6.2 Americas Stone Plastic Composite (SPC) Flooring Sales in Volume, by Type (2018, 2022 & 2029)
- 6.3 Americas Stone Plastic Composite (SPC) Flooring Sales in Volume, by Application (2018, 2022 & 2029)
- 6.4 Americas Stone Plastic Composite (SPC) Flooring Market Facts & Figures by Country (2018, 2022 & 2029)
- 6.4.1 Americas Stone Plastic Composite (SPC) Flooring Sales in Value by Country (2018, 2022 & 2029)
- 6.4.2 Americas Stone Plastic Composite (SPC) Flooring Sales in Volume by Country (2018, 2022 & 2029)
- 6.4.3 United States
- 6.4.4 Canada
- 6.4.5 Mexico
- 6.4.6 Brazil
- 6.4.7 Argentina
7 EMEA
- 7.1 EMEA Stone Plastic Composite (SPC) Flooring Market Size YoY Growth 2018-2029
- 7.2 EMEA Stone Plastic Composite (SPC) Flooring Sales in Volume, by Type (2018, 2022 & 2029)
- 7.3 EMEA Stone Plastic Composite (SPC) Flooring Sales in Volume, by Application (2018, 2022 & 2029)
- 7.4 EMEA Stone Plastic Composite (SPC) Flooring Market Facts & Figures by Country (2018, 2022 & 2029)
- 7.4.1 EMEA Stone Plastic Composite (SPC) Flooring Sales in Value by Country (2018, 2022 & 2029)
- 7.4.2 EMEA Stone Plastic Composite (SPC) Flooring Sales in Volume by Country (2018, 2022 & 2029)
- 7.4.3 Germany
- 7.4.4 UK
- 7.4.5 France
- 7.4.6 Italy
- 7.4.7 Spain
- 7.4.8 Saudi Arabia
- 7.4.9 Turkey
- 7.4.10 South Africa
8 China
- 8.1 China Stone Plastic Composite (SPC) Flooring Market Size YoY Growth 2018-2029
- 8.2 China Stone Plastic Composite (SPC) Flooring Sales in Volume, by Type (2018, 2022 & 2029)
- 8.3 China Stone Plastic Composite (SPC) Flooring Sales in Volume, by Application (2018, 2022 & 2029)
9 APAC
- 9.1 APAC Stone Plastic Composite (SPC) Flooring Market Size YoY Growth 2018-2029
- 9.2 APAC Stone Plastic Composite (SPC) Flooring Sales in Volume, by Type (2018, 2022 & 2029)
- 9.3 APAC Stone Plastic Composite (SPC) Flooring Sales in Volume, by Application (2018, 2022 & 2029)
- 9.4 APAC Stone Plastic Composite (SPC) Flooring Market Facts & Figures by Country (2018, 2022 & 2029)
- 9.4.1 APAC Stone Plastic Composite (SPC) Flooring Sales in Value by Country (2018, 2022 & 2029)
- 9.4.2 APAC Stone Plastic Composite (SPC) Flooring Sales in Volume by Country (2018, 2022 & 2029)
- 9.4.3 Japan
- 9.4.4 South Korea
- 9.4.5 Southeast Asia
- 9.4.6 India
- 9.4.7 Australia
10 Company Profiles
- 10.1 Tianzhen Bamboo Flooring
- 10.1.1 Tianzhen Bamboo Flooring Corporation Information
- 10.1.2 Tianzhen Bamboo Flooring Overview
- 10.1.3 Tianzhen Bamboo Flooring Stone Plastic Composite (SPC) Flooring Sales, Revenue and Gross Margin (2018-2023)
- 10.1.4 Tianzhen Bamboo Flooring Stone Plastic Composite (SPC) Flooring Product Model Numbers, Pictures, Descriptions and Specifications
- 10.2 Zhejiang Walrus New Material
- 10.2.1 Zhejiang Walrus New Material Corporation Information
- 10.2.2 Zhejiang Walrus New Material Overview
- 10.2.3 Zhejiang Walrus New Material Stone Plastic Composite (SPC) Flooring Sales, Revenue and Gross Margin (2018-2023)
- 10.2.4 Zhejiang Walrus New Material Stone Plastic Composite (SPC) Flooring Product Model Numbers, Pictures, Descriptions and Specifications
- 10.3 CFL Flooring
- 10.3.1 CFL Flooring Corporation Information
- 10.3.2 CFL Flooring Overview
- 10.3.3 CFL Flooring Stone Plastic Composite (SPC) Flooring Sales, Revenue and Gross Margin (2018-2023)
- 10.3.4 CFL Flooring Stone Plastic Composite (SPC) Flooring Product Model Numbers, Pictures, Descriptions and Specifications
- 10.4 Zhejiang Kingdom
- 10.4.1 Zhejiang Kingdom Corporation Information
- 10.4.2 Zhejiang Kingdom Overview
- 10.4.3 Zhejiang Kingdom Stone Plastic Composite (SPC) Flooring Sales, Revenue and Gross Margin (2018-2023)
- 10.4.4 Zhejiang Kingdom Stone Plastic Composite (SPC) Flooring Product Model Numbers, Pictures, Descriptions and Specifications
- 10.5 Novalis
- 10.5.1 Novalis Corporation Information
- 10.5.2 Novalis Overview
- 10.5.3 Novalis Stone Plastic Composite (SPC) Flooring Sales, Revenue and Gross Margin (2018-2023)
- 10.5.4 Novalis Stone Plastic Composite (SPC) Flooring Product Model Numbers, Pictures, Descriptions and Specifications
- 10.6 Zhejiang GIMIG Technology
- 10.6.1 Zhejiang GIMIG Technology Corporation Information
- 10.6.2 Zhejiang GIMIG Technology Overview
- 10.6.3 Zhejiang GIMIG Technology Stone Plastic Composite (SPC) Flooring Sales, Revenue and Gross Margin (2018-2023)
- 10.6.4 Zhejiang GIMIG Technology Stone Plastic Composite (SPC) Flooring Product Model Numbers, Pictures, Descriptions and Specifications
- 10.7 Mohawk
- 10.7.1 Mohawk Corporation Information
- 10.7.2 Mohawk Overview
- 10.7.3 Mohawk Stone Plastic Composite (SPC) Flooring Sales, Revenue and Gross Margin (2018-2023)
- 10.7.4 Mohawk Stone Plastic Composite (SPC) Flooring Product Model Numbers, Pictures, Descriptions and Specifications
- 10.8 Taizhou Huali New Materials
- 10.8.1 Taizhou Huali New Materials Corporation Information
- 10.8.2 Taizhou Huali New Materials Overview
- 10.8.3 Taizhou Huali New Materials Stone Plastic Composite (SPC) Flooring Sales, Revenue and Gross Margin (2018-2023)
- 10.8.4 Taizhou Huali New Materials Stone Plastic Composite (SPC) Flooring Product Model Numbers, Pictures, Descriptions and Specifications
- 10.9 Decno Group
- 10.9.1 Decno Group Corporation Information
- 10.9.2 Decno Group Overview
- 10.9.3 Decno Group Stone Plastic Composite (SPC) Flooring Sales, Revenue and Gross Margin (2018-2023)
- 10.9.4 Decno Group Stone Plastic Composite (SPC) Flooring Product Model Numbers, Pictures, Descriptions and Specifications
- 10.10 Mannington Mills
- 10.10.1 Mannington Mills Corporation Information
- 10.10.2 Mannington Mills Overview
- 10.10.3 Mannington Mills Stone Plastic Composite (SPC) Flooring Sales, Revenue and Gross Margin (2018-2023)
- 10.10.4 Mannington Mills Stone Plastic Composite (SPC) Flooring Product Model Numbers, Pictures, Descriptions and Specifications
- 10.11 Zhejiang Hailide New Material
- 10.11.1 Zhejiang Hailide New Material Corporation Information
- 10.11.2 Zhejiang Hailide New Material Overview
- 10.11.3 Zhejiang Hailide New Material Stone Plastic Composite (SPC) Flooring Sales, Revenue and Gross Margin (2018-2023)
- 10.11.4 Zhejiang Hailide New Material Stone Plastic Composite (SPC) Flooring Product Model Numbers, Pictures, Descriptions and Specifications
- 10.12 Snmo LVT
- 10.12.1 Snmo LVT Corporation Information
- 10.12.2 Snmo LVT Overview
- 10.12.3 Snmo LVT Stone Plastic Composite (SPC) Flooring Sales, Revenue and Gross Margin (2018-2023)
- 10.12.4 Snmo LVT Stone Plastic Composite (SPC) Flooring Product Model Numbers, Pictures, Descriptions and Specifications
- 10.13 Armstrong Flooring
- 10.13.1 Armstrong Flooring Corporation Information
- 10.13.2 Armstrong Flooring Overview
- 10.13.3 Armstrong Flooring Stone Plastic Composite (SPC) Flooring Sales, Revenue and Gross Margin (2018-2023)
- 10.13.4 Armstrong Flooring Stone Plastic Composite (SPC) Flooring Product Model Numbers, Pictures, Descriptions and Specifications
11 Industry Chain and Sales Channels Analysis
- 11.1 Stone Plastic Composite (SPC) Flooring Industry Chain Analysis
- 11.2 Stone Plastic Composite (SPC) Flooring Key Raw Materials
- 11.2.1 Key Raw Materials
- 11.2.2 Raw Materials Key Suppliers
- 11.3 Stone Plastic Composite (SPC) Flooring Production Mode & Process
- 11.4 Stone Plastic Composite (SPC) Flooring Sales and Marketing
- 11.4.1 Stone Plastic Composite (SPC) Flooring Sales Channels
- 11.4.2 Stone Plastic Composite (SPC) Flooring Distributors
- 11.5 Stone Plastic Composite (SPC) Flooring Customers
12 Research Findings and Conclusion
13 Appendix
- 13.1 Research Methodology
- 13.1.1 Methodology/Research Approach
- 13.1.2 Data Source
- 13.2 Author Details
- 13.3 Disclaimer