|
|
市場調査レポート
商品コード
1296729
世界および米国のエステル市場:2023-2029年Global and United States Esters Market Report & Forecast 2023-2029 |
||||||
|
|
|||||||
カスタマイズ可能
適宜更新あり
|
|||||||


| 世界および米国のエステル市場:2023-2029年 |
|
出版日: 2023年06月25日
発行: QYResearch
ページ情報: 英文 144 Pages
納期: 2~3営業日
|

- 全表示
- 概要
- 図表
- 目次
世界のエステルの市場規模 (収益) は、2022年の272億5,800万米ドルから、予測期間中は6.38%のCAGRで推移し、2029年には423億3,400万米ドルの規模に成長すると予測されています。
また、米国のエステルの市場規模 (収益) は、2022年の68億2,900万米ドルから、6.57%のCAGRで推移し、2029年には106億1,000万米ドルの規模に成長すると予測されています。
当レポートでは、世界のエステルの市場を調査し、市場および製品の概要、競合情勢、市場規模の推移・予測、各種区分・地域/主要国別の詳細分析、価格動向、市場成長への各種影響因子の分析、産業チェーン、主要企業の分析などをまとめています。
目次
第1章 調査範囲
- エステル製品:イントロダクション
- 世界のエステルの見通し:2018 vs 2022 vs 2029
- 米国のエステルの見通し:2018 vs 2022 vs 2029
- 市場規模:米国 vs 世界 2018 vs 2022 vs 2029
- 市場力学
- 産業動向
- 市場促進要因
- 市場課題
- 市場抑制要因
- 前提・制約
- 調査目的
- 調査年数
第2章 エステル:タイプ別
- エステル市場:タイプ別
- 脂肪酸エステル
- リン酸エステル
- アクリル酸エステル
- その他
- 世界のエステル市場の規模:タイプ別
- 販売額の実績・予測
- 販売量の実績・予測
- 平均販売価格の実績・予測
- 米国のエステル市場の規模:タイプ別
- 販売額の実績・予測
- 販売量の実績・予測
- 平均販売価格の実績・予測
第3章 エステル:用途別
- エステル市場:用途別
- 食品・飲料
- パーソナルケア・化粧品
- テキスタイル
- 潤滑剤
- 包装
- 世界のエステル市場の規模:用途別
- 販売額の実績・予測
- 販売量の実績・予測
- 平均販売価格の実績・予測
- 米国のエステル市場の規模:用途別
- 販売額の実績・予測
- 販売量の実績・予測
- 平均販売価格の実績・予測
第4章 世界のエステル市場の競合情勢:企業別
- 世界のエステル市場の規模:企業別
- 主要製造業者の製造拠点・流通・本社
- 主要製造業者の設立日
- 製造業者のM&A・拡張計画
- 米国のエステル市場の規模:企業別
第5章 世界のエステル市場の規模:地域別
- エステル市場の規模:2018 vs 2022 vs 2029
- 販売量の推移・予測
- 販売額の推移・予測
第6章 南北アメリカ
第7章 欧州・中東・アフリカ
第8章 中国
第9章 アジア太平洋
第10章 企業プロファイル
- Lanxess
- BASF
- Cargill
- ExxonMobil
- Croda
- NYCO
- Ashland
- Dow
- Esterchem
- KLK OLEO
- Wilmar
- Arkema
- Taiwan NJC
- Jialishi Additive
第11章 産業チェーン・販売チャネルの分析
- 産業チェーン分析
- 主な原材料
- 製造モード・プロセス
- 販売およびマーケティング
- エステルの顧客
第12章 調査結果・総論
第13章 付録
List of Tables
- Table 1. Esters CAGR in Value, United States VS Global, 2018 VS 2022 VS 2029
- Table 2. Esters Market Trends
- Table 3. Esters Market Drivers
- Table 4. Esters Market Challenges
- Table 5. Esters Market Restraints
- Table 6. Global Esters Sales Growth Rate (CAGR) by Type: 2018 VS 2022 VS 2029 (US$ Million)
- Table 7. United States Esters Sales Growth Rate (CAGR) by Type: 2018 VS 2022 VS 2029 (US$ Million)
- Table 8. Global Esters Sales Growth Rate (CAGR) by Application: 2018 VS 2022 VS 2029 (US$ Million)
- Table 9. Global Esters Price by Application (2018-2023) & (USD/MT)
- Table 10. Global Esters Price by Application (2024-2029) & (USD/MT)
- Table 11. United States Esters Sales Growth Rate (CAGR) by Application: 2018 VS 2022 VS 2029 (US$ Million)
- Table 12. United States Esters Price by Application (2018-2023) & (USD/MT)
- Table 13. United States Esters Price by Application (2024-2029) & (USD/MT)
- Table 14. Global Key Manufacturers of Esters by Revenue (2022) & (US$ Million)
- Table 15. Global Esters Revenue by Manufacturer, (US$ Million) & (2018-2023)
- Table 16. Global Esters Revenue Share by Manufacturer, 2018-2023
- Table 17. Global Esters Sales by Manufacturer, (K MT), 2018-2023
- Table 18. Global Esters Sales Share by Manufacturer, 2018-2023
- Table 19. Global Esters Price by Manufacturer (2018-2023) & (USD/MT)
- Table 20. Global Key Manufacturers of Esters, Manufacturing Base Distribution and Headquarters
- Table 21. Global Key Manufacturers of Esters, Date of Established
- Table 22. Manufacturers Mergers & Acquisitions, Expansion Plans
- Table 23. Key Players of Esters in United States by Revenue (2022) & (US$ million)
- Table 24. United States Esters Revenue by Players, (US$ Million) & (2018-2023)
- Table 25. United States Esters Revenue Share by Players, (2018-2023)
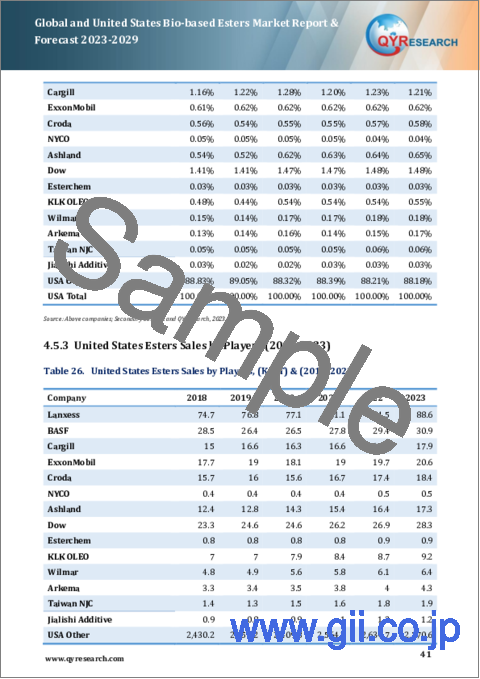
- Table 26. United States Esters Sales by Players, (K MT) & (2018-2023)
- Table 27. United States Esters Sales Share by Players, (2018-2023)
- Table 28. Global Esters Market Size Growth Rate (CAGR) by Region (US$ Million): 2018 VS 2022 VS 2029
- Table 29. Global Esters Sales in Volume by Region (2018-2023) & (K MT)
- Table 30. Global Esters Sales in Volume Forecast by Region (2024-2029) & (K MT)
- Table 31. Global Esters Sales in Value by Region (2018-2023) & (US$ Million)
- Table 32. Global Esters Sales in Value Forecast by Region (2024-2029) & (US$ Million)
- Table 33. Americas Esters Market Size Growth Rate (CAGR) by Country (US$ Million): 2018 VS 2022 VS 2029
- Table 34. Americas Esters Sales in Value by Country (2018-2023) & (US$ Million)
- Table 35. Americas Esters Sales in Value by Country (2024-2029) & (US$ Million)
- Table 36. Americas Esters Sales in Volume by Country (2018-2023) & (K MT)
- Table 37. Americas Esters Sales in Volume by Country (2024-2029) & (K MT)
- Table 38. EMEA Esters Market Size Growth Rate (CAGR) by Country (US$ Million): 2018 VS 2022 VS 2029
- Table 39. EMEA Esters Sales in Value by Country (2018-2023) & (US$ Million)
- Table 40. EMEA Esters Sales in Value by Country (2024-2029) & (US$ Million)
- Table 41. EMEA Esters Sales in Volume by Country (2018-2023) & (K MT)
- Table 42. EMEA Esters Sales in Volume by Country (2024-2029) & (K MT)
- Table 43. APAC Esters Market Size Growth Rate (CAGR) by Country (US$ Million): 2018 VS 2022 VS 2029
- Table 44. APAC Esters Sales in Value by Country (2018-2023) & (US$ Million)
- Table 45. APAC Esters Sales in Value by Country (2024-2029) & (US$ Million)
- Table 46. APAC Esters Sales in Volume by Country (2018-2023) & (K MT)
- Table 47. APAC Esters Sales in Volume by Country (2024-2029) & (K MT)
- Table 48. Lanxess Company Information
- Table 49. Lanxess Description and Business Overview
- Table 50. Lanxess Esters Sales (K MT), Revenue (US$ Million), Price (USD/MT) and Gross Margin (2018-2023)
- Table 51. Lanxess Esters Product
- Table 52. BASF Company Information
- Table 53. BASF Description and Business Overview
- Table 54. BASF Esters Sales (K MT), Revenue (US$ Million), Price (USD/MT) and Gross Margin (2018-2023)
- Table 55. BASF Esters Product
- Table 56. Cargill Company Information
- Table 57. Cargill Description and Business Overview
- Table 58. Cargill Esters Sales (K MT), Revenue (US$ Million), Price (USD/MT) and Gross Margin (2018-2023)
- Table 59. Cargill Esters Product
- Table 60. ExxonMobil Company Information
- Table 61. ExxonMobil Description and Business Overview
- Table 62. ExxonMobil Esters Sales (K MT), Revenue (US$ Million), Price (USD/MT) and Gross Margin (2018-2023)
- Table 63. ExxonMobil Esters Product
- Table 64. Croda Company Information
- Table 65. Croda Description and Business Overview
- Table 66. Croda Esters Sales (K MT), Revenue (US$ Million), Price (USD/MT) and Gross Margin (2018-2023)
- Table 67. Croda Esters Product
- Table 68. NYCO Company Information
- Table 69. NYCO Description and Business Overview
- Table 70. NYCO Esters Sales (K MT), Revenue (US$ Million), Price (USD/MT) and Gross Margin (2018-2023)
- Table 71. NYCO Esters Product
- Table 72. Ashland Company Information
- Table 73. Ashland Description and Business Overview
- Table 74. Ashland Esters Sales (K MT), Revenue (US$ Million), Price (USD/MT) and Gross Margin (2018-2023)
- Table 75. Ashland Esters Product
- Table 76. Dow Company Information
- Table 77. Dow Description and Business Overview
- Table 78. Dow Esters Sales (K MT), Revenue (US$ Million), Price (USD/MT) and Gross Margin (2018-2023)
- Table 79. Dow Esters Product
- Table 80. Esterchem Company Information
- Table 81. Esterchem Description and Business Overview
- Table 82. Esterchem Esters Sales (K MT), Revenue (US$ Million), Price (USD/MT) and Gross Margin (2018-2023)
- Table 83. Esterchem Esters Product
- Table 84. KLK OLEO Company Information
- Table 85. KLK OLEO Description and Business Overview
- Table 86. KLK OLEO Esters Sales (K MT), Revenue (US$ Million), Price (USD/MT) and Gross Margin (2018-2023)
- Table 87. KLK OLEO Esters Product
- Table 88. Wilmar Company Information
- Table 89. Wilmar Description and Business Overview
- Table 90. Wilmar Esters Sales (K MT), Revenue (US$ Million), Price (USD/MT) and Gross Margin (2018-2023)
- Table 91. Wilmar Esters Product
- Table 92. Arkema Company Information
- Table 93. Arkema Description and Business Overview
- Table 94. Arkema Esters Sales (K MT), Revenue (US$ Million), Price (USD/MT) and Gross Margin (2018-2023)
- Table 95. Arkema Esters Product
- Table 96. Taiwan NJC Company Information
- Table 97. Taiwan NJC Description and Business Overview
- Table 98. Taiwan NJC Esters Sales (K MT), Revenue (US$ Million), Price (USD/MT) and Gross Margin (2018-2023)
- Table 99. Taiwan NJC Esters Product
- Table 100. Jialishi Additive Company Information
- Table 101. Jialishi Additive Description and Business Overview
- Table 102. Jialishi Additive Esters Sales (K MT), Revenue (US$ Million), Price (USD/MT) and Gross Margin (2018-2023)
- Table 103. Jialishi Additive Esters Product
- Table 104. Key Raw Materials Lists
- Table 105. Raw Materials Key Suppliers Lists
- Table 106. Esters Distributors List
- Table 107. Esters Customers List
- Table 108. Research Programs/Design for This Report
- Table 109. Key Data Information from Secondary Sources
- Table 110. Key Data Information from Primary Sources
- Table 111. QYR Business Unit and Senior & Team Lead Analysts
List of Figures
- Figure 1. Esters Product Picture
- Figure 2. Global Esters Revenue, (US$ Million), 2018 VS 2022 VS 2029
- Figure 3. Global Esters Market Size 2018-2029 (US$ Million)
- Figure 4. Global Esters Sales 2018-2029 (K MT)
- Figure 5. United States Esters Revenue, (US$ Million), 2018 VS 2022 VS 2029
- Figure 6. United States Esters Market Size 2018-2029 (US$ Million)
- Figure 7. United States Esters Sales 2018-2029 (K MT)
- Figure 8. United States Esters Market Share in Global, in Value (US$ Million) 2018-2029
- Figure 9. United States Esters Market Share in Global, in Volume (K MT) 2018-2029
- Figure 10. Esters Report Years Considered
- Figure 11. Global Esters Market Share by Type in 2022 & 2029
- Figure 12. Global Esters Sales in Value by Type (2018-2029) & (US$ Million)
- Figure 13. Global Esters Sales Market Share in Value by Type (2018-2029)
- Figure 14. Global Esters Sales by Type (2018-2029) & (K MT)
- Figure 15. Global Esters Sales Market Share in Volume by Type (2018-2029)
- Figure 16. Global Esters Price by Type (2018-2029) & (USD/MT)
- Figure 17. United States Esters Market Share by Type in 2022 & 2029
- Figure 18. United States Esters Sales in Value by Type (2018-2029) & (US$ Million)
- Figure 19. United States Esters Sales Market Share in Value by Type (2018-2029)
- Figure 20. United States Esters Sales by Type (2018-2029) & (K MT)
- Figure 21. United States Esters Sales Market Share in Volume by Type (2018-2029)
- Figure 22. United States Esters Price by Type (2018-2029) & (USD/MT)
- Figure 23. Product Picture of Food & Beverages
- Figure 24. Product Picture of Personal Care & Cosmetics
- Figure 25. Product Picture of Textile
- Figure 26. Product Picture of Lubricant
- Figure 27. Product Picture of Packaging
- Figure 28. Global Esters Market Share by Application in 2022 & 2029
- Figure 29. Global Esters Sales in Value by Application (2018-2029) & (US$ Million)
- Figure 30. Global Esters Sales Market Share in Value by Application (2018-2029)
- Figure 31. Global Esters Sales by Application (2018-2029) & (K MT)
- Figure 32. Global Esters Sales Market Share in Volume by Application (2018-2029)
- Figure 33. United States Esters Market Share by Application in 2022 & 2029
- Figure 34. United States Esters Sales in Value by Application (2018-2029) & (US$ Million)
- Figure 35. United States Esters Sales Market Share in Value by Application (2018-2029)
- Figure 36. United States Esters Sales by Application (2018-2029) & (K MT)
- Figure 37. United States Esters Sales Market Share in Volume by Application (2018-2029)
- Figure 38. Global Esters Market Size Market Share by Region: 2018 VS 2022 VS 2029
- Figure 39. Global Esters Sales in Volume Market Share by Region (2018-2029)
- Figure 40. Global Esters Sales in Value Market Share by Region (2018-2029)
- Figure 41. Americas Esters Sales in Volume Growth Rate 2018-2029 (K MT)
- Figure 42. Americas Esters Sales in Value Growth Rate 2018-2029 (US$ Million)
- Figure 43. Americas Esters Sales by Type (2018-2029) & (K MT)
- Figure 44. Americas Esters Sales Market Share in Volume by Type (2018-2029)
- Figure 45. Americas Esters Sales by Application (2018-2029) & (K MT)
- Figure 46. Americas Esters Sales Market Share in Volume by Application (2018-2029)
- Figure 47. United States Esters Sales in Value Growth Rate (2018-2029) & (US$ Million)
- Figure 48. Canada Esters Sales in Value Growth Rate (2018-2029) & (US$ Million)
- Figure 49. Mexico Esters Sales in Value Growth Rate (2018-2029) & (US$ Million)
- Figure 50. Brazil Esters Sales in Value Growth Rate (2018-2029) & (US$ Million)
- Figure 51. EMEA Esters Sales in Volume Growth Rate 2018-2029 (K MT)
- Figure 52. EMEA Esters Sales in Value Growth Rate 2018-2029 (US$ Million)
- Figure 53. EMEA Esters Sales by Type (2018-2029) & (K MT)
- Figure 54. EMEA Esters Sales Market Share in Volume by Type (2018-2029)
- Figure 55. EMEA Esters Sales by Application (2018-2029) & (K MT)
- Figure 56. EMEA Esters Sales Market Share in Volume by Application (2018-2029)
- Figure 57. Europe Esters Sales in Value Growth Rate (2018-2029) & (US$ Million)
- Figure 58. Middle East Esters Sales in Value Growth Rate (2018-2029) & (US$ Million)
- Figure 59. Africa Esters Sales in Value Growth Rate (2018-2029) & (US$ Million)
- Figure 60. China Esters Sales in Volume Growth Rate 2018-2029 (K MT)
- Figure 61. China Esters Sales in Value Growth Rate 2018-2029 (US$ Million)
- Figure 62. China Esters Sales by Type (2018-2029) & (K MT)
- Figure 63. China Esters Sales Market Share in Volume by Type (2018-2029)
- Figure 64. China Esters Sales by Application (2018-2029) & (K MT)
- Figure 65. China Esters Sales Market Share in Volume by Application (2018-2029)
- Figure 66. APAC Esters Sales in Volume Growth Rate 2018-2029 (K MT)
- Figure 67. APAC Esters Sales in Value Growth Rate 2018-2029 (US$ Million)
- Figure 68. APAC Esters Sales by Type (2018-2029) & (K MT)
- Figure 69. APAC Esters Sales Market Share in Volume by Type (2018-2029)
- Figure 70. APAC Esters Sales by Application (2018-2029) & (K MT)
- Figure 71. APAC Esters Sales Market Share in Volume by Application (2018-2029)
- Figure 72. Japan Esters Sales in Value Growth Rate (2018-2029) & (US$ Million)
- Figure 73. Korea Esters Sales in Value Growth Rate (2018-2029) & (US$ Million)
- Figure 74. China Taiwan Esters Sales in Value Growth Rate (2018-2029) & (US$ Million)
- Figure 75. Southeast Asia Esters Sales in Value Growth Rate (2018-2029) & (US$ Million)
- Figure 76. India Esters Sales in Value Growth Rate (2018-2029) & (US$ Million)
- Figure 77. Esters Value Chain
- Figure 78. Esters Production Process
- Figure 79. Channels of Distribution
- Figure 80. Distributors Profiles
- Figure 81. Bottom-up and Top-down Approaches for This Report
- Figure 82. Data Triangulation
- Figure 83. Key Executives Interviewed
Market Analysis and Insights:
This report focuses on global and United States Esters market, also covers the segmentation data of other regions in regional level and county level.
The global Esters revenue was US$ 27258 million in 2022 and is forecast to a readjusted size of US$ 42334 million by 2029 with a CAGR of 6.38% during the review period (2023-2029).
In United States the Esters revenue is expected to grow from US$ 6829 million in 2022 to US$ 10610 million by 2029, at a CAGR of 6.57% during the forecast period (2023-2029).
Scope and Market Size:
Esters market is segmented in regional and country level, by players, by Type, and by Application. Companies, stakeholders, and other participants in the global Esters market will be able to gain the upper hand as they use the report as a powerful resource. The segmental analysis focuses on sales, revenue and forecast by Type and by Application for the period 2018-2029.
For United States market, this report focuses on the Esters market size by players, by Type, and by Application, for the period 2018-2029. The key players include the global and local players which play important roles in United States.
By Company
- Lanxess
- BASF
- Cargill
- ExxonMobil
- Croda
- NYCO
- Ashland
- Dow
- Esterchem
- KLK OLEO
- Wilmar
- Arkema
- Taiwan NJC
- Jialishi Additive
Segment by Type
- Fatty Acid Esters
- Phosphate Esters
- Acrylate Esters
- Others
Segment by Application
- Food & Beverages
- Personal Care & Cosmetics
- Textile
- Lubricant
- Packaging
- Others
By Region
- Americas
- United States
- Canada
- Mexico
- Brazil
- China
- APAC (excluding China)
- Japan
- Korea
- China Taiwan
- Southeast Asia
- India
- EMEA
- Europe
- Middle East
- Africa
Chapter Introduction
- Chapter 1: Introduces Esters definition, global sales (volume and revenue), United States market size, United States percentage in global market. This section also introduces the market dynamics, latest developments of the market, the driving factors and restrictive factors of the market, the challenges and risks faced by companies in the industry, and the analysis of relevant policies in the industry.
- Chapter 2: Provides the analysis of various market segments by Type, covering the volume, price, revenue, and development potential of each market segment, to help readers find the blue ocean market in different market segments.
- Chapter 3: Provides the analysis of various market segments by Application, covering the revenue, price, volume, and development potential of each market segment, to help readers find the blue ocean market in different downstream markets.
- Chapter 4: Detailed analysis of Esters companies competitive landscape, revenue, market share and industry ranking, latest development plan, merger, and acquisition information, etc.
- Chapter 5: Revenue and volume of Esters in global and regional level. It provides a quantitative analysis of the market size and development potential of each region and introduces the market development, future development prospects, market space, and capacity of each country in the world.
- Chapter 6: Americas by Type, by Application and by country, sales, and revenue for each segment.
- Chapter 7: EMEA by Type, by Application and by region, sales, and revenue for each segment.
- Chapter 8: China by Type, and by Application, sales, and revenue for each segment.
- Chapter 9: APAC (excluding China) by Type, by Application and by region, sales, and revenue for each segment.
- Chapter 10: Provides profiles of key companies, introducing the basic situation of the main companies in the market in detail, including product descriptions and specifications, Esters sales, revenue, gross margin, and recent development, etc.
- Chapter 11: Analysis of industrial chain, sales channel, key raw materials, distributors, and customers.
- Chapter 12: research findings and conclusion
Table of Contents
1 Study Coverage
- 1.1 Esters Product Introduction
- 1.2 Global Esters Outlook 2018 VS 2022 VS 2029
- 1.2.1 Global Esters Sales in US$ Million for the Year 2018-2029
- 1.2.2 Global Esters Sales in Volume for the Year 2018-2029
- 1.3 United States Esters Outlook 2018 VS 2022 VS 2029
- 1.3.1 United States Esters Sales in US$ Million for the Year 2018-2029
- 1.3.2 United States Esters Sales in Volume for the Year 2018-2029
- 1.4 Esters Market Size, United States VS Global, 2018 VS 2022 VS 2029
- 1.4.1 The Market Share of United States Esters in Global, 2018 VS 2022 VS 2029
- 1.4.2 The Growth Rate of Esters Market Size, United States VS Global, 2018 VS 2022 VS 2029
- 1.5 Esters Market Dynamics
- 1.5.1 Esters Industry Trends
- 1.5.2 Esters Market Drivers
- 1.5.3 Esters Market Challenges
- 1.5.4 Esters Market Restraints
- 1.6 Assumptions and Limitations
- 1.7 Study Objectives
- 1.8 Years Considered
2 Esters by Type
- 2.1 Esters Market by Type
- 2.1.1 Fatty Acid Esters
- 2.1.2 Phosphate Esters
- 2.1.3 Acrylate Esters
- 2.1.4 Others
- 2.2 Global Esters Market Size by Type
- 2.2.1 Global Esters Sales in Value, by Type (2018, 2022 & 2029)
- 2.2.2 Global Esters Sales in Volume, by Type (2018, 2022 & 2029)
- 2.2.3 Global Esters Average Selling Price (ASP) by Type (2018, 2022 & 2029)
- 2.3 United States Esters Market Size by Type
- 2.3.1 United States Esters Sales in Value, by Type (2018, 2022 & 2029)
- 2.3.2 United States Esters Sales in Volume, by Type (2018, 2022 & 2029)
- 2.3.3 United States Esters Average Selling Price (ASP) by Type (2018, 2022 & 2029)
3 Esters by Application
- 3.1 Esters Market by Application
- 3.1.1 Food & Beverages
- 3.1.2 Personal Care & Cosmetics
- 3.1.3 Textile
- 3.1.4 Lubricant
- 3.1.5 Packaging
- 3.2 Global Esters Market Size by Application
- 3.2.1 Global Esters Sales in Value, by Application (2018, 2022 & 2029)
- 3.2.2 Global Esters Sales in Volume, by Application (2018, 2022 & 2029)
- 3.2.3 Global Esters Average Selling Price (ASP) by Application (2018, 2022 & 2029)
- 3.3 United States Esters Market Size by Application
- 3.3.1 United States Esters Sales in Value, by Application (2018, 2022 & 2029)
- 3.3.2 United States Esters Sales in Volume, by Application (2018, 2022 & 2029)
- 3.3.3 United States Esters Average Selling Price (ASP) by Application (2018, 2022 & 2029)
4 Global Esters Competitor Landscape by Company
- 4.1 Global Esters Market Size by Company
- 4.1.1 Global Key Manufacturers of Esters by Revenue (2022)
- 4.1.2 Global Esters Revenue by Manufacturer (2018-2023)
- 4.1.3 Global Esters Sales by Manufacturer (2018-2023)
- 4.1.4 Global Esters Price by Manufacturer (2018-2023)
- 4.2 Global Key Manufacturers of Esters, Manufacturing Base Distribution and Headquarters
- 4.3 Global Key Manufacturers of Esters, Date of Established
- 4.4 Manufacturers Mergers & Acquisitions, Expansion Plans
- 4.5 United States Esters Market Size by Company
- 4.5.1 Key Players of Esters in United States by Revenue (2022)
- 4.5.2 United States Esters Revenue by Players (2018-2023)
- 4.5.3 United States Esters Sales by Players (2018-2023)
5 Global Esters Market Size by Region
- 5.1 Global Esters Market Size by Region: 2018 VS 2022 VS 2029
- 5.2 Global Esters Market Size in Volume by Region (2018-2029)
- 5.2.1 Global Esters Sales in Volume by Region: 2018-2023
- 5.2.2 Global Esters Sales in Volume Forecast by Region (2024-2029)
- 5.3 Global Esters Market Size in Value by Region (2018-2029)
- 5.3.1 Global Esters Sales in Value by Region: 2018-2023
- 5.3.2 Global Esters Sales in Value by Region: 2024-2029
6 Americas
- 6.1 Americas Esters Market Size YoY Growth 2018-2029
- 6.2 Americas Esters Sales in Volume, by Type (2018, 2022 & 2029)
- 6.3 Americas Esters Sales in Volume, by Application (2018, 2022 & 2029)
- 6.4 Americas Esters Market Facts & Figures by Country (2018, 2022 & 2029)
- 6.4.1 Americas Esters Sales in Value by Country (2018, 2022 & 2029)
- 6.4.2 Americas Esters Sales in Volume by Country (2018, 2022 & 2029)
- 6.4.3 United States
- 6.4.4 Canada
- 6.4.5 Mexico
- 6.4.6 Brazil
7 EMEA
- 7.1 EMEA Esters Market Size YoY Growth 2018-2029
- 7.2 EMEA Esters Sales in Volume, by Type (2018, 2022 & 2029)
- 7.3 EMEA Esters Sales in Volume, by Application (2018, 2022 & 2029)
- 7.4 EMEA Esters Market Facts & Figures by Country (2018, 2022 & 2029)
- 7.4.1 EMEA Esters Sales in Value by Country (2018, 2022 & 2029)
- 7.4.2 EMEA Esters Sales in Volume by Country (2018, 2022 & 2029)
- 7.4.3 Europe
- 7.4.4 Middle East
- 7.4.5 Africa
8 China
- 8.1 China Esters Market Size YoY Growth 2018-2029
- 8.2 China Esters Sales in Volume, by Type (2018, 2022 & 2029)
- 8.3 China Esters Sales in Volume, by Application (2018, 2022 & 2029)
9 APAC
- 9.1 APAC Esters Market Size YoY Growth 2018-2029
- 9.2 APAC Esters Sales in Volume, by Type (2018, 2022 & 2029)
- 9.3 APAC Esters Sales in Volume, by Application (2018, 2022 & 2029)
- 9.4 APAC Esters Market Facts & Figures by Country (2018, 2022 & 2029)
- 9.4.1 APAC Esters Sales in Value by Country (2018, 2022 & 2029)
- 9.4.2 APAC Esters Sales in Volume by Country (2018, 2022 & 2029)
- 9.4.3 Japan
- 9.4.4 Korea
- 9.4.5 China Taiwan
- 9.4.6 Southeast Asia
- 9.4.7 India
10 Company Profiles
- 10.1 Lanxess
- 10.1.1 Lanxess Company Information
- 10.1.2 Lanxess Description and Business Overview
- 10.1.3 Lanxess Esters Sales, Revenue and Gross Margin (2018-2023)
- 10.1.4 Lanxess Esters Products Offered
- 10.2 BASF
- 10.2.1 BASF Company Information
- 10.2.2 BASF Description and Business Overview
- 10.2.3 BASF Esters Sales, Revenue and Gross Margin (2018-2023)
- 10.2.4 BASF Esters Products Offered
- 10.3 Cargill
- 10.3.1 Cargill Company Information
- 10.3.2 Cargill Description and Business Overview
- 10.3.3 Cargill Esters Sales, Revenue and Gross Margin (2018-2023)
- 10.3.4 Cargill Esters Products Offered
- 10.4 ExxonMobil
- 10.4.1 ExxonMobil Company Information
- 10.4.2 ExxonMobil Description and Business Overview
- 10.4.3 ExxonMobil Esters Sales, Revenue and Gross Margin (2018-2023)
- 10.4.4 ExxonMobil Esters Products Offered
- 10.5 Croda
- 10.5.1 Croda Company Information
- 10.5.2 Croda Description and Business Overview
- 10.5.3 Croda Esters Sales, Revenue and Gross Margin (2018-2023)
- 10.5.4 Croda Esters Products Offered
- 10.6 NYCO
- 10.6.1 NYCO Company Information
- 10.6.2 NYCO Description and Business Overview
- 10.6.3 NYCO Esters Sales, Revenue and Gross Margin (2018-2023)
- 10.6.4 NYCO Esters Products Offered
- 10.7 Ashland
- 10.7.1 Ashland Company Information
- 10.7.2 Ashland Description and Business Overview
- 10.7.3 Ashland Esters Sales, Revenue and Gross Margin (2018-2023)
- 10.7.4 Ashland Esters Products Offered
- 10.8 Dow
- 10.8.1 Dow Company Information
- 10.8.2 Dow Description and Business Overview
- 10.8.3 Dow Esters Sales, Revenue and Gross Margin (2018-2023)
- 10.8.4 Dow Esters Products Offered
- 10.9 Esterchem
- 10.9.1 Esterchem Company Information
- 10.9.2 Esterchem Description and Business Overview
- 10.9.3 Esterchem Esters Sales, Revenue and Gross Margin (2018-2023)
- 10.9.4 Esterchem Esters Products Offered
- 10.10 KLK OLEO
- 10.10.1 KLK OLEO Company Information
- 10.10.2 KLK OLEO Description and Business Overview
- 10.10.3 KLK OLEO Esters Sales, Revenue and Gross Margin (2018-2023)
- 10.10.4 KLK OLEO Esters Products Offered
- 10.11 Wilmar
- 10.11.1 Wilmar Company Information
- 10.11.2 Wilmar Description and Business Overview
- 10.11.3 Wilmar Esters Sales, Revenue and Gross Margin (2018-2023)
- 10.11.4 Wilmar Esters Products Offered
- 10.12 Arkema
- 10.12.1 Arkema Company Information
- 10.12.2 Arkema Description and Business Overview
- 10.12.3 Arkema Esters Sales, Revenue and Gross Margin (2018-2023)
- 10.12.4 Arkema Esters Products Offered
- 10.13 Taiwan NJC
- 10.13.1 Taiwan NJC Company Information
- 10.13.2 Taiwan NJC Description and Business Overview
- 10.13.3 Taiwan NJC Esters Sales, Revenue and Gross Margin (2018-2023)
- 10.13.4 Taiwan NJC Esters Products Offered
- 10.14 Jialishi Additive
- 10.14.1 Jialishi Additive Company Information
- 10.14.2 Jialishi Additive Description and Business Overview
- 10.14.3 Jialishi Additive Esters Sales, Revenue and Gross Margin (2018-2023)
- 10.14.4 Jialishi Additive Esters Products Offered
11 Industry Chain and Sales Channels Analysis
- 11.1 Esters Industry Chain Analysis
- 11.2 Esters Key Raw Materials
- 11.2.1 Key Raw Materials
- 11.2.2 Raw Materials Key Suppliers
- 11.3 Esters Production Mode & Process
- 11.4 Esters Sales and Marketing
- 11.4.1 Esters Sales Channels
- 11.4.2 Esters Distributors
- 11.5 Esters Customers
12 Research Findings and Conclusion
13 Appendix
- 13.1 Research Methodology
- 13.1.1 Methodology/Research Approach
- 13.1.2 Data Source
- 13.2 Author Details
- 13.3 Disclaimer