|
|
市場調査レポート
商品コード
1291763
自動ドアの世界市場:2018-2029年Global Automatic Door Market Report, History and Forecast 2018-2029 |
||||||
|
|
|||||||
|
● お客様のご希望に応じて、既存データの加工や未掲載情報(例:国別セグメント)の追加などの対応が可能です。 詳細はお問い合わせください。 |
|||||||


| 自動ドアの世界市場:2018-2029年 |
|
出版日: 2023年06月16日
発行: QYResearch
ページ情報: 英文 108 Pages
納期: 2~3営業日
|
- 全表示
- 概要
- 図表
- 目次
世界の自動ドアの市場規模は予測期間中3.96%のCAGRで推移し、2022年の44億6,548万米ドルから、2027年末には57億7,903万米ドルの規模に成長すると予測されています。
当レポートでは、世界の自動ドアの市場を調査し、市場および製品の概要、市場規模の推移・予測、タイプ・用途別の内訳、地域・主要国別の詳細分析、主要動向・市場影響因子の分析、競合環境、主要企業のプロファイルなどをまとめています。
目次
第1章 自動ドア:市場概要
- 製品概要
- タイプ別の分類
- 引き戸
- 回転ドア
- その他
- 市場規模:タイプ別
- 概要
- 市場規模の推移
- 市場規模の予測
- 市場規模:タイプ・地域別
- 北米
- 欧州
- アジア太平洋
- 南米
- 中東・アフリカ
第2章 自動ドア市場の競合情勢・企業
- 世界の主要企業:販売数別
- 世界の主要企業:収益別
- 世界の主要企業:価格
- 世界の主要企業の本社・分布
- 競合状況と動向
- 世界の主要製造業者:企業タイプ別 (Tier 1・2・3)
- M&A・拡大
第3章 自動ドアの現状と展望:地域別
- 市場規模・CAGR:2018年 vs 2022年 vs 2029年
- 市場規模の推移
- 市場規模の予測
第4章 自動ドア:用途別
- 市場規模
- 市場規模の推移
- 市場規模の予測
第5章 北米の自動ドア市場:国別
第6章 欧州の自動ドア市場:国別
第7章 アジア太平洋の自動ドア市場:地域別
第8章 南米の自動ドア市場:国別
第9章 中東・アフリカの自動ドア市場:国別
第10章 自動ドア事業の企業プロファイル・主要データ
- ASSA ABLOY
- NABTESCO
- DORMAKABA
- STANLEY ACCESS TECHNOLOGIES
- HORTON AUTOMATICS
- TORMAX
- GEZE
- PORTALP
- NINGBO OWNIC
- KBB
- SANE BOON
- MANUSA
- SHANGHAI PAD
- FUSO ELECTRIC
第11章 上流・機会・課題・リスク・影響要因の分析
- 主な原材料
- 製造コスト構造
- 市場力学
- 動向
- 市場促進要因
- 市場課題
- 市場抑制要因
第12章 マーケティング戦略分析・ディストリビューター
- 販売チャネル
- 市場でのポジショニング
- ディストリビューターリスト
第13章 調査結果・総論
第14章 付録
List of Tables
- Table 1. Global Automatic Door Sales by Type: 2018 VS 2022 VS 2029 (US$ Million)
- Table 2. Global Automatic Door Sales by Type (2018-2023) & (K Units)
- Table 3. Global Automatic Door Sales Market Share in Volume by Type (2018-2023)
- Table 4. Global Automatic Door Sales by Type (2018-2023) & (US$ Million)
- Table 5. Global Automatic Door Sales Market Share in Value by Type (2018-2023)
- Table 6. Global Automatic Door Price by Type (2018-2023) & (US$/Unit)
- Table 7. Global Automatic Door Sales by Type (2024-2029) & (K Units)
- Table 8. Global Automatic Door Sales Market Share in Volume by Type (2024-2029)
- Table 9. Global Automatic Door Sales by Type (2024-2029) & (US$ Million)
- Table 10. Global Automatic Door Sales Market Share in Value by Type (2024-2029)
- Table 11. Global Automatic Door Price by Type (2024-2029) & (US$/Unit)
- Table 12. North America Automatic Door Sales by Type (2018-2023) & (K Units)
- Table 13. Europe Automatic Door Sales (K Units) by Type (2018-2023)
- Table 14. Asia-Pacific Automatic Door Sales (K Units) by Type (2018-2023)
- Table 15. South America Automatic Door Sales (K Units) by Type (2018-2023)
- Table 16. Middle East and Africa Automatic Door Sales (K Units) by Type (2018-2023)
- Table 17. Global Automatic Door Sales by Company (2018-2023) & (K Units)
- Table 18. Global Automatic Door Sales Share by Company (2018-2023)
- Table 19. Global Automatic Door Revenue by Company (2018-2023) & (US$ Million)
- Table 20. Global Automatic Door Revenue Share by Company (2018-2023)
- Table 21. Global Market Automatic Door Price by Company (2018-2023) & (US$/Unit)
- Table 22. Global Automatic Door Top Manufacturers Headquarter Distribution
- Table 23. Global Automatic Door Manufacturers Market Concentration Ratio (CR5)
- Table 24. Global Top Manufacturers Market Share by Company Type (Tier 1, Tier 2, and Tier 3) & (based on the Revenue in Automatic Door as of 2022)
- Table 25. Mergers & Acquisitions, Expansion Plans
- Table 26. Global Automatic Door Market Size Comparison by Region (US$ Million): 2018 VS 2022 VS 2029
- Table 27. Global Automatic Door Sales by Region (2018-2023) & (K Units)
- Table 28. Global Automatic Door Sales Market Share in Volume by Region (2018-2023)
- Table 29. Global Automatic Door Sales by Region (2018-2023) & (US$ Million)
- Table 30. Global Automatic Door Sales Market Share in Value by Region (2018-2023)
- Table 31. Global Automatic Door Sales (K Units), Value (US$ Million), Price (US$/Unit) and Gross Margin (2018-2023)
- Table 32. Global Automatic Door Sales by Region (2024-2029) & (K Units)
- Table 33. Global Automatic Door Sales Market Share in Volume by Region (2024-2029)
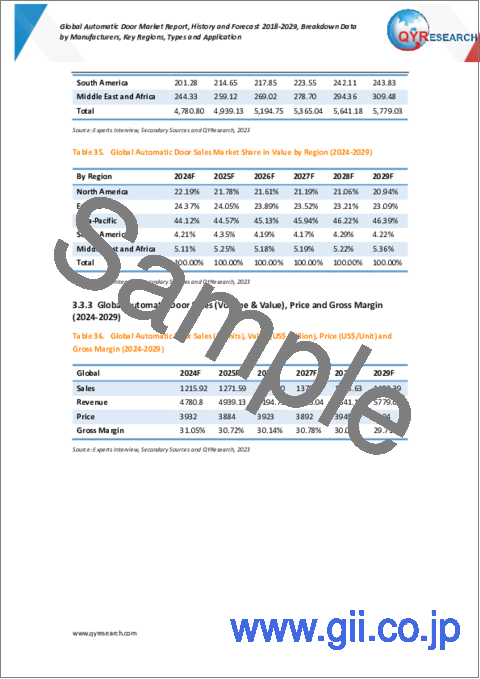
- Table 34. Global Automatic Door Sales by Region (2024-2029) & (US$ Million)
- Table 35. Global Automatic Door Sales Market Share in Value by Region (2024-2029)
- Table 36. Global Automatic Door Sales (K Units), Value (US$ Million), Price (US$/Unit) and Gross Margin (2024-2029)
- Table 37. Global Automatic Door Sales by Application: 2018 VS 2022 VS 2029 (US$ Million)
- Table 38. Global Automatic Door Sales by Application (2018-2023) & (K Units)
- Table 39. Global Automatic Door Sales Market Share in Volume by Application (2018-2023)
- Table 40. Global Automatic Door Sales by Application (2018-2023) & (US$ Million)
- Table 41. Global Automatic Door Sales Market Share in Value by Application (2018-2023)
- Table 42. Global Automatic Door Price by Application (2018-2023) & (US$/Unit)
- Table 43. Global Automatic Door Sales by Application (2024-2029) & (K Units)
- Table 44. Global Automatic Door Sales Market Share in Volume by Application (2024-2029)
- Table 45. Global Automatic Door Sales by Application (2024-2029) & (US$ Million)
- Table 46. Global Automatic Door Sales Market Share in Value by Application (2024-2029)
- Table 47. Global Automatic Door Price by Application (2024-2029) & (US$/Unit)
- Table 48. North America Automatic Door Sales by Country (2018-2023) & (K Units)
- Table 49. North America Automatic Door Sales Market Share in Volume by Country (2018-2023)
- Table 50. North America Automatic Door Sales by Country (2018-2023) & (US$ Million)
- Table 51. North America Automatic Door Sales Market Share in Value by Country (2018-2023)
- Table 52. North America Automatic Door Sales by Country (2024-2029) & (K Units)
- Table 53. North America Automatic Door Sales Market Share in Volume by Country (2024-2029)
- Table 54. North America Automatic Door Sales by Country (2024-2029) & (US$ Million)
- Table 55. North America Automatic Door Sales Market Share in Value by Country (2024-2029)
- Table 56. Europe Automatic Door Sales by Country (2018-2023) & (K Units)
- Table 57. Europe Automatic Door Sales Market Share in Volume by Country (2018-2023)
- Table 58. Europe Automatic Door Sales by Country (2018-2023) & (US$ Million)
- Table 59. Europe Automatic Door Sales Market Share in Value by Country (2018-2023)
- Table 60. Europe Automatic Door Sales by Country (2024-2029) & (K Units)
- Table 61. Europe Automatic Door Sales Market Share in Volume by Country (2024-2029)
- Table 62. Europe Automatic Door Sales by Country (2024-2029) & (US$ Million)
- Table 63. Europe Automatic Door Sales Market Share in Value by Country (2024-2029)
- Table 64. Asia-Pacific Automatic Door Sales by Region (2018-2023) & (K Units)
- Table 65. Asia-Pacific Automatic Door Sales Market Share in Volume by Region (2018-2023)
- Table 66. Asia-Pacific Automatic Door Sales by Region (2018-2023) & (US$ Million)
- Table 67. Asia-Pacific Automatic Door Sales Market Share in Value by Region (2018-2023)
- Table 68. Asia-Pacific Automatic Door Sales by Region (2024-2029) & (K Units)
- Table 69. Asia-Pacific Automatic Door Sales Market Share in Volume by Region (2024-2029)
- Table 70. Asia-Pacific Automatic Door Sales by Region (2024-2029) & (US$ Million)
- Table 71. Asia-Pacific Automatic Door Sales Market Share in Value by Region (2024-2029)
- Table 72. South America Automatic Door Sales by Country (2018-2023) & (K Units)
- Table 73. South America Automatic Door Sales Market Share in Volume by Country (2018-2023)
- Table 74. South America Automatic Door Sales by Country (2018-2023) & (US$ Million)
- Table 75. South America Automatic Door Sales Market Share in Value by Country (2018-2023)
- Table 76. South America Automatic Door Sales by Country (2024-2029) & (K Units)
- Table 77. South America Automatic Door Sales Market Share in Volume by Country (2024-2029)
- Table 78. South America Automatic Door Sales by Country (2024-2029) & (US$ Million)
- Table 79. South America Automatic Door Sales Market Share in Value by Country (2024-2029)
- Table 80. Middle East and Africa Automatic Door Sales by Country (2018-2023) & (K Units)
- Table 81. Middle East and Africa Automatic Door Sales Market Share in Volume by Country (2018-2023)
- Table 82. Middle East and Africa Automatic Door Sales by Country (2018-2023) & (US$ Million)
- Table 83. Middle East and Africa Automatic Door Sales Market Share in Value by Country (2018-2023)
- Table 84. Middle East and Africa Automatic Door Sales by Country (2024-2029) & (K Units)
- Table 85. Middle East and Africa Automatic Door Sales Market Share by Country (2024-2029)
- Table 86. Middle East and Africa Automatic Door Sales by Country (2024-2029) & (US$ Million)
- Table 87. Middle East and Africa Automatic Door Sales Market Share in Value by Country (2024-2029)
- Table 88. Assa Abloy Company Details
- Table 89. Company and Business Overview
- Table 90. Assa Abloy Automatic Door Introduction
- Table 91. Assa Abloy Revenue, Sales, Price and Gross Margin in Automatic Door Business (2018-2023)
- Table 92. Nabtesco Company Details
- Table 93. Company and Business Overview
- Table 94. Nabtesco Automatic Door Introduction
- Table 95. Nabtesco Revenue, Sales, Price and Gross Margin in Automatic Door Business (2018-2023)
- Table 96. Dormakaba Company Details
- Table 97. Company and Business Overview
- Table 98. Dormakaba Automatic Door Introduction
- Table 99. Dormakaba Revenue, Sales, Price and Gross Margin in Automatic Door Business (2018-2023)
- Table 100. STANLEY Access Technologies Company Details
- Table 101. Company and Business Overview
- Table 102. STANLEY Access Technologies Automatic Door Introduction
- Table 103. STANLEY Access Technologies Revenue, Sales, Price and Gross Margin in Automatic Door Business (2018-2023)
- Table 104. Horton Automatics Company Details
- Table 105. Company and Business Overview
- Table 106. Horton Automatics Automatic Door Introduction
- Table 107. Horton Automatics Revenue, Sales, Price and Gross Margin in Automatic Door Business (2018-2023)
- Table 108. Tormax Company Details
- Table 109. Company and Business Overview
- Table 110. Tormax Automatic Door Introduction
- Table 111. Tormax Revenue, Sales, Price and Gross Margin in Automatic Door Business (2018-2023)
- Table 112. GEZE Company Details
- Table 113. Company and Business Overview
- Table 114. GEZE Automatic Door Introduction
- Table 115. GEZE Revenue, Sales, Price and Gross Margin in Automatic Door Business (2018-2023)
- Table 116. Portalp Company Details
- Table 117. Company and Business Overview
- Table 118. Portalp Automatic Door Introduction
- Table 119. Portalp Revenue, Sales, Price and Gross Margin in Automatic Door Business (2018-2023)
- Table 120. Ningbo Ownic Company Details
- Table 121. Company and Business Overview
- Table 122. Ningbo Ownic Automatic Door Introduction
- Table 123. Ningbo Ownic Revenue, Sales, Price and Gross Margin in Automatic Door Business (2018-2023)
- Table 124. KBB Company Details
- Table 125. Company and Business Overview
- Table 126. KBB Automatic Door Introduction
- Table 127. KBB Revenue, Sales, Price and Gross Margin in Automatic Door Business (2018-2023)
- Table 128. Sane Boon Company Details
- Table 129. Company and Business Overview
- Table 130. Sane Boon Automatic Door Introduction
- Table 131. Sane Boon Revenue, Sales, Price and Gross Margin in Automatic Door Business (2018-2023)
- Table 132. Manusa Company Details
- Table 133. Company and Business Overview
- Table 134. Manusa Automatic Door Introduction
- Table 135. Manusa Revenue, Sales, Price and Gross Margin in Automatic Door Business (2018-2023)
- Table 136. Shanghai PAD Company Details
- Table 137. Company and Business Overview
- Table 138. Shanghai PAD Automatic Door Introduction
- Table 139. Shanghai PAD Revenue, Sales, Price and Gross Margin in Automatic Door Business (2018-2023)
- Table 140. FUSO ELECTRIC Company Details
- Table 141. Company and Business Overview
- Table 142. FUSO ELECTRIC Automatic Door Introduction
- Table 143. FUSO ELECTRIC Revenue, Sales, Price and Gross Margin in Automatic Door Business (2018-2023)
- Table 144. Key Raw Materials
- Table 145. Automatic Door Market Trends
- Table 146. Automatic Door Market Drivers
- Table 147. Automatic Door Market Challenges
- Table 148. Automatic Door Market Restraints
- Table 149. Distributor List of Automatic Door
- Table 150. Research Programs/Design for This Report
- Table 151. Key Data Information from Secondary Sources
- Table 152. Key Data Information from Primary Sources
List of Figures
- Figure 1. Automatic Door Product Picture
- Figure 2. Global Automatic Door Market Size, 2018 VS 2023 VS 2029 (US$ Million)
- Figure 3. Global Automatic Door Market Size Status and Outlook (2018-2029) & (US$ Million)
- Figure 4. Global Automatic Door Sales Status and Outlook (2018-2029) & (K Units)
- Figure 5. Product Picture of Sliding Doors
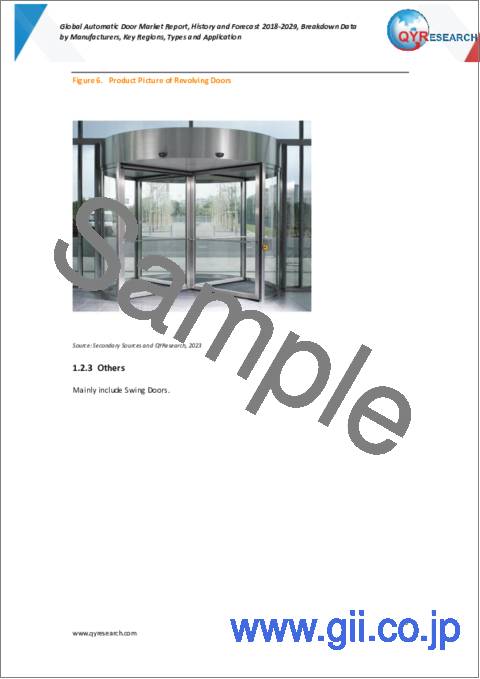
- Figure 6. Product Picture of Revolving Doors
- Figure 7. Product Picture of Swing Doors
- Figure 8. North America Automatic Door Sales Market Share in Volume by Type in 2022
- Figure 9. Europe Automatic Door Sales Market Share in Volume by Type in 2022
- Figure 10. Asia-Pacific Automatic Door Sales Market Share in Volume by Type in 2022
- Figure 11. South America Automatic Door Sales Market Share in Volume by Type in 2022
- Figure 12. Middle East and Africa Automatic Door Sales Market Share in Volume by Type in 2022
- Figure 13. The 5 Largest Manufacturers in the World: Market Share by Automatic Door Revenue in 2022
- Figure 14. Manufacturing Cost Structure of Automatic Door
- Figure 15. Marketing Channels of Automatic Door by Method
- Figure 16. Bottom-up and Top-down Approaches for This Report
- Figure 17. Data Triangulation
- Figure 18. Key Executives Interviewed
Market Analysis and Insights:
In 2022, the global Automatic Door market size was US$ 4465.48 million and it will reach US$ 5779.03 million in 2029, growing at CAGR of 3.96% between 2023 and 2029.
Scope and Market Size:
The global Automatic Door market is segmented by region (country), company, by Type, and by Application. Players, stakeholders, and other participants in the global Automatic Door market will be able to gain the upper hand as they use the report as a powerful resource. The segmental analysis focuses on sales, revenue and forecast by region (country), by Type, and by Application for the period 2018-2029.
By Company
- Assa Abloy
- Nabtesco
- Dormakaba
- STANLEY Access Technologies
- Horton Automatics
- Tormax
- Geze
- Portalp
- Ningbo Ownic
- KBB
- Sane Boon
- Manusa
- Shanghai PAD
- FUSO ELECTRIC
Segment by Type
- Sliding Doors
- Revolving Doors
- Others
Segment by Application
- Hospital
- Airport
- Retail Store
- Hotels
- Office Building
- Business Center
- Others
By Region
- North America
- United States
- Canada
- Mexico
- Asia-Pacific
- China
- Japan
- South Korea
- India
- Southeast Asia
- Europe
- Germany
- France
- U.K.
- Italy
- Russia
- South America
- Middle East & Africa
TABLE OF CONTENTS
1 AUTOMATIC DOOR MARKET OVERVIEW
- 1.1 AUTOMATIC DOOR PRODUCT OVERVIEW
- 1.2 AUTOMATIC DOOR MARKET SEGMENT BY TYPE
- 1.2.1 SLIDING DOORS
- 1.2.2 REVOLVING DOORS
- 1.2.3 OTHERS
- 1.3 GLOBAL AUTOMATIC DOOR MARKET SIZE BY TYPE
- 1.3.1 GLOBAL AUTOMATIC DOOR MARKET SIZE OVERVIEW BY TYPE (2018-2029)
- 1.3.2 GLOBAL AUTOMATIC DOOR HISTORIC MARKET SIZE REVIEW BY TYPE (2018-2023)
- 1.3.3 GLOBAL AUTOMATIC DOOR FORECASTED MARKET SIZE BY TYPE (2024-2029)
- 1.4 KEY REGIONS MARKET SIZE SEGMENT BY TYPE
- 1.4.1 NORTH AMERICA AUTOMATIC DOOR SALES BREAKDOWN BY TYPE (2018-2023)
- 1.4.2 EUROPE AUTOMATIC DOOR SALES BREAKDOWN BY TYPE (2018-2023)
- 1.4.3 ASIA-PACIFIC AUTOMATIC DOOR SALES BREAKDOWN BY TYPE (2018-2023)
- 1.4.4 SOUTH AMERICA AUTOMATIC DOOR SALES BREAKDOWN BY TYPE (2018-2023)
- 1.4.5 MIDDLE EAST AND AFRICA AUTOMATIC DOOR SALES BREAKDOWN BY TYPE (2018-2023)
2 AUTOMATIC DOOR MARKET COMPETITION BY COMPANY
- 2.1 GLOBAL TOP PLAYERS BY AUTOMATIC DOOR SALES (2018-2023)
- 2.2 GLOBAL TOP PLAYERS BY AUTOMATIC DOOR REVENUE (2018-2023)
- 2.3 GLOBAL TOP PLAYERS BY AUTOMATIC DOOR PRICE (2018-2023)
- 2.4 GLOBAL TOP MANUFACTURERS AUTOMATIC DOOR HEADQUARTER DISTRIBUTION
- 2.5 AUTOMATIC DOOR MARKET COMPETITIVE SITUATION AND TRENDS
- 2.5.1 AUTOMATIC DOOR MARKET CONCENTRATION RATE (2018-2023)
- 2.5.2 GLOBAL 5 LARGEST MANUFACTURERS BY AUTOMATIC DOOR SALES AND REVENUE IN 2022
- 2.6 GLOBAL TOP MANUFACTURERS BY COMPANY TYPE (TIER 1, TIER 2, AND TIER 3) & (BASED ON THE REVENUE IN AUTOMATIC DOOR AS OF 2022)
- 2.7 MERGERS & ACQUISITIONS, EXPANSION
3 AUTOMATIC DOOR STATUS AND OUTLOOK BY REGION
- 3.1 GLOBAL AUTOMATIC DOOR MARKET SIZE AND CAGR BY REGION: 2018 VS 2022 VS 2029
- 3.2 GLOBAL AUTOMATIC DOOR HISTORIC MARKET SIZE BY REGION
- 3.2.1 GLOBAL AUTOMATIC DOOR SALES IN VOLUME BY REGION (2018-2023)
- 3.2.2 GLOBAL AUTOMATIC DOOR SALES IN VALUE BY REGION (2018-2023)
- 3.2.3 GLOBAL AUTOMATIC DOOR SALES (VOLUME & VALUE), PRICE AND GROSS MARGIN (2018-2023)
- 3.3 GLOBAL AUTOMATIC DOOR FORECASTED MARKET SIZE BY REGION
- 3.3.1 GLOBAL AUTOMATIC DOOR SALES IN VOLUME BY REGION (2024-2029)
- 3.3.2 GLOBAL AUTOMATIC DOOR SALES IN VALUE BY REGION (2024-2029)
- 3.3.3 GLOBAL AUTOMATIC DOOR SALES (VOLUME & VALUE), PRICE AND GROSS MARGIN (2024-2029)
4 AUTOMATIC DOOR BY APPLICATION
- 4.1 GLOBAL AUTOMATIC DOOR MARKET SIZE BY APPLICATION
- 4.2 GLOBAL AUTOMATIC DOOR HISTORIC MARKET SIZE REVIEW BY APPLICATION (2018-2023)
- 4.3 GLOBAL AUTOMATIC DOOR FORECASTED MARKET SIZE BY APPLICATION (2024-2029)
5 NORTH AMERICA AUTOMATIC DOOR BY COUNTRY
- 5.1 NORTH AMERICA AUTOMATIC DOOR HISTORIC MARKET SIZE BY COUNTRY
- 5.1.1 NORTH AMERICA AUTOMATIC DOOR SALES IN VOLUME BY COUNTRY (2018-2023)
- 5.1.2 NORTH AMERICA AUTOMATIC DOOR SALES IN VALUE BY COUNTRY (2018-2023)
- 5.2 NORTH AMERICA AUTOMATIC DOOR FORECASTED MARKET SIZE BY COUNTRY
- 5.2.1 NORTH AMERICA AUTOMATIC DOOR SALES IN VOLUME BY COUNTRY (2024-2029)
- 5.2.2 NORTH AMERICA AUTOMATIC DOOR SALES IN VALUE BY COUNTRY (2024-2029)
6 EUROPE AUTOMATIC DOOR BY COUNTRY
- 6.1 EUROPE AUTOMATIC DOOR HISTORIC MARKET SIZE BY COUNTRY
- 6.1.1 EUROPE AUTOMATIC DOOR SALES IN VOLUME BY COUNTRY (2018-2023)
- 6.1.2 EUROPE AUTOMATIC DOOR SALES IN VALUE BY COUNTRY (2018-2023)
- 6.2 EUROPE AUTOMATIC DOOR FORECASTED MARKET SIZE BY COUNTRY
- 6.2.1 EUROPE AUTOMATIC DOOR SALES IN VOLUME BY COUNTRY (2024-2029)
- 6.2.2 EUROPE AUTOMATIC DOOR SALES IN VALUE BY COUNTRY (2024-2029)
7 ASIA-PACIFIC AUTOMATIC DOOR BY REGION
- 7.1 ASIA-PACIFIC AUTOMATIC DOOR HISTORIC MARKET SIZE BY REGION
- 7.1.1 ASIA-PACIFIC AUTOMATIC DOOR SALES IN VOLUME BY REGION (2018-2023)
- 7.1.2 ASIA-PACIFIC AUTOMATIC DOOR SALES IN VALUE BY REGION (2018-2023)
- 7.2 ASIA-PACIFIC AUTOMATIC DOOR FORECASTED MARKET SIZE BY REGION
- 7.2.1 ASIA-PACIFIC AUTOMATIC DOOR SALES IN VOLUME BY REGION (2024-2029)
- 7.2.2 ASIA-PACIFIC AUTOMATIC DOOR SALES IN VALUE BY REGION (2024-2029)
8 SOUTH AMERICA AUTOMATIC DOOR BY COUNTRY
- 8.1 SOUTH AMERICA AUTOMATIC DOOR HISTORIC MARKET SIZE BY COUNTRY
- 8.1.1 SOUTH AMERICA AUTOMATIC DOOR SALES IN VOLUME BY COUNTRY (2018-2023)
- 8.1.2 SOUTH AMERICA AUTOMATIC DOOR SALES IN VALUE BY COUNTRY (2018-2023)
- 8.2 SOUTH AMERICA AUTOMATIC DOOR FORECASTED MARKET SIZE BY COUNTRY
- 8.2.1 SOUTH AMERICA AUTOMATIC DOOR SALES IN VOLUME BY COUNTRY (2024-2029)
- 8.2.2 SOUTH AMERICA AUTOMATIC DOOR SALES IN VALUE BY COUNTRY (2024-2029)
9 MIDDLE EAST AND AFRICA AUTOMATIC DOOR BY COUNTRY
- 9.1 MIDDLE EAST AND AFRICA AUTOMATIC DOOR HISTORIC MARKET SIZE BY COUNTRY
- 9.1.1 MIDDLE EAST AND AFRICA AUTOMATIC DOOR SALES IN VOLUME BY COUNTRY (2018-2023)
- 9.1.2 MIDDLE EAST AND AFRICA AUTOMATIC DOOR SALES IN VALUE BY COUNTRY (2018-2023)
- 9.2 MIDDLE EAST AND AFRICA AUTOMATIC DOOR FORECASTED MARKET SIZE BY COUNTRY
- 9.2.1 MIDDLE EAST AND AFRICA AUTOMATIC DOOR SALES IN VOLUME BY COUNTRY (2024-2029)
- 9.2.2 MIDDLE EAST AND AFRICA AUTOMATIC DOOR SALES IN VALUE BY COUNTRY (2024-2029)
10 COMPANY PROFILES AND KEY FIGURES IN AUTOMATIC DOOR BUSINESS
- 10.1 ASSA ABLOY
- 10.1.1 ASSA ABLOY COMPANY DETAILS
- 10.1.2 COMPANY AND BUSINESS OVERVIEW
- 10.1.3 AUTOMATIC DOOR INTRODUCTION
- 10.1.4 ASSA ABLOY REVENUE, SALES, PRICE AND GROSS MARGIN IN AUTOMATIC DOOR BUSINESS (2018-2023)
- 10.2 NABTESCO
- 10.2.1 NABTESCO COMPANY DETAILS
- 10.2.2 COMPANY AND BUSINESS OVERVIEW
- 10.2.3 AUTOMATIC DOOR INTRODUCTION
- 10.2.4 NABTESCO REVENUE, SALES, PRICE AND GROSS MARGIN IN AUTOMATIC DOOR BUSINESS (2018-2023)
- 10.3 DORMAKABA
- 10.3.1 DORMAKABA COMPANY DETAILS
- 10.3.2 COMPANY AND BUSINESS OVERVIEW
- 10.3.3 AUTOMATIC DOOR INTRODUCTION
- 10.3.4 DORMAKABA REVENUE, SALES, PRICE AND GROSS MARGIN IN AUTOMATIC DOOR BUSINESS (2018-2023)
- 10.4 STANLEY ACCESS TECHNOLOGIES
- 10.4.1 STANLEY ACCESS TECHNOLOGIES COMPANY DETAILS
- 10.4.2 COMPANY AND BUSINESS OVERVIEW
- 10.4.3 AUTOMATIC DOOR INTRODUCTION
- 10.4.4 STANLEY ACCESS TECHNOLOGIES REVENUE, SALES, PRICE AND GROSS MARGIN IN AUTOMATIC DOOR BUSINESS (2018-2023)
- 10.5 HORTON AUTOMATICS
- 10.5.1 HORTON AUTOMATICS COMPANY DETAILS
- 10.5.2 COMPANY AND BUSINESS OVERVIEW
- 10.5.3 AUTOMATIC DOOR INTRODUCTION
- 10.5.4 HORTON AUTOMATICS REVENUE, SALES, PRICE AND GROSS MARGIN IN AUTOMATIC DOOR BUSINESS (2018-2023)
- 10.6 TORMAX
- 10.6.1 TORMAX COMPANY DETAILS
- 10.6.2 COMPANY AND BUSINESS OVERVIEW
- 10.6.3 AUTOMATIC DOOR INTRODUCTION
- 10.6.4 TORMAX REVENUE, SALES, PRICE AND GROSS MARGIN IN AUTOMATIC DOOR BUSINESS (2018-2023)
- 10.7 GEZE
- 10.7.1 GEZE COMPANY DETAILS
- 10.7.2 COMPANY AND BUSINESS OVERVIEW
- 10.7.3 AUTOMATIC DOOR INTRODUCTION
- 10.7.4 GEZE REVENUE, SALES, PRICE AND GROSS MARGIN IN AUTOMATIC DOOR BUSINESS (2018-2023)
- 10.8 PORTALP
- 10.8.1 PORTALP COMPANY DETAILS
- 10.8.2 COMPANY AND BUSINESS OVERVIEW
- 10.8.3 AUTOMATIC DOOR INTRODUCTION
- 10.8.4 PORTALP REVENUE, SALES, PRICE AND GROSS MARGIN IN AUTOMATIC DOOR BUSINESS (2018-2023)
- 10.9 NINGBO OWNIC
- 10.9.1 NINGBO OWNIC COMPANY DETAILS
- 10.9.2 COMPANY AND BUSINESS OVERVIEW
- 10.9.3 AUTOMATIC DOOR INTRODUCTION
- 10.9.4 NINGBO OWNIC REVENUE, SALES, PRICE AND GROSS MARGIN IN AUTOMATIC DOOR BUSINESS (2018-2023)
- 10.10 KBB
- 10.10.1 KBB COMPANY DETAILS
- 10.10.2 COMPANY AND BUSINESS OVERVIEW
- 10.10.3 AUTOMATIC DOOR INTRODUCTION
- 10.10.4 KBB REVENUE, SALES, PRICE AND GROSS MARGIN IN AUTOMATIC DOOR BUSINESS (2018-2023)
- 10.11 SANE BOON
- 10.11.1 SANE BOON COMPANY DETAILS
- 10.11.2 COMPANY AND BUSINESS OVERVIEW
- 10.11.3 AUTOMATIC DOOR INTRODUCTION
- 10.11.4 SANE BOON REVENUE, SALES, PRICE AND GROSS MARGIN IN AUTOMATIC DOOR BUSINESS (2018-2023)
- 10.12 MANUSA
- 10.12.1 MANUSA COMPANY DETAILS
- 10.12.2 COMPANY AND BUSINESS OVERVIEW
- 10.12.3 AUTOMATIC DOOR INTRODUCTION
- 10.12.4 MANUSA REVENUE, SALES, PRICE AND GROSS MARGIN IN AUTOMATIC DOOR BUSINESS (2018-2023)
- 10.13 SHANGHAI PAD
- 10.13.1 SHANGHAI PAD COMPANY DETAILS
- 10.13.2 COMPANY AND BUSINESS OVERVIEW
- 10.13.3 AUTOMATIC DOOR INTRODUCTION
- 10.13.4 SHANGHAI PAD REVENUE, SALES, PRICE AND GROSS MARGIN IN AUTOMATIC DOOR BUSINESS (2018-2023)
- 10.14 FUSO ELECTRIC
- 10.14.1 FUSO ELECTRIC COMPANY DETAILS
- 10.14.2 COMPANY AND BUSINESS OVERVIEW
- 10.14.3 AUTOMATIC DOOR INTRODUCTION
- 10.14.4 FUSO ELECTRIC REVENUE, SALES, PRICE AND GROSS MARGIN IN AUTOMATIC DOOR BUSINESS (2018-2023)
11 UPSTREAM, OPPORTUNITIES, CHALLENGES, RISKS AND INFLUENCES FACTORS ANALYSIS
- 11.1 AUTOMATIC DOOR KEY RAW MATERIALS
- 11.2 PROPORTION OF MANUFACTURING COST STRUCTURE
- 11.3 AUTOMATIC DOOR MARKET DYNAMICS
- 11.3.1 AUTOMATIC DOOR INDUSTRY TRENDS
- 11.3.2 AUTOMATIC DOOR MARKET DRIVERS
- 11.3.3 AUTOMATIC DOOR MARKET CHALLENGES
- 11.3.4 AUTOMATIC DOOR MARKET RESTRAINTS
12 MARKETING STRATEGY ANALYSIS, DISTRIBUTORS
- 12.1 SALES CHANNEL
- 12.2 MARKET POSITIONING
- 12.2.1 PRICING STRATEGY
- 12.2.2 BRAND STRATEGY
- 12.3 DISTRIBUTOR LIST
13 RESEARCH FINDINGS AND CONCLUSION
14 APPENDIX
- 14.1 RESEARCH METHODOLOGY
- 14.1.1 METHODOLOGY/RESEARCH APPROACH
- 14.1.2 DATA SOURCE
- 14.2 AUTHOR DETAILS
- 14.3 DISCLAIMER