|
|
市場調査レポート
商品コード
1279021
プラスチック直接ねじ込みの世界市場の考察、予測(~2029年)Global Direct Screwing into Plastic Market Insights, Forecast to 2029 |
||||||
|
|
|||||||
カスタマイズ可能
適宜更新あり
|
|||||||


| プラスチック直接ねじ込みの世界市場の考察、予測(~2029年) |
|
出版日: 2023年05月25日
発行: QYResearch
ページ情報: 英文 124 Pages
納期: 2~3営業日
|

- 全表示
- 概要
- 図表
- 目次
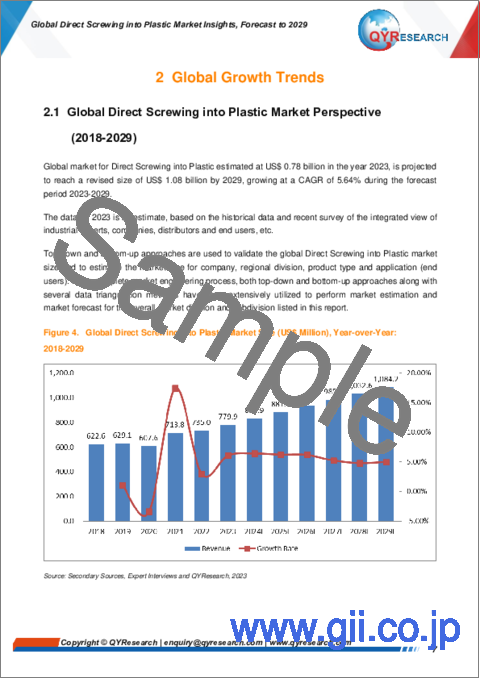
世界のプラスチック直接ねじ込みの市場規模は、2023年の7億8000万米ドルから2029年までに10億8000万米ドルに達し、2023年から2029年の予測期間にCAGRで5.64%の成長が予測されています。
当レポートでは、世界のプラスチック直接ねじ込み市場について調査分析し、市場規模と予測、地域とセグメントの分析、企業プロファイルなどを提供しています。
目次
目次
第1章 レポートの概要
- 調査の範囲
- 市場の分析:タイプ別
- 世界のプラスチック直接ねじ込みの市場の成長率:タイプ別(2018年・2022年・2029年)
- ねじ山形成ねじ
- ねじ切りねじ
- その他
- 市場:用途別
- 世界のプラスチック直接ねじ込みの市場シェア:用途別(2018年・2022年・2029年)
- 熱可塑性
- 熱硬化性
- その他
- 前提条件と制限
- 調査目的
- 考慮された年数
第2章 世界の成長動向
- 世界のプラスチック直接ねじ込み市場の見通し(2018年~2029年)
- 世界のプラスチック直接ねじ込みの成長動向:地域別
- 世界のプラスチック直接ねじ込みの市場規模:地域別(2018年・2022年・2029年)
- プラスチック直接ねじ込みの市場規模の実績:地域別(2018年~2023年)
- プラスチック直接ねじ込みの市場規模の予測:地域別(2024年~2029年)
- プラスチック直接ねじ込みの市場力学
- プラスチック直接ねじ込み業界の動向
- プラスチック直接ねじ込み市場の促進要因
- プラスチック直接ねじ込み市場の課題
- プラスチック直接ねじ込み市場の抑制要因
第3章 競合情勢:主要企業別
- 世界のプラスチック直接ねじ込みの収益:企業別
- 世界のプラスチック直接ねじ込みの収益:企業別(2018年~2023年)
- 世界のプラスチック直接ねじ込みの収益の市場シェア:企業別(2018年~2023年)
- 世界のプラスチック直接ねじ込みの市場シェア:企業タイプ別(Tier 1、Tier 2、Tier 3)
- 世界のプラスチック直接ねじ込みの主要企業、ランキング:収益別(2021年・2022年・2023年)
- 世界のプラスチック直接ねじ込みの市場集中率
- 世界のプラスチック直接ねじ込みの市場集中率(CR5とHHI)
- 世界の上位5企業:プラスチック直接ねじ込みの収益別(2022年)
- 世界のプラスチック直接ねじ込みの主要企業の本社と提供エリア
第4章 プラスチック直接ねじ込みの内訳データ:タイプ別
- 世界のプラスチック直接ねじ込みの市場規模の実績:タイプ別(2018年~2023年)
- 世界のプラスチック直接ねじ込みの市場規模の予測:タイプ別(2024年~2029年)
第5章 プラスチック直接ねじ込みの内訳データ:用途別
- 世界のプラスチック直接ねじ込みの市場規模の実績:用途別(2018年~2023年)
- 世界のプラスチック直接ねじ込みの市場規模の予測:用途別(2024年~2029年)
第6章 北米
- 北米のプラスチック直接ねじ込みの市場規模(2018年~2029年)
- 北米のプラスチック直接ねじ込みの市場規模:タイプ別
- 北米のプラスチック直接ねじ込みの市場規模:タイプ別(2018年~2023年)
- 北米のプラスチック直接ねじ込みの市場規模:タイプ別(2024年~2029年)
- 北米のプラスチック直接ねじ込みの市場シェア:タイプ別(2018年~2029年)
- 北米のプラスチック直接ねじ込みの市場の市場規模:用途別
- 北米のプラスチック直接ねじ込みの市場規模:用途別(2018年~2023年)
- 北米のプラスチック直接ねじ込みの市場規模:用途別(2024年~2029年)
- 北米のプラスチック直接ねじ込みの市場シェア:用途別(2018年~2029年)
- 北米のプラスチック直接ねじ込みの市場規模:国別
- 北米のプラスチック直接ねじ込みの市場規模:国別(2018年・2022年・2029年)
- 北米のプラスチック直接ねじ込みの市場規模:国別(2018年~2023年)
- 北米のプラスチック直接ねじ込みの市場シェア:国別(2024年~2029年)
- 米国
- カナダ
第7章 欧州
- 欧州のプラスチック直接ねじ込みの市場規模(2018年~2029年)
- 欧州のプラスチック直接ねじ込みの市場規模:タイプ別
- 欧州のプラスチック直接ねじ込みの市場のタイプ別(2018年~2023年)
- 欧州のプラスチック直接ねじ込みの市場のタイプ別(2024年~2029年)
- 欧州のプラスチック直接ねじ込みの市場シェア:タイプ別(2018年~2029年)
- 欧州のプラスチック直接ねじ込みの市場の市場規模:用途別
- 欧州のプラスチック直接ねじ込みの市場規模:用途別(2018年~2023年)
- 欧州のプラスチック直接ねじ込みの市場規模:用途別(2024年~2029年)
- 欧州のプラスチック直接ねじ込みの市場シェア:用途別(2018年~2029年)
- 欧州のプラスチック直接ねじ込みの市場規模:国別
- 欧州のプラスチック直接ねじ込みの市場の市場規模:国別(2018年・2022年・2029年)
- 欧州のプラスチック直接ねじ込みの市場規模:国別(2018年~2023年)
- 欧州のプラスチック直接ねじ込みの市場規模:国別(2024年~2029年)
- ドイツ
- フランス
- 英国
- イタリア
- ロシア
第8章 中国
- 中国のプラスチック直接ねじ込みの市場規模(2018年~2029年)
- 中国のプラスチック直接ねじ込みの市場規模:タイプ別
- 中国のプラスチック直接ねじ込みの市場規模:タイプ別(2018年~2023年)
- 中国のプラスチック直接ねじ込みの市場規模:タイプ別(2024年~2029年)
- 中国のプラスチック直接ねじ込みの市場シェア:タイプ別(2018年~2029年)
- 中国のプラスチック直接ねじ込みの市場規模:用途別
- 中国のプラスチック直接ねじ込みの市場規模:用途別(2018年~2023年)
- 中国のプラスチック直接ねじ込みの市場規模:用途別(2024年~2029年)
- 中国のプラスチック直接ねじ込みの市場シェア:用途別(2018年~2029年)
第9章 アジア(中国を除く)
- アジアのプラスチック直接ねじ込みの市場規模(2018年~2029年)
- アジアのプラスチック直接ねじ込みの市場規模:タイプ別
- アジアのプラスチック直接ねじ込みの市場規模:タイプ別(2018年~2023年)
- アジアのプラスチック直接ねじ込みの市場規模:タイプ別(2024年~2029年)
- アジアのプラスチック直接ねじ込みの市場シェア:タイプ別(2018年~2029年)
- アジアのプラスチック直接ねじ込みの市場規模:用途別
- アジアのプラスチック直接ねじ込みの市場規模:用途別(2018年~2023年)
- アジアのプラスチック直接ねじ込みの市場規模:用途別(2024年~2029年)
- アジアのプラスチック直接ねじ込みの市場シェア:用途別(2018年~2029年)
- アジアのプラスチック直接ねじ込みの市場規模:地域別
- アジアのプラスチック直接ねじ込みの市場規模:地域別(2018年・2022年・2029年)
- アジアのプラスチック直接ねじ込みの市場規模:地域別(2018年~2023年)
- アジアのプラスチック直接ねじ込みの市場規模:地域別(2024年~2029年)
- 日本
- 韓国
- 東南アジア
- インド
第10章 中東・アフリカ・ラテンアメリカ
- 中東・アフリカ・ラテンアメリカのプラスチック直接ねじ込みの市場規模(2018年~2029年)
- 中東・アフリカ・ラテンアメリカのプラスチック直接ねじ込みの市場規模:タイプ別
- 中東・アフリカ・ラテンアメリカのプラスチック直接ねじ込みの市場規模:タイプ別(2018年~2023年)
- 中東・アフリカ・ラテンアメリカのプラスチック直接ねじ込みの市場規模:タイプ別(2024年~2029年)
- 中東・アフリカ・ラテンアメリカのプラスチック直接ねじ込みの市場シェア:タイプ別(2018年~2029年)
- 中東・アフリカ・ラテンアメリカのプラスチック直接ねじ込みの市場規模:用途別
- 中東・アフリカ・ラテンアメリカのプラスチック直接ねじ込みの市場規模:用途別(2018年~2023年)
- 中東・アフリカ・ラテンアメリカのプラスチック直接ねじ込みの市場規模:用途別(2024年~2029年)
- 中東・アフリカ・ラテンアメリカのプラスチック直接ねじ込みの市場シェア:用途別(2018年~2029年)
- 中東・アフリカ・ラテンアメリカのプラスチック直接ねじ込みの市場規模:国別
- 中東・アフリカ・ラテンアメリカのプラスチック直接ねじ込みの市場規模:国別(2018年・2022年・2029年)
- 中東・アフリカ・ラテンアメリカのプラスチック直接ねじ込みの市場規模:国別(2018年~2023年)
- 中東・アフリカ・ラテンアメリカのプラスチック直接ねじ込みの市場規模:国別(2024年~2029年)
- ブラジル
- メキシコ
- アルゼンチン
- 中東
- アフリカ
第11章 主要企業のプロファイル
- SFS Group
- EJOT
- Stanley
- Aoyama Seisakusho
- Bulten AB
- Lisi Automotive
- ARNOLD UMFORMTECHNIK GmbH
- AGRATI Group
- RIBE
- Trifast plc
- Wurth
- Bollhoff
- Hans Schriever GmbH & Co. KG
- MUSTAD S.p.A
- Viteria Fusani
第12章 アナリストの視点/結論
第13章 付録
List of Tables
- Table 1. Global Direct Screwing into Plastic Market Size Growth Rate by Type (US$ Million): 2018 VS 2022 VS 2029
- Table 2. Global Direct Screwing into Plastic Market Size Growth by Application (US$ Million): 2018 VS 2022 VS 2029
- Table 3. Global Direct Screwing into Plastic Market Size Growth Rate (CAGR) by Region (US$ Million): 2018 VS 2022 VS 2029
- Table 4. Global Direct Screwing into Plastic Market Size by Region (2018-2023) & (US$ Million)
- Table 5. Global Direct Screwing into Plastic Market Share by Region (2018-2023)
- Table 6. Global Direct Screwing into Plastic Forecasted Market Size by Region (2024-2029) & (US$ Million)
- Table 7. Global Direct Screwing into Plastic Market Share by Region (2024-2029)
- Table 8. Direct Screwing into Plastic Market Trends
- Table 9. Direct Screwing into Plastic Market Drivers
- Table 10. Direct Screwing into Plastic Market Challenges
- Table 11. Direct Screwing into Plastic Market Restraints
- Table 12. Global Direct Screwing into Plastic Revenue by Players (2018-2023) & (US$ Million)
- Table 13. Global Direct Screwing into Plastic Market Share by Players (2018-2023)
- Table 14. Global Top Direct Screwing into Plastic Players by Company Type (Tier 1, Tier 2, and Tier 3) & (based on the Revenue in Direct Screwing into Plastic as of 2021)
- Table 15. Global Direct Screwing into Plastic Industry Ranking 2021 VS 2022 VS 2023
- Table 16. Global 5 Largest Players Market Share by Direct Screwing into Plastic Revenue (CR5 and HHI) & (2018-2023)
- Table 17. Global Key Players of Direct Screwing into Plastic, Headquarters and Area Served
- Table 18. Global Direct Screwing into Plastic Market Size by Type (2018-2023) & (US$ Million)
- Table 19. Global Direct Screwing into Plastic Revenue Market Share by Type (2018-2023)
- Table 20. Global Direct Screwing into Plastic Forecasted Market Size by Type (2024-2029) & (US$ Million)
- Table 21. Global Direct Screwing into Plastic Revenue Market Share by Type (2024-2029)
- Table 22. Global Direct Screwing into Plastic Market Size by Application (2018-2023) & (US$ Million)
- Table 23. Global Direct Screwing into Plastic Revenue Market Share by Application (2018-2023)
- Table 24. Global Direct Screwing into Plastic Forecasted Market Size by Application (2024-2029) & (US$ Million)
- Table 25. Global Direct Screwing into Plastic Revenue Market Share by Application (2024-2029)
- Table 26. North America Direct Screwing into Plastic Market Size by Type (2018-2023) & (US$ Million)
- Table 27. North America Direct Screwing into Plastic Market Size by Type (2024-2029) & (US$ Million)
- Table 28. North America Direct Screwing into Plastic Market Size by Application (2018-2023) & (US$ Million)
- Table 29. North America Direct Screwing into Plastic Market Size by Application (2024-2029) & (US$ Million)
- Table 30. North America Direct Screwing into Plastic Growth Rate (CAGR) by Country (US$ Million): 2018 VS 2022 VS 2029
- Table 31. North America Direct Screwing into Plastic Market Size by Country (2018-2023) & (US$ Million)
- Table 32. North America Direct Screwing into Plastic Market Size by Country (2024-2029) & (US$ Million)
- Table 33. Europe Direct Screwing into Plastic Market Size by Type (2018-2023) & (US$ Million)
- Table 34. Europe Direct Screwing into Plastic Market Size by Type (2024-2029) & (US$ Million)
- Table 35. Europe Direct Screwing into Plastic Market Size by Application (2018-2023) & (US$ Million)
- Table 36. Europe Direct Screwing into Plastic Market Size by Application (2024-2029) & (US$ Million)
- Table 37. Europe Direct Screwing into Plastic Growth Rate (CAGR) by Country (US$ Million): 2018 VS 2022 VS 2029
- Table 38. Europe Direct Screwing into Plastic Market Size by Country (2018-2023) & (US$ Million)
- Table 39. Europe Direct Screwing into Plastic Market Size by Country (2024-2029) & (US$ Million)
- Table 40. China Direct Screwing into Plastic Market Size by Type (2018-2023) & (US$ Million)
- Table 41. China Direct Screwing into Plastic Market Size by Type (2024-2029) & (US$ Million)
- Table 42. China Direct Screwing into Plastic Market Size by Application (2018-2023) & (US$ Million)
- Table 43. China Direct Screwing into Plastic Market Size by Application (2024-2029) & (US$ Million)
- Table 44. Asia Direct Screwing into Plastic Market Size by Type (2018-2023) & (US$ Million)
- Table 45. Asia Direct Screwing into Plastic Market Size by Type (2024-2029) & (US$ Million)
- Table 46. Asia Direct Screwing into Plastic Market Size by Application (2018-2023) & (US$ Million)
- Table 47. Asia Direct Screwing into Plastic Market Size by Application (2024-2029) & (US$ Million)
- Table 48. Asia Direct Screwing into Plastic Growth Rate (CAGR) by Region (US$ Million): 2018 VS 2022 VS 2029
- Table 49. Asia Direct Screwing into Plastic Market Size by Region (2018-2023) & (US$ Million)
- Table 50. Asia Direct Screwing into Plastic Market Size by Region (2024-2029) & (US$ Million)
- Table 51. Middle East, Africa, and Latin America Direct Screwing into Plastic Market Size by Type (2018-2023) & (US$ Million)
- Table 52. Middle East, Africa, and Latin America Direct Screwing into Plastic Market Size by Type (2024-2029) & (US$ Million)
- Table 53. Middle East, Africa, and Latin America Direct Screwing into Plastic Market Size by Application (2018-2023) & (US$ Million)
- Table 54. Middle East, Africa, and Latin America Direct Screwing into Plastic Market Size by Application (2024-2029) & (US$ Million)
- Table 55. Middle East, Africa, and Latin America Direct Screwing into Plastic Growth Rate (CAGR) by Country (US$ Million): 2018 VS 2022 VS 2029
- Table 56. Middle East, Africa, and Latin America Direct Screwing into Plastic Market Size by Country (2018-2023) & (US$ Million)
- Table 57. Middle East, Africa, and Latin America Direct Screwing into Plastic Market Size by Country (2024-2029) & (US$ Million)
- Table 58. SFS Group Company Details
- Table 59. SFS Group Direct Screwing into Plastic Product
- Table 60. SFS Group Revenue in Direct Screwing into Plastic Business (2018-2023) & (US$ Million)
- Table 61. EJOT Company Details
- Table 62. EJOT Direct Screwing into Plastic Product
- Table 63. EJOT Revenue in Direct Screwing into Plastic Business (2018-2023) & (US$ Million)
- Table 64. Stanley Company Details
- Table 65. Stanley Direct Screwing into Plastic Product
- Table 66. Stanley Revenue in Direct Screwing into Plastic Business (2018-2023) & (US$ Million)
- Table 67. Aoyama Seisakusho Company Details
- Table 68. Aoyama Seisakusho Direct Screwing into Plastic Product
- Table 69. Aoyama Seisakusho Revenue in Direct Screwing into Plastic Business (2018-2023) & (US$ Million)
- Table 70. Bulten AB Company Details
- Table 71. Bulten AB Direct Screwing into Plastic Product
- Table 72. Bulten AB Revenue in Direct Screwing into Plastic Business (2018-2023) & (US$ Million)
- Table 73. Lisi Automotive Company Details
- Table 74. Lisi Automotive Direct Screwing into Plastic Product
- Table 75. Lisi Automotive Revenue in Direct Screwing into Plastic Business (2018-2023) & (US$ Million)
- Table 76. ARNOLD UMFORMTECHNIK GmbH Company Details
- Table 77. ARNOLD UMFORMTECHNIK GmbH Direct Screwing into Plastic Product
- Table 78. ARNOLD UMFORMTECHNIK GmbH Revenue in Direct Screwing into Plastic Business (2018-2023) & (US$ Million)
- Table 79. AGRATI Group Company Details
- Table 80. AGRATI Group Direct Screwing into Plastic Product
- Table 81. AGRATI Group Revenue in Direct Screwing into Plastic Business (2018-2023) & (US$ Million)
- Table 82. RIBE Company Details
- Table 83. RIBE Direct Screwing into Plastic Product
- Table 84. RIBE Revenue in Direct Screwing into Plastic Business (2018-2023) & (US$ Million)
- Table 85. Trifast plc Company Details
- Table 86. Trifast plc Direct Screwing into Plastic Product
- Table 87. Trifast plc Revenue in Direct Screwing into Plastic Business (2018-2023) & (US$ Million)
- Table 88. Wurth Company Details
- Table 89. Wurth Direct Screwing into Plastic Product
- Table 90. Wurth Revenue in Direct Screwing into Plastic Business (2018-2023) & (US$ Million)
- Table 91. Bollhoff Company Details
- Table 92. Bollhoff Direct Screwing into Plastic Product
- Table 93. Bollhoff Revenue in Direct Screwing into Plastic Business (2018-2023) & (US$ Million)
- Table 94. Hans Schriever GmbH & Co. KG Company Details
- Table 95. Hans Schriever GmbH & Co. KG Direct Screwing into Plastic Product
- Table 96. Hans Schriever GmbH & Co. KG Revenue in Direct Screwing into Plastic Business (2018-2023) & (US$ Million)
- Table 97. MUSTAD S.p.A Company Details
- Table 98. MUSTAD S.p.A Direct Screwing into Plastic Product
- Table 99. MUSTAD S.p.A Revenue in Direct Screwing into Plastic Business (2018-2023) & (US$ Million)
- Table 100. Viteria Fusani Company Details
- Table 101. Viteria Fusani Direct Screwing into Plastic Product
- Table 102. Viteria Fusani Revenue in Direct Screwing into Plastic Business (2018-2023) & (US$ Million)
- Table 103. Research Programs/Design for This Report
- Table 104. Key Data Information from Secondary Sources
- Table 105. Key Data Information from Primary Sources
- Table 106. QYR Business Unit and Senior & Team Lead Analysts
List of Figures
- Figure 1. Global Direct Screwing into Plastic Market Share by Type: 2022 VS 2029
- Figure 2. Global Direct Screwing into Plastic Market Share by Application: 2022 VS 2029
- Figure 3. Direct Screwing into Plastic Report Years Considered
- Figure 4. Global Direct Screwing into Plastic Market Size (US$ Million), Year-over-Year: 2018-2029
- Figure 5. Global Direct Screwing into Plastic Market Size, (US$ Million), 2018 VS 2022 VS 2029
- Figure 6. Global Direct Screwing into Plastic Market Share by Region: 2022 VS 2029
- Figure 7. The Top 5 Players Market Share by Direct Screwing into Plastic Revenue in 2022
- Figure 8. North America Direct Screwing into Plastic Market Size YoY Growth (2018-2029) & (US$ Million)
- Figure 9. North America Direct Screwing into Plastic Market Share by Type (2018-2029)
- Figure 10. North America Direct Screwing into Plastic Market Share by Application (2018-2029)
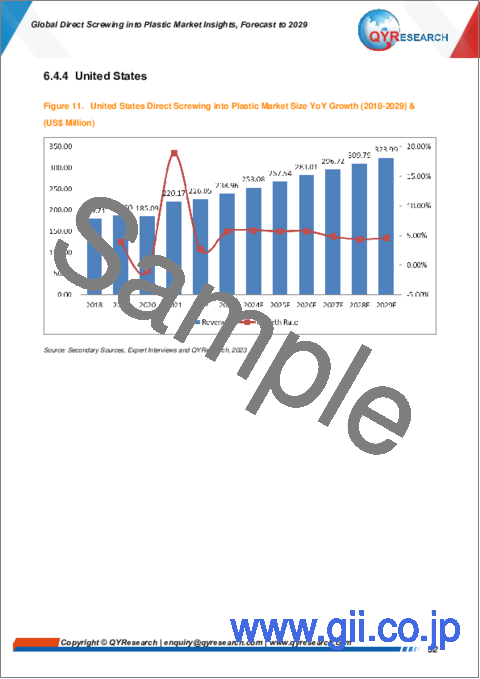
- Figure 11. United States Direct Screwing into Plastic Market Size YoY Growth (2018-2029) & (US$ Million)
- Figure 12. Canada Direct Screwing into Plastic Market Size YoY Growth (2018-2029) & (US$ Million)
- Figure 13. Europe Direct Screwing into Plastic Market Size YoY Growth (2018-2029) & (US$ Million)
- Figure 14. Europe Direct Screwing into Plastic Market Share by Type (2018-2029)
- Figure 15. Europe Direct Screwing into Plastic Market Share by Application (2018-2029)
- Figure 16. Germany Direct Screwing into Plastic Market Size YoY Growth (2018-2029) & (US$ Million)
- Figure 17. France Direct Screwing into Plastic Market Size YoY Growth (2018-2029) & (US$ Million)
- Figure 18. U.K. Direct Screwing into Plastic Market Size YoY Growth (2018-2029) & (US$ Million)
- Figure 19. Italy Direct Screwing into Plastic Market Size YoY Growth (2018-2029) & (US$ Million)
- Figure 20. Russia Direct Screwing into Plastic Market Size YoY Growth (2018-2029) & (US$ Million)
- Figure 21. China Direct Screwing into Plastic Market Size YoY Growth (2018-2029) & (US$ Million)
- Figure 22. China Direct Screwing into Plastic Market Share by Type (2018-2029)
- Figure 23. China Direct Screwing into Plastic Market Share by Application (2018-2029)
- Figure 24. Asia Direct Screwing into Plastic Market Size YoY Growth (2018-2029) & (US$ Million)
- Figure 25. Asia Direct Screwing into Plastic Market Share by Type (2018-2029)
- Figure 26. Asia Direct Screwing into Plastic Market Share by Application (2018-2029)
- Figure 27. Japan Direct Screwing into Plastic Market Size YoY Growth (2018-2029) & (US$ Million)
- Figure 28. South Korea Direct Screwing into Plastic Market Size YoY Growth (2018-2029) & (US$ Million)
- Figure 29. Southeast Asia Direct Screwing into Plastic Market Size YoY Growth (2018-2029) & (US$ Million)
- Figure 30. India Direct Screwing into Plastic Market Size YoY Growth (2018-2029) & (US$ Million)
- Figure 31. Middle East, Africa, and Latin America Direct Screwing into Plastic Market Size YoY Growth (2018-2029) & (US$ Million)
- Figure 32. Middle East, Africa, and Latin America Direct Screwing into Plastic Market Share by Type (2018-2029)
- Figure 33. Middle East, Africa, and Latin America Direct Screwing into Plastic Market Share by Application (2018-2029)
- Figure 34. Brazil Direct Screwing into Plastic Market Size YoY Growth (2018-2029) & (US$ Million)
- Figure 35. Mexico Direct Screwing into Plastic Market Size YoY Growth (2018-2029) & (US$ Million)
- Figure 36. Argentina Direct Screwing into Plastic Market Size YoY Growth (2018-2029) & (US$ Million)
- Figure 37. Middle East Direct Screwing into Plastic Market Size YoY Growth (2018-2029) & (US$ Million)
- Figure 38. Africa Direct Screwing into Plastic Market Size YoY Growth (2018-2029) & (US$ Million)
- Figure 39. Bottom-up and Top-down Approaches for This Report
- Figure 40. Data Triangulation
- Figure 41. Key Executives Interviewed
Market Analysis and Insights:
Due to the COVID-19 pandemic and Russia-Ukraine War Influence, the global market for Direct Screwing into Plastic estimated at US$ 0.78 billion in the year 2023, is projected to reach a revised size of US$ 1.08 million by 2029, growing at a CAGR of 5.64% during the forecast period 2023-2029.
The global key companies of Direct Screwing into Plastic include: SFS Group, EJOT, Stanley, Aoyama Seisakusho, Bulten AB, etc. In 2022, the global top five players had a share approximately 28.07% in terms of revenue.
Report Includes:
This report presents an overview of global market for Direct Screwing into Plastic market size. The report analyses of the global market trends, with historic market revenue data for 2018-2022, estimates for 2023, and projections of CAGR through 2029.
This report researches the key producers of Direct Screwing into Plastic, also provides the revenue of main regions and countries. The report highlights of the upcoming market potential for Direct Screwing into Plastic, and key regions/countries of focus to forecast this market into various segments and sub-segments. Country specific data and market value analysis for the U.S., Canada, Mexico, Brazil, China, Japan, South Korea, Southeast Asia, India, Germany, the U.K., Italy, Middle East, Africa, and Other Countries.
This report focuses on the Direct Screwing into Plastic revenue, market share and industry ranking of main companies, data from 2018 to 2023. Identification of the major stakeholders in the global Direct Screwing into Plastic market, and analysis of their competitive landscape and market positioning based on recent developments and segmental revenues. This report will help stakeholders to understand the competitive landscape and gain more insights and position their businesses and market strategies in a better way.
This report analyzes the segments data by Type and by Application, revenue, and growth rate, from 2018 to 2029. Evaluation and forecast the market size for Direct Screwing into Plastic revenue, projected growth trends, production technology, application and end-user industry.
Descriptive company profiles of the major global players, including Wurth, Stanley, CELO, Bossard Group, Bollhoff, EJOT, MUSTAD S.p.A, Trifast plc, and SAIMA CORPORATION, etc.
By Company
- SFS Group
- EJOT
- Stanley
- Aoyama Seisakusho
- Bulten AB
- Lisi Automotive
- ARNOLD UMFORMTECHNIK GmbH
- Agrati
- Richard Bergner Holding GmbH & Co. KG (RIBE)
- Trifast plc
- Wurth
- Bollhoff
- Hans Schriever GmbH & Co. KG
- MUSTAD S.p.A
- Viteria Fusani
Segment by Type
- Thread Forming Screws
- Thread Cutting Screws
Segment by Application
- Thermoplastics
- Thermosets
By Region
- North America
- United States
- Canada
- China
- Asia (excluding China)
- Japan
- India
- Southeast Asia
- Korea
- Others
- Europe
- Germany
- France
- U.K.
- Italy
- Russia
- Rest of Europe
- Middle East, Africa, and Latin America
- Mexico
- Brazil
- Argentina
- Middle East
- Africa
- Others
Chapter Outline
- Chapter 1: Introduces the report scope of the report, executive summary of different market segments (product type, application, etc), including the market size of each market segment, future development potential, and so on. It offers a high-level view of the current state of the market and its likely evolution in the short to mid-term, and long term.
- Chapter 2: Revenue of Direct Screwing into Plastic in global and regional level. It provides a quantitative analysis of the market size and development potential of each region and its main countries and introduces the market development, future development prospects, market space, and capacity of each country in the world. This section also introduces the market dynamics, latest developments of the market, the driving factors and restrictive factors of the market, the challenges and risks faced by companies in the industry, and the analysis of relevant policies in the industry.
- Chapter 3: Detailed analysis of Direct Screwing into Plastic companies' competitive landscape, revenue, market share and industry ranking, latest development plan, merger, and acquisition information, etc.
- Chapter 4: Provides the analysis of various market segments by Type, covering the revenue, and development potential of each market segment, to help readers find the blue ocean market in different market segments.
- Chapter 5: Provides the analysis of various market segments by Application, covering the revenue, and development potential of each market segment, to help readers find the blue ocean market in different downstream markets.
- Chapter 6: North America (US & Canada) by Type, by Application and by country, revenue for each segment.
- Chapter 7: Europe by Type, by Application and by country, revenue for each segment.
- Chapter 8: China by Type, and by Application, revenue for each segment.
- Chapter 9: Asia (excluding China) by Type, by Application and by region, revenue for each segment.
- Chapter 10: Middle East, Africa, and Latin America by Type, by Application and by country, revenue for each segment.
- Chapter 11: Provides profiles of key companies, introducing the basic situation of the main companies in the market in detail, including product descriptions and specifications, Direct Screwing into Plastic revenue, gross margin, etc.
- Chapter 12: Analyst's Viewpoints/Conclusions
Table of Contents
1 Report Overview
- 1.1 Study Scope
- 1.2 Market Analysis by Type
- 1.2.1 Global Direct Screwing into Plastic Market Size Growth Rate by Type: 2018 VS 2022 VS 2029
- 1.2.2 Thread Forming Screws
- 1.2.3 Thread Cutting Screws
- 1.3 Market by Application
- 1.3.1 Global Direct Screwing into Plastic Market Share by Application: 2018 VS 2022 VS 2029
- 1.3.2 Thermoplastics
- 1.3.3 Thermosets
- 1.4 Assumptions and Limitations
- 1.5 Study Objectives
- 1.6 Years Considered
2 Global Growth Trends
- 2.1 Global Direct Screwing into Plastic Market Perspective (2018-2029)
- 2.2 Global Direct Screwing into Plastic Growth Trends by Region
- 2.2.1 Global Direct Screwing into Plastic Market Size by Region: 2018 VS 2022 VS 2029
- 2.2.2 Direct Screwing into Plastic Historic Market Size by Region (2018-2023)
- 2.2.3 Direct Screwing into Plastic Forecasted Market Size by Region (2024-2029)
- 2.3 Direct Screwing into Plastic Market Dynamics
- 2.3.1 Direct Screwing into Plastic Industry Trends
- 2.3.2 Direct Screwing into Plastic Market Drivers
- 2.3.3 Direct Screwing into Plastic Market Challenges
- 2.3.4 Direct Screwing into Plastic Market Restraints
3 Competition Landscape by Key Players
- 3.1 Global Revenue Direct Screwing into Plastic by Players
- 3.1.1 Global Direct Screwing into Plastic Revenue by Players (2018-2023)
- 3.1.2 Global Direct Screwing into Plastic Revenue Market Share by Players (2018-2023)
- 3.2 Global Direct Screwing into Plastic Market Share by Company Type (Tier 1, Tier 2, and Tier 3)
- 3.3 Global Key Players of Direct Screwing into Plastic, Ranking by Revenue, 2021 VS 2022 VS 2023
- 3.4 Global Direct Screwing into Plastic Market Concentration Ratio
- 3.4.1 Global Direct Screwing into Plastic Market Concentration Ratio (CR5 and HHI)
- 3.4.2 Global Top 5 Companies by Direct Screwing into Plastic Revenue in 2022
- 3.5 Global Key Players of Direct Screwing into Plastic Head office and Area Served
4 Direct Screwing into Plastic Breakdown Data by Type
- 4.1 Global Direct Screwing into Plastic Historic Market Size by Type (2018-2023)
- 4.2 Global Direct Screwing into Plastic Forecasted Market Size by Type (2024-2029)
5 Direct Screwing into Plastic Breakdown Data by Application
- 5.1 Global Direct Screwing into Plastic Historic Market Size by Application (2018-2023)
- 5.2 Global Direct Screwing into Plastic Forecasted Market Size by Application (2024-2029)
6 North America
- 6.1 North America Direct Screwing into Plastic Market Size (2018-2029)
- 6.2 North America Direct Screwing into Plastic Market Size by Type
- 6.2.1 North America Direct Screwing into Plastic Market Size by Type (2018-2023)
- 6.2.2 North America Direct Screwing into Plastic Market Size by Type (2024-2029)
- 6.2.3 North America Direct Screwing into Plastic Market Share by Type (2018-2029)
- 6.3 North America Direct Screwing into Plastic Market Size by Application
- 6.3.1 North America Direct Screwing into Plastic Market Size by Application (2018-2023)
- 6.3.2 North America Direct Screwing into Plastic Market Size by Application (2024-2029)
- 6.3.3 North America Direct Screwing into Plastic Market Share by Application (2018-2029)
- 6.4 North America Direct Screwing into Plastic Market Size by Country
- 6.4.1 North America Direct Screwing into Plastic Market Size by Country: 2018 VS 2022 VS 2029
- 6.4.2 North America Direct Screwing into Plastic Market Size by Country (2018-2023)
- 6.4.3 North America Direct Screwing into Plastic Market Share by Country (2024-2029)
- 6.4.4 United States
- 6.4.5 Canada
7 Europe
- 7.1 Europe Direct Screwing into Plastic Market Size (2018-2029)
- 7.2 Europe Direct Screwing into Plastic Market Size by Type
- 7.2.1 Europe Direct Screwing into Plastic Market Size by Type (2018-2023)
- 7.2.2 Europe Direct Screwing into Plastic Market Size by Type (2024-2029)
- 7.2.3 Europe Direct Screwing into Plastic Market Share by Type (2018-2029)
- 7.3 Europe Direct Screwing into Plastic Market Size by Application
- 7.3.1 Europe Direct Screwing into Plastic Market Size by Application (2018-2023)
- 7.3.2 Europe Direct Screwing into Plastic Market Size by Application (2024-2029)
- 7.3.3 Europe Direct Screwing into Plastic Market Share by Application (2018-2029)
- 7.4 Europe Direct Screwing into Plastic Market Size by Country
- 7.4.1 Europe Direct Screwing into Plastic Market Size by Country: 2018 VS 2022 VS 2029
- 7.4.2 Europe Direct Screwing into Plastic Market Size by Country (2018-2023)
- 7.4.3 Europe Direct Screwing into Plastic Market Size by Country (2024-2029)
- 7.4.4 Germany
- 7.4.5 France
- 7.4.6 U.K.
- 7.4.7 Italy
- 7.4.8 Russia
8 China
- 8.1 China Direct Screwing into Plastic Market Size (2018-2029)
- 8.2 China Direct Screwing into Plastic Market Size by Type
- 8.2.1 China Direct Screwing into Plastic Market Size by Type (2018-2023)
- 8.2.2 China Direct Screwing into Plastic Market Size by Type (2024-2029)
- 8.2.3 China Direct Screwing into Plastic Market Share by Type (2018-2029)
- 8.3 China Direct Screwing into Plastic Market Size by Application
- 8.3.1 China Direct Screwing into Plastic Market Size by Application (2018-2023)
- 8.3.2 China Direct Screwing into Plastic Market Size by Application (2024-2029)
- 8.3.3 China Direct Screwing into Plastic Market Share by Application (2018-2029)
9 Asia (excluding China)
- 9.1 Asia Direct Screwing into Plastic Market Size (2018-2029)
- 9.2 Asia Direct Screwing into Plastic Market Size by Type
- 9.2.1 Asia Direct Screwing into Plastic Market Size by Type (2018-2023)
- 9.2.2 Asia Direct Screwing into Plastic Market Size by Type (2024-2029)
- 9.2.3 Asia Direct Screwing into Plastic Market Share by Type (2018-2029)
- 9.3 Asia Direct Screwing into Plastic Market Size by Application
- 9.3.1 Asia Direct Screwing into Plastic Market Size by Application (2018-2023)
- 9.3.2 Asia Direct Screwing into Plastic Market Size by Application (2024-2029)
- 9.3.3 Asia Direct Screwing into Plastic Market Share by Application (2018-2029)
- 9.4 Asia Direct Screwing into Plastic Market Size by Region
- 9.4.1 Asia Direct Screwing into Plastic Market Size by Region: 2018 VS 2022 VS 2029
- 9.4.2 Asia Direct Screwing into Plastic Market Size by Region (2018-2023)
- 9.4.3 Asia Direct Screwing into Plastic Market Size by Region (2024-2029)
- 9.4.4 Japan
- 9.4.5 South Korea
- 9.4.6 Southeast Asia
- 9.4.7 India
10 Middle East, Africa, and Latin America
- 10.1 Middle East, Africa, and Latin America Direct Screwing into Plastic Market Size (2018-2029)
- 10.2 Middle East, Africa, and Latin America Direct Screwing into Plastic Market Size by Type
- 10.2.1 Middle East, Africa, and Latin America Direct Screwing into Plastic Market Size by Type (2018-2023)
- 10.2.2 Middle East, Africa, and Latin America Direct Screwing into Plastic Market Size by Type (2024-2029)
- 10.2.3 Middle East, Africa, and Latin America Direct Screwing into Plastic Market Share by Type (2018-2029)
- 10.3 Middle East, Africa, and Latin America Direct Screwing into Plastic Market Size by Application
- 10.3.1 Middle East, Africa, and Latin America Direct Screwing into Plastic Market Size by Application (2018-2023)
- 10.3.2 Middle East, Africa, and Latin America Direct Screwing into Plastic Market Size by Application (2024-2029)
- 10.3.3 Middle East, Africa, and Latin America Direct Screwing into Plastic Market Share by Application (2018-2029)
- 10.4 Middle East, Africa, and Latin America Direct Screwing into Plastic Market Size by Country
- 10.4.1 Middle East, Africa, and Latin America Direct Screwing into Plastic Market Size by Country: 2018 VS 2022 VS 2029
- 10.4.2 Middle East, Africa, and Latin America Direct Screwing into Plastic Market Size by Country (2018-2023)
- 10.4.3 Middle East, Africa, and Latin America Direct Screwing into Plastic Market Size by Country (2024-2029)
- 10.4.4 Brazil
- 10.4.5 Mexico
- 10.4.6 Argentina
- 10.4.7 Middle East
- 10.4.8 Africa
11 Key Players Profiles
- 11.1 SFS Group
- 11.1.1 SFS Group Company Details
- 11.1.2 SFS Group Business Overview
- 11.1.3 SFS Group Direct Screwing into Plastic Introduction
- 11.1.4 SFS Group Revenue in Direct Screwing into Plastic Business (2018-2023)
- 11.2 EJOT
- 11.2.1 EJOT Company Details
- 11.2.2 EJOT Business Overview
- 11.2.3 EJOT Direct Screwing into Plastic Introduction
- 11.2.4 EJOT Revenue in Direct Screwing into Plastic Business (2018-2023)
- 11.3 Stanley
- 11.3.1 Stanley Company Details
- 11.3.2 Stanley Business Overview
- 11.3.3 Stanley Direct Screwing into Plastic Introduction
- 11.3.4 Stanley Revenue in Direct Screwing into Plastic Business (2018-2023)
- 11.4 Aoyama Seisakusho
- 11.4.1 Aoyama Seisakusho Company Details
- 11.4.2 Aoyama Seisakusho Business Overview
- 11.4.3 Aoyama Seisakusho Direct Screwing into Plastic Introduction
- 11.4.4 Aoyama Seisakusho Revenue in Direct Screwing into Plastic Business (2018-2023)
- 11.5 Bulten AB
- 11.5.1 Bulten AB Company Details
- 11.5.2 Bulten AB Business Overview
- 11.5.3 Bulten AB Direct Screwing into Plastic Introduction
- 11.5.4 Bulten AB Revenue in Direct Screwing into Plastic Business (2018-2023)
- 11.6 Lisi Automotive
- 11.6.1 Lisi Automotive Company Details
- 11.6.2 Lisi Automotive Business Overview
- 11.6.3 Lisi Automotive Direct Screwing into Plastic Introduction
- 11.6.4 Lisi Automotive Revenue in Direct Screwing into Plastic Business (2018-2023)
- 11.7 ARNOLD UMFORMTECHNIK GmbH
- 11.7.1 ARNOLD UMFORMTECHNIK GmbH Company Details
- 11.7.2 ARNOLD UMFORMTECHNIK GmbH Business Overview
- 11.7.3 ARNOLD UMFORMTECHNIK GmbH Direct Screwing into Plastic Introduction
- 11.7.4 ARNOLD UMFORMTECHNIK GmbH Revenue in Direct Screwing into Plastic Business (2018-2023)
- 11.8 AGRATI Group
- 11.8.1 AGRATI Group Company Details
- 11.8.2 AGRATI Group Business Overview
- 11.8.3 AGRATI Group Direct Screwing into Plastic Introduction
- 11.8.4 AGRATI Group Revenue in Direct Screwing into Plastic Business (2018-2023)
- 11.9 RIBE
- 11.9.1 RIBE Company Details
- 11.9.2 RIBE Business Overview
- 11.9.3 RIBE Direct Screwing into Plastic Introduction
- 11.9.4 RIBE Revenue in Direct Screwing into Plastic Business (2018-2023)
- 11.10 Trifast plc
- 11.10.1 Trifast plc Company Details
- 11.10.2 Trifast plc Business Overview
- 11.10.3 Trifast plc Direct Screwing into Plastic Introduction
- 11.10.4 Trifast plc Revenue in Direct Screwing into Plastic Business (2018-2023)
- 11.11 Wurth
- 11.11.1 Wurth Company Details
- 11.11.2 Wurth Business Overview
- 11.11.3 Wurth Direct Screwing into Plastic Introduction
- 11.11.4 Wurth Revenue in Direct Screwing into Plastic Business (2018-2023)
- 11.12 Bollhoff
- 11.12.1 Bollhoff Company Details
- 11.12.2 Bollhoff Business Overview
- 11.12.3 Bollhoff Direct Screwing into Plastic Introduction
- 11.12.4 Bollhoff Revenue in Direct Screwing into Plastic Business (2018-2023)
- 11.13 Hans Schriever GmbH & Co. KG
- 11.13.1 Hans Schriever GmbH & Co. KG Company Details
- 11.13.2 Hans Schriever GmbH & Co. KG Business Overview
- 11.13.3 Hans Schriever GmbH & Co. KG Direct Screwing into Plastic Introduction
- 11.13.4 Hans Schriever GmbH & Co. KG Revenue in Direct Screwing into Plastic Business (2018-2023)
- 11.14 MUSTAD S.p.A
- 11.14.1 MUSTAD S.p.A Company Details
- 11.14.2 MUSTAD S.p.A Business Overview
- 11.14.3 MUSTAD S.p.A Direct Screwing into Plastic Introduction
- 11.14.4 MUSTAD S.p.A Revenue in Direct Screwing into Plastic Business (2018-2023)
- 11.15 Viteria Fusani
- 11.15.1 Viteria Fusani Company Details
- 11.15.2 Viteria Fusani Business Overview
- 11.15.3 Viteria Fusani Direct Screwing into Plastic Introduction
- 11.15.4 Viteria Fusani Revenue in Direct Screwing into Plastic Business (2018-2023)
12 Analyst's Viewpoints/Conclusions
13 Appendix
- 13.1 Research Methodology
- 13.1.1 Methodology/Research Approach
- 13.1.2 Data Source
- 13.2 Author Details
- 13.3 Disclaimer