|
|
市場調査レポート
商品コード
1254629
世界と米国の食品接触消泡剤市場:分析・予測 (2023年~2029年)Global and United States Food Contact Defoamers Market Report & Forecast 2023-2029 |
||||||
|
|
|||||||
|
● お客様のご希望に応じて、既存データの加工や未掲載情報(例:国別セグメント)の追加などの対応が可能です。 詳細はお問い合わせください。 |
|||||||


| 世界と米国の食品接触消泡剤市場:分析・予測 (2023年~2029年) |
|
出版日: 2023年04月10日
発行: QYResearch
ページ情報: 英文 151 Pages
納期: 2~3営業日
|
- 全表示
- 概要
- 図表
- 目次
世界の食品接触消泡剤の収益は、2022年に8億8,352万米ドルに達し、予測期間中 (2023年~2029年) に5.94%のCAGRで成長し、2029年までに12億6,840万米ドルの再調整サイズに達すると予測されます。
米国の食品接触消泡剤の市場規模は、2023年の2億4,859万米ドルから、2029年には3億2,830万米ドルに成長し、予測期間中のCAGRは4.74%と予測されています。
目次
第1章 分析範囲
- 食品接触消泡剤:製品概略
- 世界の食品接触消泡剤市場の見通し (2018年・2022年・2029年)
- 販売額 (単位:100万米ドル、2018年~2029年)
- 販売量 (2018年~2029年)
- 米国の食品接触消泡剤市場の見通し (2018年・2022年・2029年)
- 販売額 (単位:100万米ドル、2018年~2029年)
- 販売量 (2018年~2029年)
- 食品接触消泡剤の市場規模:米国・世界 (2018年・2022年・2029年)
- 米国の市場シェア vs 世界 (2018年・2022年・2029年)
- 市場成長率:米国 vs 世界 (2018年・2022年・2029年)
- 食品接触消泡剤の市場力学
- 食品接触消泡剤業界の動向
- 食品接触消泡剤市場の促進要因
- 食品接触消泡剤市場の課題と抑制要因
- 前提・制約条件
- 分析対象
- 分析期間
第2章 食品接触消泡剤市場:種類別
- 食品接触消泡剤市場:種類別
- シリコーン系消泡剤
- ポリマー系消泡剤
- その他
- 世界の食品接触消泡剤の市場規模:種類別
- 販売額:種類別 (2018年・2022年・2029年)
- 販売量:種類別 (2018年・2022年・2029年)
- 米国の食品接触消泡剤の市場規模:種類別
- 販売額:種類別 (2018年・2022年・2029年)
- 販売量:種類別 (2018年・2022年・2029年)
第3章 食品接触消泡剤市場:用途別
- 用途別の市場セグメント
- 食品加工
- 砂糖産業
- 発酵産業
- 食品接触包装
- 世界の食品接触消泡剤の市場規模:用途別
- 販売額:用途別 (2018年・2022年・2029年)
- 販売量:用途別 (2018年・2022年・2029年)
- 米国の食品接触消泡剤の市場規模:用途別
- 販売額:用途別 (2018年・2022年・2029年)
- 販売量:用途別 (2018年・2022年・2029年)
第4章 世界の食品接触消泡剤市場:企業別の競合情勢
- 世界の食品接触消泡剤の市場規模:企業別
- 世界の食品接触消泡剤の主要メーカー:収益ランキング (2022年)
- 世界の食品接触消泡剤の収益:メーカー別 (2018年~2023年)
- 世界の食品接触消泡剤の販売:メーカー別 (2018年~2023年)
- 世界の食品接触消泡剤の価格:メーカー別 (2018年~2023年)
- 世界の食品接触消泡剤市場の集中度 (CR)
- 世界の食品接触消泡剤企業の製造拠点・本社
- 世界の食品接触消泡剤企業の主力製品とその用途
- 世界の食品接触消泡剤企業の設立時期
- 米国の食品接触消泡剤の市場規模:企業別
- 米国の食品接触消泡剤の主要企業:収益ランキング (2022年)
- 米国の食品接触消泡剤の収益:企業別 (2021年~2023年)
- 米国の食品接触消泡剤の販売:企業別 (2021年~2023年)
第5章 世界の食品接触消泡剤の市場規模:地域別
- 世界の食品接触消泡剤市場規模:地域別 (2018年・2022年・2029年)
- 世界の食品接触消泡剤市場規模:地域別 (数量、2018年~2029年)
- 世界の食品接触消泡剤市場規模:地域別 (金額、2018年~2029年)
第6章 地域レベル・国レベルのセグメント
- 北米
- 米国
- カナダ
- 欧州
- ドイツ
- フランス
- 英国
- イタリア
- ロシア
- アジア太平洋
- 中国
- 日本
- 韓国
- インド
- オーストラリア
- 台湾
- 東南アジア
- ラテンアメリカ
- メキシコ
- ブラジル
- アルゼンチン
- 中東・アフリカ
- GCC諸国
- トルコ
- アフリカ
第7章 企業プロファイル
- Dow
- Wacker Chemie
- Elkem
- BASF
- Shin-Etsu Chemical
- Momentive Performance Materials
- DyStar Group
- CHT Group
- LEVACO Chemicals
- BRB International
- Siltech
- Resil Chemicals
- PMC Ouvrie
- Munzing Chemie
- Blackburn Chemicals
- PennWhite
- Shanghai Liqi
- Jiangsu Sixin
第8章 産業チェーンと販売チャネルの分析
- 食品接触消泡剤の産業チェーン分析
- 食品接触消泡剤の主要原材料
- 製造コストの構造比率
- 食品接触消泡剤の販売とマーケティング
- 食品接触消泡剤の顧客
第9章 調査結果と結論
第10章 付録
List of Tables
- Table 1. Food Contact Defoamers CAGR in Value, United States VS Global, 2018 VS 2022 VS 2029
- Table 2. Food Contact Defoamers Market Trends
- Table 3. Food Contact Defoamers Market Drivers
- Table 4. Food Contact Defoamers Market Challenges and Restraints
- Table 5. Global Food Contact Defoamers Sales Growth Rate (CAGR) by Type: 2018 VS 2022 VS 2029 (US$ Million)
- Table 6. United States Food Contact Defoamers Sales Growth Rate (CAGR) by Type: 2018 VS 2022 VS 2029 (US$ Million)
- Table 7. Global Food Contact Defoamers Sales Growth Rate (CAGR) by Application: 2018 VS 2022 VS 2029 (US$ Million)
- Table 8. United States Food Contact Defoamers Sales Growth Rate (CAGR) by Application: 2018 VS 2022 VS 2029 (US$ Million)
- Table 9. Global Key Manufacturers of Food Contact Defoamers, Ranked by Revenue (2022) & (US$ Million)
- Table 10. Global Food Contact Defoamers Revenue by Manufacturer, (US$ Million) & (2018-2023)
- Table 11. Global Food Contact Defoamers Revenue Share by Manufacturer, 2018-2023
- Table 12. Global Food Contact Defoamers Sales by Manufacturer, (Tons), 2018-2023
- Table 13. Global Food Contact Defoamers Sales Share by Manufacturer, 2018-2023
- Table 14. Global Food Contact Defoamers Price by Manufacturer (2018-2023) & (US$/Ton)
- Table 15. Global Food Contact Defoamers Manufacturers Market Concentration Ratio (CR5 and HHI)
- Table 16. Global Food Contact Defoamers by Company Type (Tier 1, Tier 2, and Tier 3) & (based on the Revenue in Food Contact Defoamers as of 2022)
- Table 17. Global Key Manufacturers of Food Contact Defoamers, Manufacturing Base Distribution and Headquarters
- Table 18. Global Key Manufacturers of Food Contact Defoamers Product Offered
- Table 19. Global Key Manufacturers of Food Contact Defoamers, Date of Establishment
- Table 20. Key Players of Food Contact Defoamers in United States, Ranked by Revenue (2022) & (US$ million)
- Table 21. United States Food Contact Defoamers Revenue by Players, (US$ Million) & (2021-2023)
- Table 22. United States Food Contact Defoamers Revenue Share by Players, (2021-2023)
- Table 23. United States Food Contact Defoamers Sales by Players, (Tons) & (2021-2023)
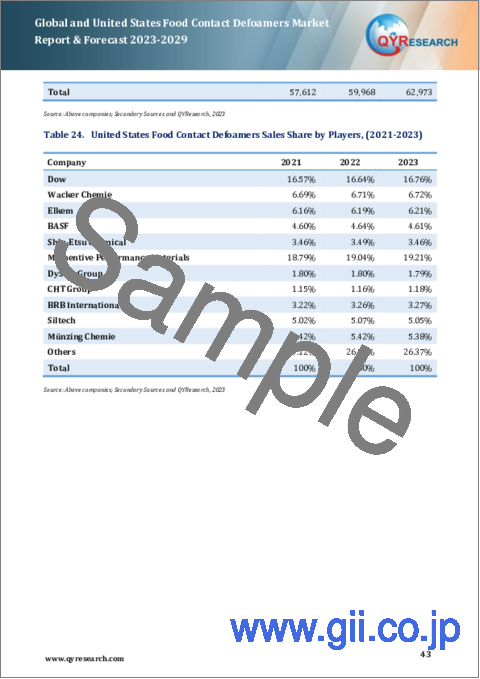
- Table 24. United States Food Contact Defoamers Sales Share by Players, (2021-2023)
- Table 25. Global Food Contact Defoamers Market Size by Region (US$ Million): 2018 VS 2022 VS 2029
- Table 26. Global Food Contact Defoamers Sales in Volume by Region (2018-2023) & (Tons)
- Table 27. Global Food Contact Defoamers Sales in Volume Forecast by Region (2024-2029) & (Tons)
- Table 28. Global Food Contact Defoamers Sales in Value by Region (2018-2023) & (US$ Million)
- Table 29. Global Food Contact Defoamers Sales in Value Forecast by Region (2024-2029) & (US$ Million)
- Table 30. North America Food Contact Defoamers Sales in Volume by Country (2018-2029) & (Tons)
- Table 31. North America Food Contact Defoamers Sales in Value by Country (2018-2029) & (US$ Million)
- Table 32. Europe Food Contact Defoamers Sales in Volume by Country (2018-2029) & (Tons)
- Table 33. Europe Food Contact Defoamers Sales in Value by Country (2018-2029) & (US$ Million)
- Table 34. Asia-Pacific Food Contact Defoamers Sales in Volume by Region (2018-2029) & (Tons)
- Table 35. Asia-Pacific Food Contact Defoamers Sales in Value by Region (2018-2029) & (US$ Million)
- Table 36. Latin America Food Contact Defoamers Sales in Volume by Country (2018-2029) & (Tons)
- Table 37. Latin America Food Contact Defoamers Sales in Value by Country (2018-2029) & (US$ Million)
- Table 38. Middle East and Africa Food Contact Defoamers Sales in Volume by Region (2018-2029) & (Tons)
- Table 39. Middle East and Africa Food Contact Defoamers Sales in Value by Region (2018-2029) & (US$ Million)
- Table 40. Dow Corporation Information
- Table 41. Dow Food Contact Defoamers Sales (Tons), Revenue (US$ Million), Price (US$/Ton) and Gross Margin (2018-2023)
- Table 42. Dow Food Contact Defoamers Product
- Table 43. Wacker Chemie Corporation Information
- Table 44. Wacker Chemie Food Contact Defoamers Sales (Tons), Revenue (US$ Million), Price (US$/Ton) and Gross Margin (2018-2023)
- Table 45. Wacker Chemie Food Contact Defoamers Product
- Table 46. Elkem Corporation Information
- Table 47. Elkem Food Contact Defoamers Sales (Tons), Revenue (US$ Million), Price (US$/Ton) and Gross Margin (2018-2023)
- Table 48. Elkem Food Contact Defoamers Product
- Table 49. BASF Corporation Information
- Table 50. BASF Food Contact Defoamers Sales (Tons), Revenue (US$ Million), Price (US$/Ton) and Gross Margin (2018-2023)
- Table 51. BASF Food Contact Defoamers Product
- Table 52. Shin-Etsu Chemical Corporation Information
- Table 53. Shin-Etsu Chemical Food Contact Defoamers Sales (Tons), Revenue (US$ Million), Price (US$/Ton) and Gross Margin (2018-2023)
- Table 54. Shin-Etsu Chemical Food Contact Defoamers Product
- Table 55. Momentive Performance Materials Corporation Information
- Table 56. Momentive Performance Materials Food Contact Defoamers Sales (Tons), Revenue (US$ Million), Price (US$/Ton) and Gross Margin (2018-2023)
- Table 57. Momentive Performance Materials Food Contact Defoamers Product
- Table 58. DyStar Group Corporation Information
- Table 59. DyStar Group Food Contact Defoamers Sales (Tons), Revenue (US$ Million), Price (US$/Ton) and Gross Margin (2018-2023)
- Table 60. DyStar Group Food Contact Defoamers Product
- Table 61. CHT Group Corporation Information
- Table 62. CHT Group Food Contact Defoamers Sales (Tons), Revenue (US$ Million), Price (US$/Ton) and Gross Margin (2018-2023)
- Table 63. CHT Group Food Contact Defoamers Product
- Table 64. LEVACO Chemicals Corporation Information
- Table 65. LEVACO Chemicals Food Contact Defoamers Sales (Tons), Revenue (US$ Million), Price (US$/Ton) and Gross Margin (2018-2023)
- Table 66. LEVACO Chemicals Food Contact Defoamers Product
- Table 67. BRB International Corporation Information
- Table 68. BRB International Food Contact Defoamers Sales (Tons), Revenue (US$ Million), Price (US$/Ton) and Gross Margin (2018-2023)
- Table 69. BRB International Food Contact Defoamers Product
- Table 70. Siltech Corporation Information
- Table 71. Siltech Food Contact Defoamers Sales (Tons), Revenue (US$ Million), Price (US$/Ton) and Gross Margin (2018-2023)
- Table 72. Siltech Food Contact Defoamers Product
- Table 73. Resil Chemicals Corporation Information
- Table 74. Resil Chemicals Food Contact Defoamers Sales (Tons), Revenue (US$ Million), Price (US$/Ton) and Gross Margin (2018-2023)
- Table 75. Resil Chemicals Food Contact Defoamers Product
- Table 76. PMC Ouvrie Corporation Information
- Table 77. PMC Ouvrie Food Contact Defoamers Sales (Tons), Revenue (US$ Million), Price (US$/Ton) and Gross Margin (2018-2023)
- Table 78. PMC Ouvrie Food Contact Defoamers Product
- Table 79. Munzing Chemie Corporation Information
- Table 80. Munzing Chemie Food Contact Defoamers Sales (Tons), Revenue (US$ Million), Price (US$/Ton) and Gross Margin (2018-2023)
- Table 81. Munzing Chemie Food Contact Defoamers Product
- Table 82. Blackburn Chemicals Corporation Information
- Table 83. Blackburn Chemicals Food Contact Defoamers Sales (Tons), Revenue (US$ Million), Price (US$/Ton) and Gross Margin (2018-2023)
- Table 84. Blackburn Chemicals Food Contact Defoamers Product
- Table 85. PennWhite Corporation Information
- Table 86. PennWhite Food Contact Defoamers Sales (Tons), Revenue (US$ Million), Price (US$/Ton) and Gross Margin (2018-2023)
- Table 87. PennWhite Food Contact Defoamers Product
- Table 88. Shanghai Liqi Corporation Information
- Table 89. Shanghai Liqi Food Contact Defoamers Sales (Tons), Revenue (US$ Million), Price (US$/Ton) and Gross Margin (2018-2023)
- Table 90. Shanghai Liqi Food Contact Defoamers Product
- Table 91. Jiangsu Sixin Corporation Information
- Table 92. Jiangsu Sixin Food Contact Defoamers Sales (Tons), Revenue (US$ Million), Price (US$/Ton) and Gross Margin (2018-2023)
- Table 93. Jiangsu Sixin Food Contact Defoamers Product
- Table 94. Key Raw Materials Lists
- Table 95. Raw Materials Key Suppliers Lists
- Table 96. Food Contact Defoamers Distributors List
- Table 97. Food Contact Defoamers Customers List
- Table 98. Research Programs/Design for This Report
- Table 99. Key Data Information from Secondary Sources
- Table 100. Key Data Information from Primary Sources
- Table 101. QYR Business Unit and Senior & Team Lead Analysts
List of Figures
- Figure 1. Food Contact Defoamers Product Picture
- Figure 2. Global Food Contact Defoamers Revenue, (US$ Million), 2018 VS 2023 VS 2029
- Figure 3. Global Food Contact Defoamers Market Size 2018-2029 (US$ Million)
- Figure 4. Global Food Contact Defoamers Sales 2018-2029 (Tons)
- Figure 5. United States Food Contact Defoamers Revenue, (US$ Million), 2018 VS 2023 VS 2029
- Figure 6. United States Food Contact Defoamers Market Size 2018-2029 (US$ Million)
- Figure 7. United States Food Contact Defoamers Sales 2018-2029 (Tons)
- Figure 8. United States Food Contact Defoamers Market Share in Global, in Value (US$ Million) 2018-2029
- Figure 9. United States Food Contact Defoamers Market Share in Global, in Volume (Tons) 2018-2029
- Figure 10. Food Contact Defoamers Report Years Considered
- Figure 11. Product Picture of Silicone-based Defoamers
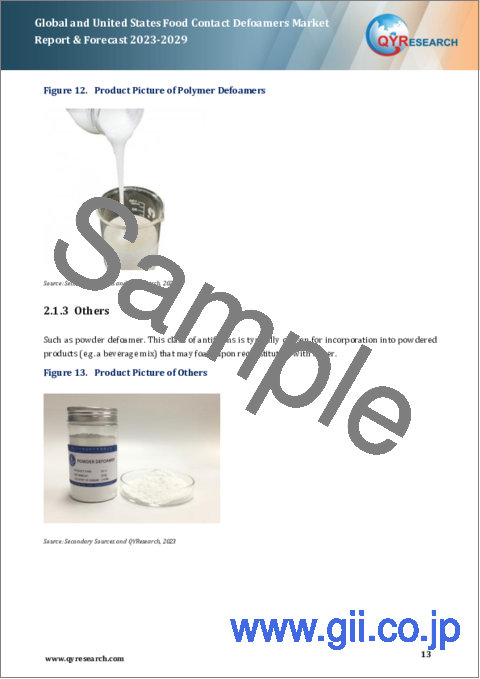
- Figure 12. Product Picture of Polymer Defoamers
- Figure 13. Product Picture of Others
- Figure 14. Global Food Contact Defoamers Market Share by Type in 2022 & 2029
- Figure 15. Global Food Contact Defoamers Sales in Value by Type (2018-2029) & (US$ Million)
- Figure 16. Global Food Contact Defoamers Sales Market Share in Value by Type (2018-2029)
- Figure 17. Global Food Contact Defoamers Sales by Type (2018-2029) & (Tons)
- Figure 18. Global Food Contact Defoamers Sales Market Share in Volume by Type (2018-2029)
- Figure 19. United States Food Contact Defoamers Market Share by Type in 2022 & 2029
- Figure 20. United States Food Contact Defoamers Sales in Value by Type (2018-2029) & (US$ Million)
- Figure 21. United States Food Contact Defoamers Sales Market Share in Value by Type (2018-2029)
- Figure 22. United States Food Contact Defoamers Sales by Type (2018-2029) & (Tons)
- Figure 23. United States Food Contact Defoamers Sales Market Share in Volume by Type (2018-2029)
- Figure 24. Product Picture of Food Processing
- Figure 25. Product Picture of Sugar Industry
- Figure 26. Product Picture of Fermentation Industry
- Figure 27. Product Picture of Food Contact Packaging
- Figure 28. Global Food Contact Defoamers Market Share by Application in 2022 & 2029
- Figure 29. Global Food Contact Defoamers Sales in Value by Application (2018-2029) & (US$ Million)
- Figure 30. Global Food Contact Defoamers Sales Market Share in Value by Application (2018-2029)
- Figure 31. Global Food Contact Defoamers Sales by Application (2018-2029) & (Tons)
- Figure 32. Global Food Contact Defoamers Sales Market Share in Volume by Application (2018-2029)
- Figure 33. United States Food Contact Defoamers Market Share by Application in 2022 & 2029
- Figure 34. United States Food Contact Defoamers Sales in Value by Application (2018-2029) & (US$ Million)
- Figure 35. United States Food Contact Defoamers Sales Market Share in Value by Application (2018-2029)
- Figure 36. United States Food Contact Defoamers Sales by Application (2018-2029) & (Tons)
- Figure 37. United States Food Contact Defoamers Sales Market Share in Volume by Application (2018-2029)
- Figure 38. The Top 3 and 6 Largest Manufacturers of Food Contact Defoamers in the World: Market Share by Food Contact Defoamers Revenue in 2022
- Figure 39. Global Food Contact Defoamers Market Size Market Share by Region: 2018 VS 2022 VS 2029
- Figure 40. Global Food Contact Defoamers Sales in Volume Market Share by Region (2018-2029)
- Figure 41. Global Food Contact Defoamers Sales in Value Market Share by Region (2018-2029)
- Figure 42. North America Food Contact Defoamers Sales in Volume Growth Rate 2018-2029 (Tons)
- Figure 43. North America Food Contact Defoamers Sales in Value Growth Rate 2018-2029 (US$ Million)
- Figure 44. United States Food Contact Defoamers Sales in Value Growth Rate (2018-2029) & (US$ Million)
- Figure 45. Canada Food Contact Defoamers Sales in Value Growth Rate (2018-2029) & (US$ Million)
- Figure 46. Europe Food Contact Defoamers Sales in Volume Growth Rate 2018-2029 (Tons)
- Figure 47. Europe Food Contact Defoamers Sales in Value Growth Rate 2018-2029 (US$ Million)
- Figure 48. Germany Food Contact Defoamers Sales in Value Growth Rate (2018-2029) & (US$ Million)
- Figure 49. France Food Contact Defoamers Sales in Value Growth Rate (2018-2029) & (US$ Million)
- Figure 50. U.K. Food Contact Defoamers Sales in Value Growth Rate (2018-2029) & (US$ Million)
- Figure 51. Italy Food Contact Defoamers Sales in Value Growth Rate (2018-2029) & (US$ Million)
- Figure 52. Russia Food Contact Defoamers Sales in Value Growth Rate (2018-2029) & (US$ Million)
- Figure 53. Asia-Pacific Food Contact Defoamers Sales in Volume Growth Rate 2018-2029 (Tons)
- Figure 54. Asia-Pacific Food Contact Defoamers Sales in Value Growth Rate 2018-2029 (US$ Million)
- Figure 55. China Food Contact Defoamers Sales in Value Growth Rate (2018-2029) & (US$ Million)
- Figure 56. Japan Food Contact Defoamers Sales in Value Growth Rate (2018-2029) & (US$ Million)
- Figure 57. South Korea Food Contact Defoamers Sales in Value Growth Rate (2018-2029) & (US$ Million)
- Figure 58. India Food Contact Defoamers Sales in Value Growth Rate (2018-2029) & (US$ Million)
- Figure 59. Australia Food Contact Defoamers Sales in Value Growth Rate (2018-2029) & (US$ Million)
- Figure 60. China Taiwan Food Contact Defoamers Sales in Value Growth Rate (2018-2029) & (US$ Million)
- Figure 61. Southeast Asia Food Contact Defoamers Sales in Value Growth Rate (2018-2029) & (US$ Million)
- Figure 62. Latin America Food Contact Defoamers Sales in Volume Growth Rate 2018-2029 (Tons)
- Figure 63. Latin America Food Contact Defoamers Sales in Value Growth Rate 2018-2029 (US$ Million)
- Figure 64. Mexico Food Contact Defoamers Sales in Value Growth Rate (2018-2029) & (US$ Million)
- Figure 65. Brazil Food Contact Defoamers Sales in Value Growth Rate (2018-2029) & (US$ Million)
- Figure 66. Argentina Food Contact Defoamers Sales in Value Growth Rate (2018-2029) & (US$ Million)
- Figure 67. Middle East and Africa Food Contact Defoamers Sales in Volume Growth Rate 2018-2029 (Tons)
- Figure 68. Middle East and Africa Food Contact Defoamers Sales in Value Growth Rate 2018-2029 (US$ Million)
- Figure 69. GCC Countries Food Contact Defoamers Sales in Value Growth Rate (2018-2029) & (US$ Million)
- Figure 70. Turkey Food Contact Defoamers Sales in Value Growth Rate (2018-2029) & (US$ Million)
- Figure 71. Africa Food Contact Defoamers Sales in Value Growth Rate (2018-2029) & (US$ Million)
- Figure 72. Food Contact Defoamers Industrial Chain Analysis
- Figure 73. Basic Silicone Sales Price (US$/Ton) & (2016-2022)
- Figure 74. Polyglycerol Esters of Fatty Acid Price (US$/Ton) & (2016-2021)
- Figure 75. Manufacturing Cost Structure of Food Contact Defoamers
- Figure 76. Channels of Distribution
- Figure 77. Distributors Profiles
- Figure 78. Bottom-up and Top-down Approaches for This Report
- Figure 79. Data Triangulation
- Figure 80. Key Executives Interviewed
Market Analysis and Insights:
This report focuses on global and United States Food Contact Defoamers market, also covers the segmentation data of other regions in regional level and county level.
The global Food Contact Defoamers revenue was US$ 883.52 million in 2022 and is forecast to a readjusted size of US$ 1,268.40 million by 2029 with a CAGR of 5.94% during the review period (2023-2029).
In United States the Food Contact Defoamers market size is expected to grow from US$ 248.59 million in 2023 to US$ 328.30 million by 2029, at a CAGR of 4.74% during the forecast period.
The global key players of Food Contact Defoamers include: Dow, Wacker Chemie, Elkem, BASF, Shin-Etsu Chemical, Momentive Performance Materials, DyStar Group, CHT Group, and LEVACO Chemicals, etc. The global five biggest players hold a share of 49.36% in 2022.
Scope and Market Size:
Food Contact Defoamers market is segmented in regional and country level, by players, by Type, and by Application. Companies, stakeholders, and other participants in the global Food Contact Defoamers market will be able to gain the upper hand as they use the report as a powerful resource. The segmental analysis focuses on sales, revenue and forecast by Type and by Application for the period 2018-2029.
For United States market, this report focuses on the Food Contact Defoamers market size by players, by Type, and by Application, for the period 2018-2029. The key players include the global and local players which play important roles in United States.
By Company
- Dow
- Wacker Chemie
- Elkem
- BASF
- Shin-Etsu Chemical
- Momentive Performance Materials
- DyStar Group
- CHT Group
- LEVACO Chemicals
- BRB International
- Siltech
- Resil Chemicals
- PMC Ouvrie
- Munzing Chemie
- Blackburn Chemicals
- PennWhite
- Shanghai Liqi
- Jiangsu Sixin
Segment by Type
- Silicone-based Defoamers
- Polymer Defoamers
- Others
Segment by Application
- Food Processing
- Sugar Industry
- Fermentation Industry
- Food Contact Packaging
- Others
By Region
- North America
- United States
- Canada
- Asia-Pacific
- China
- Japan
- South Korea
- India
- Australia
- China Taiwan
- Southeast Asia
- Europe
- Germany
- France
- U.K.
- Italy
- Russia
- Latin America
- Mexico
- Brazil
- Argentina
- Middle East & Africa
- GCC Countries
- Turkey
- Africa
Chapter Introduction
- Chapter 1: Introduces Food Contact Defoamers definition, global sales (volume and revenue), United States market size, United States percentage in global market. This section also introduces the market dynamics, latest developments of the market, the driving factors and restrictive factors of the market, the challenges and risks faced by companies in the industry, and the analysis of relevant policies in the industry.
- Chapter 2: Provides the analysis of various market segments by Type, covering the volume, price, revenue, and development potential of each market segment, to help readers find the blue ocean market in different market segments.
- Chapter 3: Provides the analysis of various market segments by Application, covering the revenue, price, volume, and development potential of each market segment, to help readers find the blue ocean market in different downstream markets.
- Chapter 4: Detailed analysis of Food Contact Defoamers companies competitive landscape, revenue, market share and industry ranking, latest development plan, merger, and acquisition information, etc.
- Chapter 5: Revenue and volume of Food Contact Defoamers in global and regional level. It provides a quantitative analysis of the market size and development potential of each region and introduces the market development, future development prospects, market space, and capacity of each country in the world.
- Chapter 6: North America, Europe, Asia-Pacific, Latin America and Middle East & Africa by country, sales, and revenue for each segment.
- Chapter 7: Provides profiles of key companies, introducing the basic situation of the main companies in the market in detail, including product descriptions and specifications, Food Contact Defoamers sales, revenue, gross margin, and recent development, etc.
- Chapter 8: Analysis of industrial chain, sales channel, key raw materials, distributors, and customers.
- Chapter 9: research findings and conclusion
Table of Contents
1 Study Coverage
- 1.1 Food Contact Defoamers Product Introduction
- 1.2 Global Food Contact Defoamers Outlook 2018 VS 2022 VS 2029
- 1.2.1 Global Food Contact Defoamers Sales in US$ Million for the Year 2018-2029
- 1.2.2 Global Food Contact Defoamers Sales in Volume for the Year 2018-2029
- 1.3 United States Food Contact Defoamers Outlook 2018 VS 2022 VS 2029
- 1.3.1 United States Food Contact Defoamers Sales in US$ Million for the Year 2018-2029
- 1.3.2 United States Food Contact Defoamers Sales in Volume for the Year 2018-2029
- 1.4 Food Contact Defoamers Market Size, United States VS Global, 2018 VS 2022 VS 2029
- 1.4.1 The Market Share of United States Food Contact Defoamers in Global, 2018 VS 2022 VS 2029
- 1.4.2 The Growth Rate of Food Contact Defoamers Market Size, United States VS Global, 2018 VS 2022 VS 2029
- 1.5 Food Contact Defoamers Market Dynamics
- 1.5.1 Food Contact Defoamers Industry Trends
- 1.5.2 Food Contact Defoamers Market Drivers
- 1.5.3 Food Contact Defoamers Market Challenges and Restraints
- 1.6 Assumptions and Limitations
- 1.7 Study Objectives
- 1.8 Years Considered
2 Food Contact Defoamers by Type
- 2.1 Food Contact Defoamers Market by Type
- 2.1.1 Silicone-based Defoamers
- 2.1.2 Polymer Defoamers
- 2.1.3 Others
- 2.2 Global Food Contact Defoamers Market Size by Type
- 2.2.1 Global Food Contact Defoamers Sales in Value, by Type (2018, 2022 & 2029)
- 2.2.2 Global Food Contact Defoamers Sales in Volume, by Type (2018, 2022 & 2029)
- 2.3 United States Food Contact Defoamers Market Size by Type
- 2.3.1 United States Food Contact Defoamers Sales in Value, by Type (2018, 2022 & 2029)
- 2.3.2 United States Food Contact Defoamers Sales in Volume, by Type (2018, 2022 & 2029)
3 Food Contact Defoamers by Application
- 3.1 Food Contact Defoamers Market by Application
- 3.1.1 Food Processing
- 3.1.2 Sugar Industry
- 3.1.3 Fermentation Industry
- 3.1.4 Food Contact Packaging
- 3.2 Global Food Contact Defoamers Market Size by Application
- 3.2.1 Global Food Contact Defoamers Sales in Value, by Application (2018, 2022 & 2029)
- 3.2.2 Global Food Contact Defoamers Sales in Volume, by Application (2018, 2022 & 2029)
- 3.3 United States Food Contact Defoamers Market Size by Application
- 3.3.1 United States Food Contact Defoamers Sales in Value, by Application (2018, 2022 & 2029)
- 3.3.2 United States Food Contact Defoamers Sales in Volume, by Application (2018, 2022 & 2029)
4 Global Food Contact Defoamers Competitor Landscape by Company
- 4.1 Global Food Contact Defoamers Market Size by Company
- 4.1.1 Global Key Manufacturers of Food Contact Defoamers, Ranked by Revenue (2022)
- 4.1.2 Global Food Contact Defoamers Revenue by Manufacturer (2018-2023)
- 4.1.3 Global Food Contact Defoamers Sales by Manufacturer (2018-2023)
- 4.1.4 Global Food Contact Defoamers Price by Manufacturer (2018-2023)
- 4.2 Global Food Contact Defoamers Concentration Ratio (CR)
- 4.2.1 Food Contact Defoamers Market Concentration Ratio (CR) (2018-2023)
- 4.2.2 Global Top 3 and Top 6 Largest Manufacturers of Food Contact Defoamers in 2022
- 4.2.3 Global Food Contact Defoamers Market Share by Company Type (Tier 1, Tier 2, and Tier 3)
- 4.3 Global Key Manufacturers of Food Contact Defoamers, Manufacturing Base Distribution and Headquarters
- 4.4 Global Key Manufacturers of Food Contact Defoamers, Product Offered and Application
- 4.5 Global Key Manufacturers of Food Contact Defoamers, Date of Establishment in This Industry
- 4.6 United States Food Contact Defoamers Market Size by Company
- 4.6.1 Key Players of Food Contact Defoamers in United States, Ranked by Revenue (2022)
- 4.6.2 United States Food Contact Defoamers Revenue by Players (2021-2023)
- 4.6.3 United States Food Contact Defoamers Sales by Players (2021-2023)
5 Global Food Contact Defoamers Market Size by Region
- 5.1 Global Food Contact Defoamers Market Size by Region: 2018 VS 2022 VS 2029
- 5.2 Global Food Contact Defoamers Market Size in Volume by Region (2018-2029)
- 5.2.1 Global Food Contact Defoamers Sales in Volume by Region: 2018-2023
- 5.2.2 Global Food Contact Defoamers Sales in Volume Forecast by Region (2024-2029)
- 5.3 Global Food Contact Defoamers Market Size in Value by Region (2018-2029)
- 5.3.1 Global Food Contact Defoamers Sales in Value by Region: 2018-2023
- 5.3.2 Global Food Contact Defoamers Sales in Value by Region: 2024-2029
6 Segment in Regional Level & Country Level
- 6.1 North America
- 6.1.1 North America Food Contact Defoamers Market Size YoY Growth 2018-2029
- 6.1.2 North America Food Contact Defoamers Market Facts & Figures by Country (2017, 2022 & 2028)
- 6.1.3 United States
- 6.1.4 Canada
- 6.2 Europe
- 6.2.1 Europe Food Contact Defoamers Market Size YoY Growth 2018-2029
- 6.2.2 Europe Food Contact Defoamers Market Facts & Figures by Country (2017, 2022 & 2028)
- 6.2.3 Germany
- 6.2.4 France
- 6.2.5 U.K.
- 6.2.6 Italy
- 6.2.7 Russia
- 6.3 Asia-Pacific
- 6.3.1 Asia-Pacific Food Contact Defoamers Market Size YoY Growth 2018-2029
- 6.3.2 Asia-Pacific Food Contact Defoamers Market Facts & Figures by Region (2017, 2022 & 2028)
- 6.3.3 China
- 6.3.4 Japan
- 6.3.5 South Korea
- 6.3.6 India
- 6.3.7 Australia
- 6.3.8 China Taiwan
- 6.3.9 Southeast Asia
- 6.4 Latin America
- 6.4.1 Latin America Food Contact Defoamers Market Size YoY Growth 2018-2029
- 6.4.2 Latin America Food Contact Defoamers Market Facts & Figures by Country (2017, 2022 & 2028)
- 6.4.3 Mexico
- 6.4.4 Brazil
- 6.4.5 Argentina
- 6.5 Middle East and Africa
- 6.5.1 Middle East and Africa Food Contact Defoamers Market Size YoY Growth 2018-2029
- 6.5.2 Middle East and Africa Food Contact Defoamers Market Facts & Figures by Region (2017, 2022 & 2028)
- 6.5.3 GCC Countries
- 6.5.4 Turkey
- 6.5.5 Africa
7 Company Profiles
- 7.1 Dow
- 7.1.1 Dow Corporation Information
- 7.1.2 Dow Description and Business Overview
- 7.1.3 Dow Food Contact Defoamers Sales, Revenue and Gross Margin (2018-2023)
- 7.1.4 Dow Food Contact Defoamers Products Offered
- 7.2 Wacker Chemie
- 7.2.1 Wacker Chemie Corporation Information
- 7.2.2 Wacker Chemie Description and Business Overview
- 7.2.3 Wacker Chemie Food Contact Defoamers Sales, Revenue and Gross Margin (2018-2023)
- 7.2.4 Wacker Chemie Food Contact Defoamers Products Offered
- 7.3 Elkem
- 7.3.1 Elkem Corporation Information
- 7.3.2 Elkem Description and Business Overview
- 7.3.3 Elkem Food Contact Defoamers Sales, Revenue and Gross Margin (2018-2023)
- 7.3.4 Elkem Food Contact Defoamers Products Offered
- 7.4 BASF
- 7.4.1 BASF Corporation Information
- 7.4.2 BASF Description and Business Overview
- 7.4.3 BASF Food Contact Defoamers Sales, Revenue and Gross Margin (2018-2023)
- 7.4.4 BASF Food Contact Defoamers Products Offered
- 7.5 Shin-Etsu Chemical
- 7.5.1 Shin-Etsu Chemical Corporation Information
- 7.5.2 Shin-Etsu Chemical Description and Business Overview
- 7.5.3 Shin-Etsu Chemical Food Contact Defoamers Sales, Revenue and Gross Margin (2018-2023)
- 7.5.4 Shin-Etsu Chemical Food Contact Defoamers Products Offered
- 7.6 Momentive Performance Materials
- 7.6.1 Momentive Performance Materials Corporation Information
- 7.6.2 Momentive Performance Materials Description and Business Overview
- 7.6.3 Momentive Performance Materials Food Contact Defoamers Sales, Revenue and Gross Margin (2018-2023)
- 7.6.4 Momentive Performance Materials Food Contact Defoamers Products Offered
- 7.7 DyStar Group
- 7.7.1 DyStar Group Corporation Information
- 7.7.2 DyStar Group Description and Business Overview
- 7.7.3 DyStar Group Food Contact Defoamers Sales, Revenue and Gross Margin (2018-2023)
- 7.7.4 DyStar Group Food Contact Defoamers Products Offered
- 7.8 CHT Group
- 7.8.1 CHT Group Corporation Information
- 7.8.2 CHT Group Description and Business Overview
- 7.8.3 CHT Group Food Contact Defoamers Sales, Revenue and Gross Margin (2018-2023)
- 7.8.4 CHT Group Food Contact Defoamers Products Offered
- 7.9 LEVACO Chemicals
- 7.9.1 LEVACO Chemicals Corporation Information
- 7.9.2 LEVACO Chemicals Description and Business Overview
- 7.9.3 LEVACO Chemicals Food Contact Defoamers Sales, Revenue and Gross Margin (2018-2023)
- 7.9.4 LEVACO Chemicals Food Contact Defoamers Products Offered
- 7.10 BRB International
- 7.10.1 BRB International Corporation Information
- 7.10.2 BRB International Description and Business Overview
- 7.10.3 BRB International Food Contact Defoamers Sales, Revenue and Gross Margin (2018-2023)
- 7.10.4 BRB International Food Contact Defoamers Products Offered
- 7.11 Siltech
- 7.11.1 Siltech Corporation Information
- 7.11.2 Siltech Description and Business Overview
- 7.11.3 Siltech Food Contact Defoamers Sales, Revenue and Gross Margin (2018-2023)
- 7.11.4 Siltech Food Contact Defoamers Products Offered
- 7.12 Resil Chemicals
- 7.12.1 Resil Chemicals Corporation Information
- 7.12.2 Resil Chemicals Description and Business Overview
- 7.12.3 Resil Chemicals Food Contact Defoamers Sales, Revenue and Gross Margin (2018-2023)
- 7.12.4 Resil Chemicals Food Contact Defoamers Products Offered
- 7.13 PMC Ouvrie
- 7.13.1 PMC Ouvrie Corporation Information
- 7.13.2 PMC Ouvrie Description and Business Overview
- 7.13.3 PMC Ouvrie Food Contact Defoamers Sales, Revenue and Gross Margin (2018-2023)
- 7.13.4 PMC Ouvrie Food Contact Defoamers Products Offered
- 7.14 Munzing Chemie
- 7.14.1 Munzing Chemie Corporation Information
- 7.14.2 Munzing Chemie Description and Business Overview
- 7.14.3 Munzing Chemie Food Contact Defoamers Sales, Revenue and Gross Margin (2018-2023)
- 7.14.4 Munzing Chemie Food Contact Defoamers Products Offered
- 7.15 Blackburn Chemicals
- 7.15.1 Blackburn Chemicals Corporation Information
- 7.15.2 Blackburn Chemicals Description and Business Overview
- 7.15.3 Blackburn Chemicals Food Contact Defoamers Sales, Revenue and Gross Margin (2018-2023)
- 7.15.4 Blackburn Chemicals Food Contact Defoamers Products Offered
- 7.16 PennWhite
- 7.16.1 PennWhite Corporation Information
- 7.16.2 PennWhite Description and Business Overview
- 7.16.3 PennWhite Food Contact Defoamers Sales, Revenue and Gross Margin (2018-2023)
- 7.16.4 PennWhite Food Contact Defoamers Products Offered
- 7.17 Shanghai Liqi
- 7.17.1 Shanghai Liqi Corporation Information
- 7.17.2 Shanghai Liqi Description and Business Overview
- 7.17.3 Shanghai Liqi Food Contact Defoamers Sales, Revenue and Gross Margin (2018-2023)
- 7.17.4 Shanghai Liqi Food Contact Defoamers Products Offered
- 7.18 Jiangsu Sixin
- 7.18.1 Jiangsu Sixin Corporation Information
- 7.18.2 Jiangsu Sixin Description and Business Overview
- 7.18.3 Jiangsu Sixin Food Contact Defoamers Sales, Revenue and Gross Margin (2018-2023)
- 7.18.4 Jiangsu Sixin Food Contact Defoamers Products Offered
8 Industry Chain and Sales Channels Analysis
- 8.1 Food Contact Defoamers Industry Chain Analysis
- 8.2 Food Contact Defoamers Key Raw Materials
- 8.2.1 Key Raw Materials
- 8.2.2 Key Raw Materials Price
- 8.2.3 Raw Materials Key Suppliers
- 8.3 Proportion of Manufacturing Cost Structure
- 8.4 Food Contact Defoamers Sales and Marketing
- 8.4.1 Food Contact Defoamers Sales Channels
- 8.4.2 Food Contact Defoamers Distributors
- 8.5 Food Contact Defoamers Customers
9 Research Findings and Conclusion
10 Appendix
- 10.1 Research Methodology
- 10.1.1 Methodology/Research Approach
- 10.1.2 Data Source
- 10.2 Author Details
- 10.3 Disclaimer