|
|
市場調査レポート
商品コード
1250821
ワイパーの世界市場:販売分析 (2023年)Global Wiper Sales Market Report 2023 |
||||||
|
|
|||||||
|
● お客様のご希望に応じて、既存データの加工や未掲載情報(例:国別セグメント)の追加などの対応が可能です。 詳細はお問い合わせください。 |
|||||||


| ワイパーの世界市場:販売分析 (2023年) |
|
出版日: 2023年04月04日
発行: QYResearch
ページ情報: 英文 118 Pages
納期: 2~3営業日
|
- 全表示
- 概要
- 図表
- 目次
世界のワイパーの市場規模は、COVID-19のパンデミックにより、2022年に57億5,000万米ドルに達した後、予測期間中 (2023年~2029年) に2.0%のCAGRで成長し、2029年までに65億6,000万米ドルの再調整規模に達する、と予測されます。
この健康危機による経済変化を十分に考慮し、2022年にワイパー世界市場の74.38%を占めたワイパーブレードは、2029年には49億米ドルの価値を持ち、2023年から2029年にかけて2.12%のCAGRで成長すると予測しています。
2022年に、米国のワイパーの市場規模は12億4,000万米ドル、中国は10億1,000万米ドルに達しました。2022年に米国の割合が21.57%、中国の割合が17.53%だったのが、2029年には中国のシェアが19.97%に達し、分析期間を通じて3.83%のCAGRで推移する、と予測されています。
当レポートでは、世界のワイパーの市場について分析し、種類別・用途別・地域別 (国別) の市場動向の見通し (2018年~2029年)、主要企業のプロファイルなどについて調査しております。
目次
第1章 ワイパー:市場概要
- ワイパー:製品の範囲
- 種類別の市場セグメント
- 販売:種類別 (2018年・2022年・2029年)
- ワイパーブレード
- ワイパーアーム
- 用途別の市場セグメント
- 販売の比較:用途別 (2018年・2022年・2029年)
- OEM
- アフターマーケット
- 世界のワイパー市場:推定・予測 (2018年~2029年)
- 市場規模の成長率 (金額、2018年~2029年)
- 市場規模の成長率 (数量、2018年~2029年)
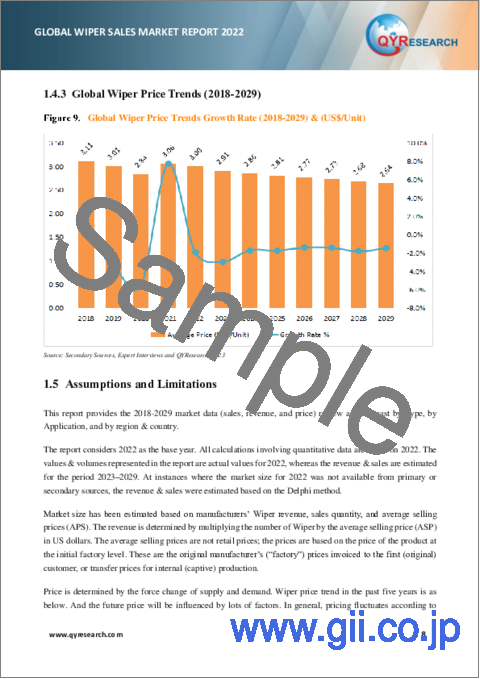
- 価格動向 (2018年~2029年)
- 前提・制約条件
第2章 ワイパー:地域別の推定・予測
- 市場規模:地域別 (2018年・2022年・2029年)
- 遡及的市場シナリオ:地域別 (2018年~2023年)
- 市場の推計・予測:地域別 (2024年~2029年)
- 地域別の市場分析:詳細分析
- 米国 (2018年~2029年)
- 欧州 (2018年~2029年)
- 中国 (2018年~2029年)
- 日本 (2018年~2029年)
- 東南アジア (2018年~2029年)
- インド (2018年~2029年)
第3章 ワイパー:企業別の競合情勢
- ワイパーの主要企業の販売 (2018年~2023年)
- ワイパーの主要企業の収益 (2018年~2023年)
- 市場シェア:企業の種類別 (ティア1、ティア2、ティア3) (収益別、2022年)
- 平均価格:企業別 (2018年~2023年)
- ワイパーメーカーの製造拠点・本社
- ワイパーメーカーの製品種類
第4章 ワイパー:種類別の市場規模
- 過去の市場分析:種類別 (2018年~2023年)
- 市場の推計・予測:種類別 (2024年~2029年)
第5章 ワイパー:用途別の市場規模
- 過去の市場分析:用途別 (2018年~2023年)
- 市場の推計・予測:用途別 (2024年~2029年)
第6章 米国のワイパー市場:詳細分析
- 販売:企業別
- 販売:種類別の内訳
- 販売:用途別の内訳
第7章 欧州のワイパー市場:詳細分析
第8章 中国のワイパー市場:詳細分析
第9章 日本のワイパー市場:詳細分析
第10章 東南アジアのワイパー市場:詳細分析
第11章 インドのワイパー市場:詳細分析
第12章 企業プロファイルと主要指標
- Valeo
- Bosch
- Trico
- Denso
- Mitsuba
- HEYNER
- ITW
- Zhejiang Shenghuabo Electric
- CAP
- HELLA
- Ningbo Xinhai Aido
- Doga Parts
- KCW Industrial
- Pylon
- Xiamen Phucar Auto
- Zhejiang Guoyu Auto Parts
- Meto Auto Parts
第13章 調査結果と結論
第14章 付録
List of Tables
- Table 1. Global Wiper Sales (US$ Million) Growth Rate by Type (2018 & 2022 & 2029)
- Table 2. Global Wiper Sales (US$ Million) Comparison by Application (2018 & 2022 & 2029)
- Table 3. Global Market Wiper Market Size (US$ Million) by Region:2018 VS 2022 VS 2029
- Table 4. Global Wiper Sales (Million Units) by Region (2018-2023)
- Table 5. Global Wiper Sales Market Share by Region (2018-2023)
- Table 6. Global Wiper Revenue (US$ Million) Market Share by Region (2018-2023)
- Table 7. Global Wiper Revenue Share by Region (2018-2023)
- Table 8. Global Wiper Sales (Million Units) Forecast by Region (2024-2029)
- Table 9. Global Wiper Sales Market Share Forecast by Region (2024-2029)
- Table 10. Global Wiper Revenue (US$ Million) Forecast by Region (2024-2029)
- Table 11. Global Wiper Revenue Share Forecast by Region (2024-2029)
- Table 12. Global Wiper Sales by Company (Million Units) & (2018-2023)
- Table 13. Global Wiper Sales Share by Company (2018-2023)
- Table 14. Global Wiper Revenue by Company (US$ Million) & (2018-2023)
- Table 15. Global Wiper Revenue Share by Company (2018-2023)
- Table 16. Global Wiper by Company Type (Tier 1, Tier 2, and Tier 3) & (based on the Revenue in Wiper as of 2022)
- Table 17. Global Market Wiper Average Price by Company (US$/Unit) & (2018-2023)
- Table 18. Global Key Manufacturers of Wiper, Manufacturing Sites & Headquarters
- Table 19. Global Key Manufacturers of Wiper, Product Type
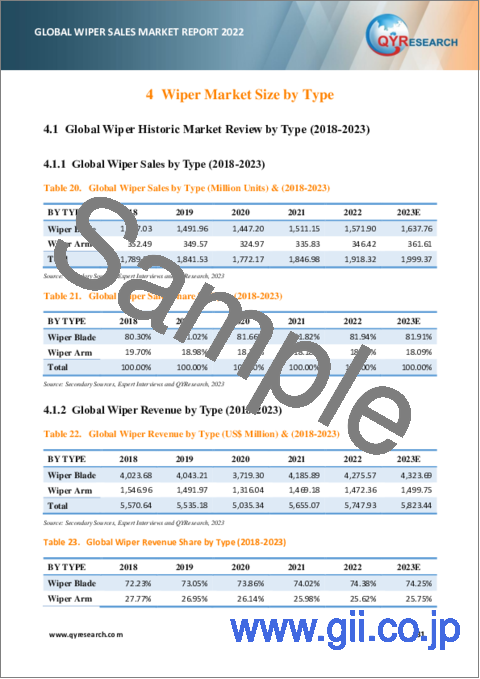
- Table 20. Global Wiper Sales by Type (Million Units) & (2018-2023)
- Table 21. Global Wiper Sales Share by Type (2018-2023)
- Table 22. Global Wiper Revenue by Type (US$ Million) & (2018-2023)
- Table 23. Global Wiper Revenue Share by Type (2018-2023)
- Table 24. Global Wiper Price by Type (US$/Unit) & (2018-2023)
- Table 25. Global Wiper Sales by Type (Million Units) & (2024-2029)
- Table 26. Global Wiper Sales Share by Type (2024-2029)
- Table 27. Global Wiper Revenue by Type (US$ Million) & (2024-2029)
- Table 28. Global Wiper Revenue Share by Type (2024-2029)
- Table 29. Global Wiper Price by Type (US$/Unit) & (2024-2029)
- Table 30. Global Wiper Sales by Application (Million Units) & (2018-2023)
- Table 31. Global Wiper Sales Share by Application (2018-2023)
- Table 32. Global Wiper Revenue by Application (US$ Million) & (2018-2023)
- Table 33. Global Wiper Revenue Share by Application (2018-2023)
- Table 34. Global Wiper Price by Application (US$/Unit) & (2018-2023)
- Table 35. Global Wiper Sales by Application (Million Units) & (2024-2029)
- Table 36. Global Wiper Sales Share by Application (2024-2029)
- Table 37. Global Wiper Revenue Market Share by Application (US$ Million) & (2024-2029)
- Table 38. Global Wiper Revenue Share by Application (2024-2029)
- Table 39. Global Wiper Price by Application (US$/Unit) & (2024-2029)
- Table 40. United States Wiper Revenue by Company (2018-2023) & (US$ Million)
- Table 41. United States Wiper Revenue Market Share by Company (2018-2023)
- Table 42. United States Wiper Sales by Type (2018-2023) & (Million Units)
- Table 43. United States Wiper Sales Market Share by Type (2018-2023)
- Table 44. United States Wiper Sales by Type (2024-2029) & (Million Units)
- Table 45. United States Wiper Sales Market Share by Type (2024-2029)
- Table 46. United States Wiper Sales by Application (2018-2023) & (Million Units)
- Table 47. United States Wiper Sales Market Share by Application (2018-2023)
- Table 48. United States Wiper Sales by Application (2024-2029) & (Million Units)
- Table 49. United States Wiper Sales Market Share by Application (2024-2029)
- Table 50. Europe Wiper Revenue by Company (2018-2023) & (US$ Million)
- Table 51. Europe Wiper Revenue Market Share by Company (2018-2023)
- Table 52. Europe Wiper Sales by Type (2018-2023) & (Million Units)
- Table 53. Europe Wiper Sales Market Share by Type (2018-2023)
- Table 54. Europe Wiper Sales by Type (2024-2029) & (Million Units)
- Table 55. Europe Wiper Sales Market Share by Type (2024-2029)
- Table 56. Europe Wiper Sales by Application (2018-2023) & (Million Units)
- Table 57. Europe Wiper Sales Market Share by Application (2018-2023)
- Table 58. Europe Wiper Sales by Application (2024-2029) & (Million Units)
- Table 59. Europe Wiper Sales Market Share by Application (2024-2029)
- Table 60. China Wiper Revenue by Company (2018-2023) & (US$ Million)
- Table 61. China Wiper Revenue Market Share by Company (2018-2023)
- Table 62. China Wiper Sales by Type (2018-2023) & (Million Units)
- Table 63. China Wiper Sales Market Share by Type (2018-2023)
- Table 64. China Wiper Sales by Type (2024-2029) & (Million Units)
- Table 65. China Wiper Sales Market Share by Type (2024-2029)
- Table 66. China Wiper Sales by Application (2018-2023) & (Million Units)
- Table 67. China Wiper Sales Market Share by Application (2018-2023)
- Table 68. China Wiper Sales by Application (2024-2029) & (Million Units)
- Table 69. China Wiper Sales Market Share by Application (2024-2029)
- Table 70. Japan Wiper Revenue by Company (2018-2023) & (US$ Million)
- Table 71. Japan Wiper Revenue Market Share by Company (2018-2023)
- Table 72. Japan Wiper Sales by Type (2018-2023) & (Million Units)
- Table 73. Japan Wiper Sales Market Share by Type (2018-2023)
- Table 74. Japan Wiper Sales by Type (2024-2029) & (Million Units)
- Table 75. Japan Wiper Sales Market Share by Type (2024-2029)
- Table 76. Japan Wiper Sales by Application (2018-2023) & (Million Units)
- Table 77. Japan Wiper Sales Market Share by Application (2018-2023)
- Table 78. Japan Wiper Sales by Application (2024-2029) & (Million Units)
- Table 79. Japan Wiper Sales Market Share by Application (2024-2029)
- Table 80. Southeast Asia Wiper Revenue by Company (2018-2023) & (US$ Million)
- Table 81. Southeast Asia Wiper Revenue Market Share by Company (2018-2023)
- Table 82. Southeast Asia Wiper Sales by Type (2018-2023) & (Million Units)
- Table 83. Southeast Asia Wiper Sales Market Share by Type (2018-2023)
- Table 84. Southeast Asia Wiper Sales by Type (2024-2029) & (Million Units)
- Table 85. Southeast Asia Wiper Sales Market Share by Type (2024-2029)
- Table 86. Southeast Asia Wiper Sales by Application (2018-2023) & (Million Units)
- Table 87. Southeast Asia Wiper Sales Market Share by Application (2018-2023)
- Table 88. Southeast Asia Wiper Sales by Application (2024-2029) & (Million Units)
- Table 89. Southeast Asia Wiper Sales Market Share by Application (2024-2029)
- Table 90. India Wiper Revenue by Company (2018-2023) & (US$ Million)
- Table 91. India Wiper Revenue Market Share by Company (2018-2023)
- Table 92. India Wiper Sales by Type (2018-2023) & (Million Units)
- Table 93. India Wiper Sales Market Share by Type (2018-2023)
- Table 94. India Wiper Sales by Type (2024-2029) & (Million Units)
- Table 95. India Wiper Sales Market Share by Type (2024-2029)
- Table 96. India Wiper Sales by Application (2018-2023) & (Million Units)
- Table 97. India Wiper Sales Market Share by Application (2018-2023)
- Table 98. India Wiper Sales by Application (2024-2029) & (Million Units)
- Table 99. India Wiper Sales Market Share by Application (2024-2029)
- Table 100. Valeo Company Information
- Table 101. Valeo Description and Business Overview
- Table 102. Valeo Wiper Sales Volume (Million Units), Revenue (US$ Million), Average Price (US$/Unit) and Gross Margin (2018-2023)
- Table 103. Valeo Wiper Product
- Table 104. Bosch Company Information
- Table 105. Bosch Description and Business Overview
- Table 106. Bosch Wiper Sales Volume (Million Units), Revenue (US$ Million), Average Price (US$/Unit) and Gross Margin (2018-2023)
- Table 107. Bosch Wiper Product
- Table 108. Trico Company Information
- Table 109. Trico Description and Business Overview
- Table 110. Trico Wiper Sales Volume (Million Units), Revenue (US$ Million), Average Price (US$/Unit) and Gross Margin (2018-2023)
- Table 111. Trico Wiper Product
- Table 112. Denso Company Information
- Table 113. Denso Description and Business Overview
- Table 114. Denso Wiper Sales Volume (Million Units), Revenue (US$ Million), Average Price (US$/Unit) and Gross Margin (2018-2023)
- Table 115. Denso Wiper Product
- Table 116. Mitsuba Company Information
- Table 117. Mitsuba Description and Business Overview
- Table 118. Mitsuba Wiper Sales Volume (Million Units), Revenue (US$ Million), Average Price (US$/Unit) and Gross Margin (2018-2023)
- Table 119. Mitsuba Wiper Product
- Table 120. HEYNER Company Information
- Table 121. HEYNER Description and Business Overview
- Table 122. HEYNER Wiper Sales Volume (Million Units), Revenue (US$ Million), Average Price (US$/Unit) and Gross Margin (2018-2023)
- Table 123. HEYNER Wiper Product
- Table 124. ITW Company Information
- Table 125. ITW Description and Business Overview
- Table 126. ITW Wiper Sales Volume (Million Units), Revenue (US$ Million), Average Price (US$/Unit) and Gross Margin (2018-2023)
- Table 127. ITW Wiper Product
- Table 128. Zhejiang Shenghuabo Electric Company Information
- Table 129. Zhejiang Shenghuabo Electric Description and Business Overview
- Table 130. Zhejiang Shenghuabo Electric Wiper Sales Volume (Million Units), Revenue (US$ Million), Average Price (US$/Unit) and Gross Margin (2018-2023)
- Table 131. Zhejiang Shenghuabo Electric Wiper Product
- Table 132. CAP Company Information
- Table 133. CAP Description and Business Overview
- Table 134. CAP Wiper Sales Volume (Million Units), Revenue (US$ Million), Average Price (US$/Unit) and Gross Margin (2018-2023)
- Table 135. CAP Wiper Product
- Table 136. HELLA Company Information
- Table 137. HELLA Description and Business Overview
- Table 138. HELLA Wiper Sales Volume (Million Units), Revenue (US$ Million), Average Price (US$/Unit) and Gross Margin (2018-2023)
- Table 139. HELLA Wiper Product
- Table 140. Ningbo Xinhai Aido Company Information
- Table 141. Ningbo Xinhai Aido Description and Business Overview
- Table 142. Ningbo Xinhai Aido Wiper Sales Volume (Million Units), Revenue (US$ Million), Average Price (US$/Unit) and Gross Margin (2018-2023)
- Table 143. Ningbo Xinhai Aido Wiper Product
- Table 144. Doga Parts Company Information
- Table 145. Doga Parts Description and Business Overview
- Table 146. Doga Parts Wiper Sales Volume (Million Units), Revenue (US$ Million), Average Price (US$/Unit) and Gross Margin (2018-2023)
- Table 147. Doga Parts Wiper Product
- Table 148. KCW Industrial Company Information
- Table 149. KCW Industrial Description and Business Overview
- Table 150. KCW Industrial Wiper Sales Volume (Million Units), Revenue (US$ Million), Average Price (US$/Unit) and Gross Margin (2018-2023)
- Table 151. KCW Industrial Wiper Product
- Table 152. Pylon Company Information
- Table 153. Pylon Description and Business Overview
- Table 154. Pylon Wiper Sales Volume (Million Units), Revenue (US$ Million), Average Price (US$/Unit) and Gross Margin (2018-2023)
- Table 155. Pylon Wiper Product
- Table 156. Xiamen Phucar Auto Company Information
- Table 157. Xiamen Phucar Auto Description and Business Overview
- Table 158. Xiamen Phucar Auto Wiper Sales Volume (Million Units), Revenue (US$ Million), Average Price (US$/Unit) and Gross Margin (2018-2023)
- Table 159. Xiamen Phucar Auto Wiper Product
- Table 160. Zhejiang Guoyu Auto Parts Company Information
- Table 161. Zhejiang Guoyu Auto Parts Description and Business Overview
- Table 162. Zhejiang Guoyu Auto Parts Wiper Sales Volume (Million Units), Revenue (US$ Million), Average Price (US$/Unit) and Gross Margin (2018-2023)
- Table 163. Zhejiang Guoyu Auto Parts Wiper Product
- Table 164. Meto Auto Parts Company Information
- Table 165. Meto Auto Parts Description and Business Overview
- Table 166. Meto Auto Parts Wiper Sales Volume (Million Units), Revenue (US$ Million), Average Price (US$/Unit) and Gross Margin (2018-2023)
- Table 167. Meto Auto Parts Wiper Product
- Table 168. Research Programs/Design for This Report
- Table 169. Key Data Information from Secondary Sources
- Table 170. Key Data Information from Primary Sources
- Table 171. QYR Business Unit and Senior & Team Lead Analysts
List of Figures
- Figure 1. Wiper Product Picture
- Figure 2. Global Wiper Sales Market Share by Type in 2022 & 2029
- Figure 3. Wiper Blade Product Picture
- Figure 4. Wiper Arm Product Picture
- Figure 5. Global Wiper Sales Market Share by Application in 2022 & 2029
- Figure 6. Global Wiper Sales, (US$ Million), 2018 VS 2023 VS 2029
- Figure 7. Global Wiper Sales Growth Rate (2018-2029) & (US$ Million)
- Figure 8. Global Wiper Sales (Million Units) Growth Rate (2018-2029)
- Figure 9. Global Wiper Price Trends Growth Rate (2018-2029) & (US$/Unit)
- Figure 10. Wiper Report Years Considered
- Figure 11. Global Wiper Revenue Market Share by Region: 2018 VS 2022
- Figure 12. United States Wiper Revenue (US$ Million) Growth Rate (2018-2029)
- Figure 13. United States Wiper Sales (Million Units) Growth Rate (2018-2029)
- Figure 14. Europe Wiper Revenue (US$ Million) Growth Rate (2018-2029)
- Figure 15. Europe Wiper Sales (Million Units) Growth Rate (2018-2029)
- Figure 16. China Wiper Revenue (US$ Million) Growth Rate (2018-2029)
- Figure 17. China Wiper Sales (Million Units) Growth Rate (2018-2029)
- Figure 18. Japan Wiper Revenue (US$ Million) Growth Rate (2018-2029)
- Figure 19. Japan Wiper Sales (Million Units) Growth Rate (2018-2029)
- Figure 20. Southeast Asia Wiper Revenue (US$ Million) Growth Rate (2018-2029)
- Figure 21. Southeast Asia Wiper Sales (Million Units) Growth Rate (2018-2029)
- Figure 22. India Wiper Revenue (US$ Million) Growth Rate (2018-2029)
- Figure 23. India Wiper Sales (Million Units) Growth Rate (2018-2029)
- Figure 24. Global 5 Largest Wiper Players Market Share by Revenue in Wiper in 2022
- Figure 25. Wiper Market Share by Company Type (Tier 1, Tier 2, and Tier 3): 2018 VS 2022
- Figure 26. Bottom-up and Top-down Approaches for This Report
- Figure 27. Data Triangulation
- Figure 28. Key Executives Interviewed
Market Analysis and Insights: Global Wiper Market
Due to the COVID-19 pandemic, the global Wiper market size was US$ 5.75 billion in 2022 and is forecast to a readjusted size of US$ 6.56 billion by 2029 with a CAGR of 2.0% during the forecast period 2023-2029. Fully considering the economic change by this health crisis, Wiper Blade accounting for 74.38% of the Wiper global market in 2022, is projected to value US$ 4.90 billion by 2029, growing at a revised 2.12% CAGR from 2023 to 2029.
The United States Wiper market size was US$ 1.24 billion in 2022, while China was US$ 1.01 billion. The proportion of the United States was 21.57% in 2022, while Chinese percentage was 17.53%, and it is predicted that China share will reach 19.97% in 2029, trailing a CAGR of 3.83% through the analysis period.
The global key manufacturers of Wiper include Valeo, Bosch, Trico, Denso, Mitsuba, HEYNER, ITW, HELLA, Zhejiang Shenghuabo Electric, and CAP, etc. In 2022, the global top five players occupied for a share approximately 60.08% in terms of revenue.
Global Wiper Scope and Market Size
The global Wiper market is segmented by company, region (country), by Type, and by Application. Players, stakeholders, and other participants in the global Wiper market will be able to gain the upper hand as they use the report as a powerful resource. The segmental analysis focuses on sales, revenue and forecast by region (country), by Type and by Application for the period 2018-2029.
By Company
- Valeo
- Bosch
- Trico
- Denso
- Mitsuba
- HEYNER
- ITW
- Zhejiang Shenghuabo Electric
- CAP
- HELLA
- Ningbo Xinhai Aido
- Doga Parts
- KCW Industrial
- Pylon
- Xiamen Phucar Auto
- Zhejiang Guoyu Auto Parts
- Meto Auto Parts
Segment by Type
- Wiper Blade
- Wiper Arm
Segment by Application
- OEM
- Aftermarket
By Region
- United States
- Europe
- China
- Japan
- Southeast Asia
- India
- Other Regions
Table of Contents
1 Wiper Market Overview
- 1.1 Wiper Product Scope
- 1.2 Wiper by Type
- 1.2.1 Global Wiper Sales by Type (2018 & 2022 & 2029)
- 1.2.2 Wiper Blade
- 1.2.3 Wiper Arm
- 1.3 Wiper by Application
- 1.3.1 Global Wiper Sales Comparison by Application (2018 & 2022 & 2029)
- 1.3.2 OEM
- 1.3.3 Aftermarket
- 1.4 Global Wiper Market Estimates and Forecasts (2018-2029)
- 1.4.1 Global Wiper Market Size in Value Growth Rate (2018-2029)
- 1.4.2 Global Wiper Market Size in Volume Growth Rate (2018-2029)
- 1.4.3 Global Wiper Price Trends (2018-2029)
- 1.5 Assumptions and Limitations
2 Wiper Estimates and Forecasts by Region
- 2.1 Global Wiper Market Size by Region: 2018 VS 2022 VS 2029
- 2.2 Global Wiper Retrospective Market Scenario by Region (2018-2023)
- 2.2.1 Global Wiper Sales Market Share by Region (2018-2023)
- 2.2.2 Global Wiper Revenue Market Share by Region (2018-2023)
- 2.3 Global Wiper Market Estimates and Forecasts by Region (2024-2029)
- 2.3.1 Global Wiper Sales Estimates and Forecasts by Region (2024-2029)
- 2.3.2 Global Wiper Revenue Forecast by Region (2024-2029)
- 2.4 Geographic Market Analysis: Market Facts & Figures
- 2.4.1 United States Wiper Estimates and Projections (2018-2029)
- 2.4.2 Europe Wiper Estimates and Projections (2018-2029)
- 2.4.3 China Wiper Estimates and Projections (2018-2029)
- 2.4.4 Japan Wiper Estimates and Projections (2018-2029)
- 2.4.5 Southeast Asia Wiper Estimates and Projections (2018-2029)
- 2.4.6 India Wiper Estimates and Projections (2018-2029)
3 Wiper Competition Landscape by Players
- 3.1 Global Wiper Sales by Players (2018-2023)
- 3.2 Global Top Wiper Players by Revenue (2018-2023)
- 3.3 Global Wiper Market Share by Company Type (Tier 1, Tier 2, and Tier 3) & (based on the Revenue in Wiper as of 2022)
- 3.4 Global Wiper Average Price by Company (2018-2023)
- 3.5 Global Key Manufacturers of Wiper, Manufacturing Sites & Headquarters
- 3.6 Global Key Manufacturers of Wiper, Product Type
4 Wiper Market Size by Type
- 4.1 Global Wiper Historic Market Review by Type (2018-2023)
- 4.1.1 Global Wiper Sales by Type (2018-2023)
- 4.1.2 Global Wiper Revenue by Type (2018-2023)
- 4.1.3 Global Wiper Price by Type (2018-2023)
- 4.2 Global Wiper Market Estimates and Forecasts by Type (2024-2029)
- 4.2.1 Global Wiper Sales Forecast by Type (2024-2029)
- 4.2.2 Global Wiper Revenue Forecast by Type (2024-2029)
- 4.2.3 Global Wiper Price Forecast by Type (2024-2029)
5 Global Wiper Market Size by Application
- 5.1 Global Wiper Historic Market Review by Application (2018-2023)
- 5.1.1 Global Wiper Sales by Application (2018-2023)
- 5.1.2 Global Wiper Revenue by Application (2018-2023)
- 5.1.3 Global Wiper Price by Application (2018-2023)
- 5.2 Global Wiper Market Estimates and Forecasts by Application (2024-2029)
- 5.2.1 Global Wiper Sales Forecast by Application (2024-2029)
- 5.2.2 Global Wiper Revenue Forecast by Application (2024-2029)
- 5.2.3 Global Wiper Price Forecast by Application (2024-2029)
6 United States Wiper Market Facts & Figures
- 6.1 United States Wiper Revenue by Company
- 6.2 United States Wiper Sales Breakdown by Type
- 6.2.1 United States Wiper Sales Breakdown by Type (2018-2023)
- 6.2.2 United States Wiper Sales Breakdown by Type (2024-2029)
- 6.3 United States Wiper Sales Breakdown by Application
- 6.3.1 United States Wiper Sales Breakdown by Application (2018-2023)
- 6.3.2 United States Wiper Sales Breakdown by Application (2024-2029)
7 Europe Wiper Market Facts & Figures
- 7.1 Europe Wiper Revenue by Company
- 7.2 Europe Wiper Sales Breakdown by Type
- 7.2.1 Europe Wiper Sales Breakdown by Type (2018-2023)
- 7.2.2 Europe Wiper Sales Breakdown by Type (2024-2029)
- 7.3 Europe Wiper Sales Breakdown by Application
- 7.3.1 Europe Wiper Sales Breakdown by Application (2018-2023)
- 7.3.2 Europe Wiper Sales Breakdown by Application (2024-2029)
8 China Wiper Market Facts & Figures
- 8.1 China Wiper Revenue by Company
- 8.2 China Wiper Sales Breakdown by Type
- 8.2.1 China Wiper Sales Breakdown by Type (2018-2023)
- 8.2.2 China Wiper Sales Breakdown by Type (2024-2029)
- 8.3 China Wiper Sales Breakdown by Application
- 8.3.1 China Wiper Sales Breakdown by Application (2018-2023)
- 8.3.2 China Wiper Sales Breakdown by Application (2024-2029)
9 Japan Wiper Market Facts & Figures
- 9.1 Japan Wiper Revenue by Company
- 9.2 Japan Wiper Sales Breakdown by Type
- 9.2.1 Japan Wiper Sales Breakdown by Type (2018-2023)
- 9.2.2 Japan Wiper Sales Breakdown by Type (2024-2029)
- 9.3 Japan Wiper Sales Breakdown by Application
- 9.3.1 Japan Wiper Sales Breakdown by Application (2018-2023)
- 9.3.2 Japan Wiper Sales Breakdown by Application (2024-2029)
10 Southeast Asia Wiper Market Facts & Figures
- 10.1 Southeast Asia Wiper Revenue by Company
- 10.2 Southeast Asia Wiper Sales Breakdown by Type
- 10.2.1 Southeast Asia Wiper Sales Breakdown by Type (2018-2023)
- 10.2.2 Southeast Asia Wiper Sales Breakdown by Type (2024-2029)
- 10.3 Southeast Asia Wiper Sales Breakdown by Application
- 10.3.1 Southeast Asia Wiper Sales Breakdown by Application (2018-2023)
- 10.3.2 Southeast Asia Wiper Sales Breakdown by Application (2024-2029)
11 India Wiper Market Facts & Figures
- 11.1 India Wiper Revenue by Company
- 11.2 India Wiper Sales Breakdown by Type
- 11.2.1 India Wiper Sales Breakdown by Type (2018-2023)
- 11.2.2 India Wiper Sales Breakdown by Type (2024-2029)
- 11.3 India Wiper Sales Breakdown by Application
- 11.3.1 India Wiper Sales Breakdown by Application (2018-2023)
- 11.3.2 India Wiper Sales Breakdown by Application (2024-2029)
12 Company Profiles and Key Figures
- 12.1 Valeo
- 12.1.1 Valeo Company Information
- 12.1.2 Valeo Business Overview
- 12.1.3 Valeo Wiper Sales Volume, Revenue and Gross Margin (2018-2023)
- 12.1.4 Valeo Wiper Products Offered
- 12.2 Bosch
- 12.2.1 Bosch Company Information
- 12.2.2 Bosch Business Overview
- 12.2.3 Bosch Wiper Sales Volume, Revenue and Gross Margin (2018-2023)
- 12.2.4 Bosch Wiper Products Offered
- 12.3 Trico
- 12.3.1 Trico Company Information
- 12.3.2 Trico Business Overview
- 12.3.3 Trico Wiper Sales Volume, Revenue and Gross Margin (2018-2023)
- 12.3.4 Trico Wiper Products Offered
- 12.4 Denso
- 12.4.1 Denso Company Information
- 12.4.2 Denso Business Overview
- 12.4.3 Denso Wiper Sales Volume, Revenue and Gross Margin (2018-2023)
- 12.4.4 Denso Wiper Products Offered
- 12.5 Mitsuba
- 12.5.1 Mitsuba Company Information
- 12.5.2 Mitsuba Business Overview
- 12.5.3 Mitsuba Wiper Sales Volume, Revenue and Gross Margin (2018-2023)
- 12.5.4 Mitsuba Wiper Products Offered
- 12.6 HEYNER
- 12.6.1 HEYNER Company Information
- 12.6.2 HEYNER Business Overview
- 12.6.3 HEYNER Wiper Sales Volume, Revenue and Gross Margin (2018-2023)
- 12.6.4 HEYNER Wiper Products Offered
- 12.7 ITW
- 12.7.1 ITW Company Information
- 12.7.2 ITW Business Overview
- 12.7.3 ITW Wiper Sales Volume, Revenue and Gross Margin (2018-2023)
- 12.7.4 ITW Wiper Products Offered
- 12.8 Zhejiang Shenghuabo Electric
- 12.8.1 Zhejiang Shenghuabo Electric Company Information
- 12.8.2 Zhejiang Shenghuabo Electric Business Overview
- 12.8.3 Zhejiang Shenghuabo Electric Wiper Sales Volume, Revenue and Gross Margin (2018-2023)
- 12.8.4 Zhejiang Shenghuabo Electric Wiper Products Offered
- 12.9 CAP
- 12.9.1 CAP Company Information
- 12.9.2 CAP Business Overview
- 12.9.3 CAP Wiper Sales Volume, Revenue and Gross Margin (2018-2023)
- 12.9.4 CAP Wiper Products Offered
- 12.10 HELLA
- 12.10.1 HELLA Company Information
- 12.10.2 HELLA Business Overview
- 12.10.3 HELLA Wiper Sales Volume, Revenue and Gross Margin (2018-2023)
- 12.10.4 HELLA Wiper Products Offered
- 12.11 Ningbo Xinhai Aido
- 12.11.1 Ningbo Xinhai Aido Company Information
- 12.11.2 Ningbo Xinhai Aido Business Overview
- 12.11.3 Ningbo Xinhai Aido Wiper Sales Volume, Revenue and Gross Margin (2018-2023)
- 12.11.4 Ningbo Xinhai Aido Wiper Products Offered
- 12.12 Doga Parts
- 12.12.1 Doga Parts Company Information
- 12.12.2 Doga Parts Business Overview
- 12.12.3 Doga Parts Wiper Sales Volume, Revenue and Gross Margin (2018-2023)
- 12.12.4 Doga Parts Wiper Products Offered
- 12.13 KCW Industrial
- 12.13.1 KCW Industrial Company Information
- 12.13.2 KCW Industrial Business Overview
- 12.13.3 KCW Industrial Wiper Sales Volume, Revenue and Gross Margin (2018-2023)
- 12.13.4 KCW Industrial Wiper Products Offered
- 12.14 Pylon
- 12.14.1 Pylon Company Information
- 12.14.2 Pylon Business Overview
- 12.14.3 Pylon Wiper Sales Volume, Revenue and Gross Margin (2018-2023)
- 12.14.4 Pylon Wiper Products Offered
- 12.15 Xiamen Phucar Auto
- 12.15.1 Xiamen Phucar Auto Company Information
- 12.15.2 Xiamen Phucar Auto Business Overview
- 12.15.3 Xiamen Phucar Auto Wiper Sales Volume, Revenue and Gross Margin (2018-2023)
- 12.15.4 Xiamen Phucar Auto Wiper Products Offered
- 12.16 Zhejiang Guoyu Auto Parts
- 12.16.1 Zhejiang Guoyu Auto Parts Company Information
- 12.16.2 Zhejiang Guoyu Auto Parts Business Overview
- 12.16.3 Zhejiang Guoyu Auto Parts Wiper Sales Volume, Revenue and Gross Margin (2018-2023)
- 12.16.4 Zhejiang Guoyu Auto Parts Wiper Products Offered
- 12.17 Meto Auto Parts
- 12.17.1 Meto Auto Parts Company Information
- 12.17.2 Meto Auto Parts Business Overview
- 12.17.3 Meto Auto Parts Wiper Sales Volume, Revenue and Gross Margin (2018-2023)
- 12.17.4 Meto Auto Parts Wiper Products Offered
13 Research Findings and Conclusion
14 Appendix
- 14.1 Research Methodology
- 14.1.1 Methodology/Research Approach
- 14.1.2 Data Source
- 14.2 Author Details
- 14.3 Disclaimer