|
|
市場調査レポート
商品コード
1249471
東南アジア・インドのグロボイダルインデキシングテーブル市場:分析と予測 (2022年~2028年)Southeast Asia and India Globoidal Indexing Tables Market Report & Forecast 2022-2028 |
||||||
|
|
|||||||
|
● お客様のご希望に応じて、既存データの加工や未掲載情報(例:国別セグメント)の追加などの対応が可能です。 詳細はお問い合わせください。 |
|||||||


| 東南アジア・インドのグロボイダルインデキシングテーブル市場:分析と予測 (2022年~2028年) |
|
出版日: 2023年03月31日
発行: QYResearch
ページ情報: 英文 103 Pages
納期: 2~3営業日
|
- 全表示
- 概要
- 図表
- 目次
東南アジア・インドのグロボイダルインデキシングテーブルの市場規模は、COVID-19の流行により、2022年に3,063万米ドルに達した後、分析期間中 (2023年~2028年) に7.35%のCAGRで成長し、2028年までに4,684万米ドルの再調整サイズになると予測されます。
東南アジアのグロボイダルインデキシングテーブルの市場規模は、2022年の1,693万米ドルから、2028年には2,653万米ドルにまで達し、予測期間 (2023年~2028) に8.09%のCAGRで成長する、と予測されています。
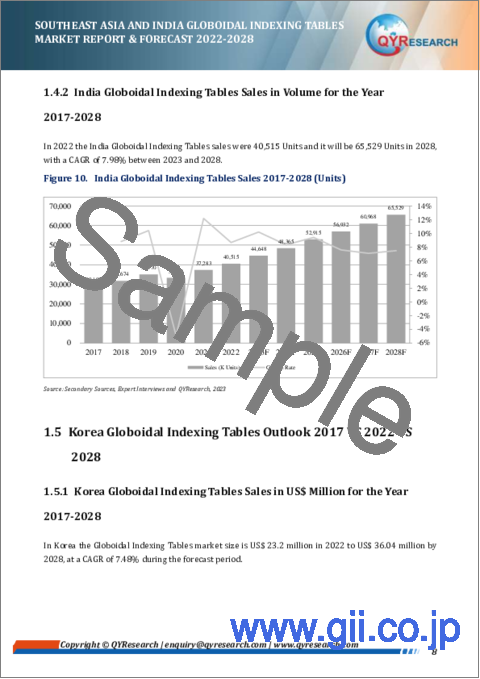
インドのグロボイダルインデキシングテーブルの市場規模は、予測期間中 (2023年~2028年) に6.43%のCAGRで成長し、2022年の1,238万米ドルから2028年には2,031万米ドルに達する、と予測されています。
当レポートでは、東南アジア諸国およびインドのグロボイダルインデキシングテーブルの市場について分析し、種類別・用途別・国別の市場動向の見通し (2017年~2028年)、主要企業のプロファイルなどについて調査しております。
目次
第1章 調査範囲
- グロボイダルインデキシングテーブル:製品概要
- 東南アジア・インドのグロボイダルインデキシングテーブル市場の見通し (2017年・2022年・2028年)
- 販売額 (単位:100万米ドル、2017年~2028年)
- 販売量 (単位:台、2017年~2028年)
- 東南アジアのグロボイダルインデキシングテーブル市場の見通し (2017年・2022年・2028年)
- インドのグロボイダルインデキシングテーブル市場の見通し (2017年・2022年・2028年)
- 韓国のグロボイダルインデキシングテーブル市場の見通し (2017年・2022年・2028年)
- グロボイダルインデキシングテーブルの市場力学
- グロボイダルインデキシングテーブル業界の動向
- グロボイダルインデキシングテーブル市場の促進要因
- グロボイダルインデキシングテーブル市場の課題と抑制要因
- 分析対象
- 分析期間
第2章 グロボイダルインデキシングテーブル:種類別
- グロボイダルインデキシングテーブル市場:種類別の内訳
- シャフト出力
- フランジ出力
- ホロー出力
- その他
- 東南アジアのグロボイダルインデキシングテーブルの市場規模:種類別
- 販売額:種類別 (2017年・2022年・2028年)
- 販売量:種類別 (2017年~2028年)
- インドのグロボイダルインデキシングテーブルの市場規模:種類別
- 販売額:種類別 (2017年・2022年・2028年)
- 販売量:種類別 (2017年~2028年)
第3章 グロボイダルインデキシングテーブル:用途別
- グロボイダルインデキシングテーブル市場:用途別の内訳
- 自動車
- 食品・包装
- エレクトロニクス・半導体
- 医療・製薬
- その他
- 東南アジアのグロボイダルインデキシングテーブルの市場規模:用途別
- 販売額:用途別 (2017年・2022年・2028年)
- 販売量:用途別 (2017年・2022年・2028年)
- インドのグロボイダルインデキシングテーブルの市場規模:用途別
- 販売額:用途別 (2017年・2022年・2028年)
- 販売量:用途別 (2017年・2022年・2028年)
第4章 企業別の競合情勢
- 東南アジアのグロボイダルインデキシングテーブルの市場規模:企業別
- グロボイダルインデキシングテーブルメーカー:収益別ランキング (2022年)
- グロボイダルインデキシングテーブルの収益:メーカー別 (2017年~2022年)
- グロボイダルインデキシングテーブルの販売:メーカー別 (2017年~2022年)
- グロボイダルインデキシングテーブルの価格:メーカー別 (2017年~2022年)
- インドのグロボイダルインデキシングテーブルの市場規模:企業別
- グロボイダルインデキシングテーブルメーカー:収益別ランキング (2022年)
- グロボイダルインデキシングテーブルの収益:メーカー別 (2017年~2022年)
- グロボイダルインデキシングテーブルの販売:メーカー別 (2017年~2022年)
- グロボイダルインデキシングテーブルの価格:メーカー別 (2017年~2022年)
- 東南アジア・インドのグロボイダルインデキシングテーブルの製造拠点・製品種類
- グロボイダルインデキシングテーブルメーカーの本社・製造地域
- グロボイダルインデキシングテーブルメーカー:製品種類
- メーカーの設立時期
第5章 東南アジア
- 東南アジアのグロボイダルインデキシングテーブル市場:国別の詳細データ (2017年・2022年・2028年)
- 販売量:国別 (2017年~2028年)
- 販売額:国別 (2017年・2022年・2028年)
- インドネシア
- シンガポール
- マレーシア
- フィリピン
- タイ
- ベトナム
第6章 企業プロファイル
- Sankyo Seisakusho
- GOIZPER INDEXERS
- Cam Driven Systems (CDS)
- DESTACO
- Italplant Srl
- Hannz Motrol
- Pascal
- Colombo Filippetti
- Packam Controls Private Limited
第13章 産業チェーンと販売チャネルの分析
- グロボイダルインデキシングテーブルの産業チェーンの分析
- グロボイダルインデキシングテーブルの主要原材料
- グロボイダルインデキシングテーブルの製造モードとプロセス
- グロボイダルインデキシングテーブルの販売とマーケティング
- グロボイダルインデキシングテーブルの顧客
第8章 調査結果と結論
第9章 付録
List of Tables
- Table 1. Globoidal Indexing Tables Market Trends
- Table 2. Globoidal Indexing Tables Market Drivers
- Table 3. Globoidal Indexing Tables Market Challenges & Restraints
- Table 4. Southeast Asia Globoidal Indexing Tables Sales by Type: 2017 VS 2022 VS 2028 (US$ Million)
- Table 5. Southeast Asia Globoidal Indexing Tables Sales in Value by Type (2017-2022) & (US$ Million)
- Table 6. Southeast Asia Globoidal Indexing Tables Sales in Value by Type (2023-2028) & (US$ Million)
- Table 7. Southeast Asia Globoidal Indexing Tables Sales by Type (2017-2022) & (Units)
- Table 8. Southeast Asia Globoidal Indexing Tables Sales by Type (2023-2028) & (Units)
- Table 9. India Globoidal Indexing Tables Sales by Type: 2017 VS 2022 VS 2028 (US$ Million)
- Table 10. India Globoidal Indexing Tables Sales in Value by Type (2017-2022) & (US$ Million)
- Table 11. India Globoidal Indexing Tables Sales in Value by Type (2023-2028) & (US$ Million)
- Table 12. India Indexing Tables Sales by Type (2017-2022) & (Units)
- Table 13. India Globoidal Indexing Tables Sales by Type (2023-2028) & (Units)
- Table 14. Southeast Asia Globoidal Indexing Tables Sales by Application: 2017 VS 2022 VS 2028 (Units)
- Table 15. Southeast Asia Globoidal Indexing Tables Sales by Application (2017-2022) & (Units)
- Table 16. Southeast Asia Globoidal Indexing Tables Sales by Application (2023-2028) & (Units)
- Table 17. India Globoidal Indexing Tables Sales by Application: 2017 VS 2022 VS 2028 (Units)
- Table 18. Inida Globoidal Indexing Tables Sales by Application (2017-2022) & (Units)
- Table 19. India Globoidal Indexing Tables Sales by Application (2023-2028) & (Units)
- Table 20. Key Globoidal Indexing Tables Manufacturers in Southeast Asia Market, Ranking by Revenue (2022)
- Table 21. Southeast Asia Globoidal Indexing Tables Revenue by Manufacturer, (US$ Million), 2017-2022
- Table 22. Southeast Asia Globoidal Indexing Tables Revenue Share by Manufacturer, 2017-2022
- Table 23. Southeast Asia Globoidal Indexing Tables Sales by Manufacturer, (Units), 2017-2022
- Table 24. Southeast Asia Globoidal Indexing Tables Sales Share by Manufacturer, 2017-2022
- Table 25. Southeast Asia Globoidal Indexing Tables Price by Manufacturer (2017-2022) & (US$/Unit)
- Table 26. Key Globoidal Indexing Tables Manufacturers in India Market, Ranking by Revenue (2022)
- Table 27. India Globoidal Indexing Tables Revenue by Manufacturer, (US$ Million), 2017-2022
- Table 28. India Globoidal Indexing Tables Revenue Share by Manufacturer, 2017-2022
- Table 29. India Globoidal Indexing Tables Sales by Manufacturer, (Units), 2017-2022
- Table 30. India Globoidal Indexing Tables Sales Share by Manufacturer, 2017-2022
- Table 31. India Globoidal Indexing Tables Price by Manufacturer (2017-2022) & (US$/Unit)
- Table 32. Top Players of Globoidal Indexing Tables in Southeast Asia and India Market, Headquarters and Distribution of Producing Region
- Table 33. Manufacturers Globoidal Indexing Tables Product Type
- Table 34. Date of Manufacturers Was Established
- Table 35. Southeast Asia Globoidal Indexing Tables Sales in Volume by Country (2017-2022) & (Units)
- Table 36. Southeast Asia Globoidal Indexing Tables Sales in Volume by Country (2023-2028) & (Units)
- Table 37. Southeast Asia Globoidal Indexing Tables Sales in Value by Country (2017-2022) & (US$ Million)
- Table 38. Southeast Asia Globoidal Indexing Tables Sales in Value by Country (2023-2028) & (US$ Million)
- Table 43. Sankyo Seisakusho Corporation Information
- Table 44. Sankyo Seisakusho Description and Business Overview
- Table 45. Sankyo Seisakusho Globoidal Indexing Tables Sales (Units), Revenue (US$ Million), Price (US$/Unit) and Gross Margin (2017-2022)
- Table 46. Sankyo Seisakusho Globoidal Indexing Tables Product
- Table 47. GOIZPER INDEXERS Corporation Information
- Table 48. GOIZPER INDEXERS Description and Business Overview
- Table 49. GOIZPER INDEXERS Globoidal Indexing Tables Sales (Units), Revenue (US$ Million), Price (US$/Unit) and Gross Margin (2017-2022)
- Table 50. GOIZPER INDEXERS Globoidal Indexing Tables Product
- Table 51. Cam Driven Systems (CDS) Corporation Information
- Table 52. Cam Driven Systems (CDS) Description and Business Overview
- Table 53. Cam Driven Systems (CDS) Globoidal Indexing Tables Sales (Units), Revenue (US$ Million), Price (US$/Unit) and Gross Margin (2017-2022)
- Table 54. Cam Driven Systems (CDS) Globoidal Indexing Tables Product
- Table 55. DESTACO Corporation Information
- Table 56. DESTACO Description and Business Overview
- Table 57. DESTACO Globoidal Indexing Tables Sales (Units), Revenue (US$ Million), Price (US$/Unit) and Gross Margin (2017-2022)
- Table 58. DESTACO Globoidal Indexing Tables Product
- Table 59. Italplant S.r.l. Corporation Information
- Table 60. Italplant S.r.l. Description and Business Overview
- Table 61. Italplant S.r.l. Globoidal Indexing Tables Sales (Units), Revenue (US$ Million), Price (US$/Unit) and Gross Margin (2017-2022)
- Table 62. Italplant S.r.l. Globoidal Indexing Tables Product
- Table 63. Hannz Motrol Corporation Information
- Table 64. Hannz Motrol Description and Business Overview
- Table 65. Hannz Motrol Globoidal Indexing Tables Sales (Units), Revenue (US$ Million), Price (US$/Unit) and Gross Margin (2017-2022)
- Table 66. Hannz Motrol Globoidal Indexing Tables Product
- Table 67. Pascal Corporation Information
- Table 68. Pascal Description and Business Overview
- Table 69. Pascal Globoidal Indexing Tables Sales (Units), Revenue (US$ Million), Price (US$/Unit) and Gross Margin (2017-2022)
- Table 70. Pascal Globoidal Indexing Tables Product
- Table 71. Colombo Filippetti Corporation Information
- Table 72. Colombo Filippetti Description and Business Overview
- Table 73. Colombo Filippetti Globoidal Indexing Tables Sales (Units), Revenue (US$ Million), Price (US$/Unit) and Gross Margin (2017-2022)
- Table 74. Colombo Filippetti Globoidal Indexing Tables Product
- Table 75. Packam Controls Private Limited Corporation Information
- Table 76. Packam Controls Private Limited Description and Business Overview
- Table 77. Packam Controls Private Limited Globoidal Indexing Tables Sales (Units), Revenue (US$ Million), Price (US$/Unit) and Gross Margin (2017-2022)
- Table 78. Packam Controls Private Limited Globoidal Indexing Tables Product
- Table 79. Key Raw Materials Lists
- Table 80. Raw Materials Key Suppliers Lists
- Table 81. Globoidal Indexing Tables Distributors List
- Table 82. Globoidal Indexing Tables Customers List
- Table 83. Research Programs/Design for This Report
- Table 84. Key Data Information from Secondary Sources
- Table 85. Key Data Information from Primary Sources
List of Figures
- Figure 1. Globoidal Indexing Tables Product Picture
- Figure 2. Southeast Asia and India Globoidal Indexing Tables Revenue, (US$ Million), 2017 VS 2022 VS 2028
- Figure 3. Southeast Asia and India Globoidal Indexing Tables Market Size 2017-2028 (US$ Million)
- Figure 4. Southeast Asia and India Globoidal Indexing Tables Sales 2017-2028 (Units)
- Figure 5. Southeast Asia Globoidal Indexing Tables Revenue, (US$ Million), 2017 VS 2022 VS 2028
- Figure 6. Southeast Asia Globoidal Indexing Tables Market Size 2017-2028 (US$ Million)
- Figure 7. Southeast Asia Globoidal Indexing Tables Sales 2017-2028 (Units)
- Figure 8. India Globoidal Indexing Tables Revenue, (US$ Million), 2017 VS 2022 VS 2028
- Figure 9. India Globoidal Indexing Tables Market Size 2017-2028 (US$ Million)
- Figure 10. India Globoidal Indexing Tables Sales 2017-2028 (Units)
- Figure 11. Korea Globoidal Indexing Tables Revenue, (US$ Million), 2017 VS 2022 VS 2028
- Figure 12. Korea Globoidal Indexing Tables Market Size 2017-2028 (US$ Million)
- Figure 13. Korea Globoidal Indexing Tables Sales 2017-2028 (Units)
- Figure 14. Globoidal Indexing Tables Report Years Considered
- Figure 15. Product Picture of Shaft Output
- Figure 16. Product Picture of Flanged Output
- Figure 17. Product Picture of Hollow Output
- Figure 18. Product Picture of Platform Desktop Type
- Figure 19. Southeast Asia Globoidal Indexing Tables Market Share by Type in 2022 & 2028
- Figure 20. Southeast Asia Globoidal Indexing Tables Sales Market Share in Value by Type (2017-2028)
- Figure 21. Southeast Asia Globoidal Indexing Tables Sales Market Share in Volume by Type (2017-2028)
- Figure 22. India Globoidal Indexing Tables Market Share by Type in 2022 & 2028
- Figure 23. India Globoidal Indexing Tables Sales Market Share in Value by Type (2017-2028)
- Figure 24. India Globoidal Indexing Tables Sales Market Share by Type (2017-2028)
- Figure 25. Product Picture of Automotive
- Figure 26. Product Picture of Food and Packaging
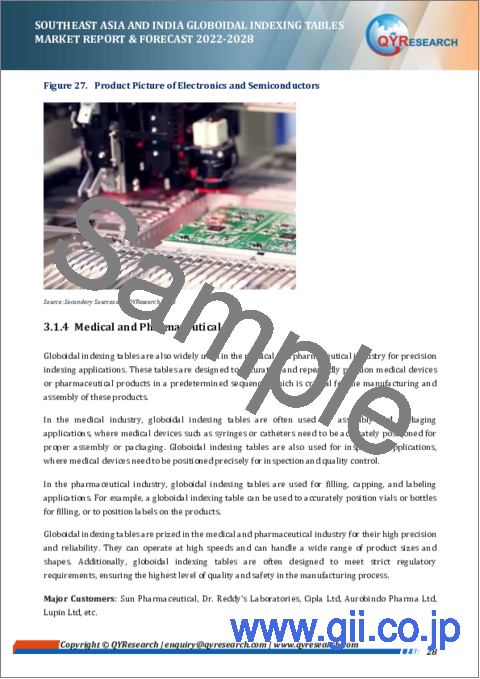
- Figure 27. Product Picture of Electronics and Semiconductors
- Figure 28. Product Picture of Medical and Pharmaceutical
- Figure 29. Product Picture of Cosmetics
- Figure 30. Southeast Asia Globoidal Indexing Tables Market Share by Application in 2022 & 2028
- Figure 31. Southeast Asia Globoidal Indexing Tables Sales Market Share in Volume by Application (2017-2028)
- Figure 32. India Globoidal Indexing Tables Market Share by Application in 2022 & 2028
- Figure 33. India Globoidal Indexing Tables Sales Market Share in Volume by Application (2017-2028)
- Figure 34. Southeast Asia Globoidal Indexing Tables Sales Market Share (in Volume) by Country (2017-2028)
- Figure 35. Southeast Asia Globoidal Indexing Tables Sales Market Share (in Value) by Country (2017-2028)
- Figure 36. Indonesia Globoidal Indexing Tables Sales in Value Growth Rate (2017-2028) & (US$ Million)
- Figure 37. Singapore Globoidal Indexing Tables Sales in Value Growth Rate (2017-2028) & (US$ Million)
- Figure 38. Malaysia Globoidal Indexing Tables Sales in Value Growth Rate (2017-2028) & (US$ Million)
- Figure 39. Philippines Globoidal Indexing Tables Sales in Value Growth Rate (2017-2028) & (US$ Million)
- Figure 40. Thailand Globoidal Indexing Tables Sales in Value Growth Rate (2017-2028) & (US$ Million)
- Figure 41. Vietnam Globoidal Indexing Tables Sales in Value Growth Rate (2017-2028) & (US$ Million)
- Figure 42. Globoidal Indexing Tables Value Chain
- Figure 43. Globoidal Indexing Tables Production Process
- Figure 44. Channels of Distribution
- Figure 45. Distributors Profiles
- Figure 46. Bottom-up and Top-down Approaches for This Report
- Figure 47. Data Triangulation
- Figure 48. Key Executives Interviewed
Market Analysis and Insights: Southeast Asia and India Globoidal Indexing Tables Market
This report focuses on Southeast Asia and India Globoidal Indexing Tables market, also covers the segmentation data of other regions in regional level and county level.
Due to the COVID-19 pandemic, the Southeast Asia Globoidal Indexing Tables market size is US$ 30.63 million in 2022 and is forecast to a readjusted size of US$ 46.84 million by 2028 with a CAGR of 7.35% during the review period (2023-2028).
In Southeast Asia the Globoidal Indexing Tables market size is expected to grow from US$ 16.93 million in 2022 to US$ 26.53 million by 2028, at a CAGR of 8.09% during the forecast period (2023-2028).
In India the Globoidal Indexing Tables market size is expected to grow from US$ 12.38 million in 2022 to US$ 20.31 million by 2028, at a CAGR of 6.43% during the forecast period (2023-2028).
Southeast Asia and India Globoidal Indexing Tables Scope and Market Size
Globoidal Indexing Tables market is segmented in regional and country level, by players, by Type, and by Application. Players, stakeholders, and other participants in the Southeast Asia and India Globoidal Indexing Tables market will be able to gain the upper hand as they use the report as a powerful resource. The segmental analysis focuses on sales, revenue and forecast by Type and by Application for the period 2017-2028.
By Company
- EXPERT-TUNKERS GmbH
- Sankyo Seisakusho
- GOIZPER INDEXERS
- Cam Driven Systems (CDS)
- DESTACO (Dover)
- Italplant S.r.l.
- Hannz Motrol
- Pascal
- Colombo Filippetti S.p.A.
- Packam Controls Private Limited
Segment by Type
- Shaft Output
- Flanged Output
- Hollow Output
- Other
Segment by Application
- Automotive
- Food and Packaging
- Electronics and Semiconductors
- Medical and Pharmaceutical
- Others
Southeast Asia and India Segment by Country
- Indonesia
- Thailand
- Malaysia
- Philippines
- Vietnam
- Singapore
Table of Contents
1 Study Coverage
- 1.1 Globoidal Indexing Tables Product Introduction
- 1.2 Southeast Asia and India Globoidal Indexing Tables Outlook 2017 VS 2022 VS 2028
- 1.2.1 Southeast Asia and India Globoidal Indexing Tables Sales in US$ Million for the Year 2017-2028
- 1.2.2 Southeast Asia and India Globoidal Indexing Tables Sales in Volume for the Year 2017-2028
- 1.3 Southeast Asia Globoidal Indexing Tables Outlook 2017 VS 2022 VS 2028
- 1.3.1 Southeast Asia Globoidal Indexing Tables Sales in US$ Million for the Year 2017-2028
- 1.3.2 Southeast Asia Globoidal Indexing Tables Sales in Volume for the Year 2017-2028
- 1.4 India Globoidal Indexing Tables Outlook 2017 VS 2022 VS 2028
- 1.4.1 India Globoidal Indexing Tables Sales in US$ Million for the Year 2017-2028
- 1.4.2 India Globoidal Indexing Tables Sales in Volume for the Year 2017-2028
- 1.5 Korea Globoidal Indexing Tables Outlook 2017 VS 2022 VS 2028
- 1.5.1 Korea Globoidal Indexing Tables Sales in US$ Million for the Year 2017-2028
- 1.5.2 Korea Globoidal Indexing Tables Sales in Volume for the Year 2017-2028
- 1.6 Globoidal Indexing Tables Market Dynamics
- 1.6.1 Globoidal Indexing Tables Industry Trends
- 1.6.2 Globoidal Indexing Tables Market Drivers
- 1.6.3 Globoidal Indexing Tables Market Challenges & Restraints
- 1.7 Study Objectives
- 1.8 Years Considered
2 Globoidal Indexing Tables by Type
- 2.1 Globoidal Indexing Tables Market Segment by Type
- 2.1.1 Shaft Output
- 2.1.2 Flanged Output
- 2.1.3 Hollow Output
- 2.1.4 Other
- 2.2 Southeast Asia Globoidal Indexing Tables Market Size by Type
- 2.2.1 Southeast Asia Globoidal Indexing Tables Sales in Value, by Type (2017, 2022 & 2028)
- 2.2.2 Southeast Asia Globoidal Indexing Tables Sales by Type (2017 - 2028)
- 2.3 India Globoidal Indexing Tables Market Size by Type
- 2.3.1 India Globoidal Indexing Tables Sales in Value, by Type (2017, 2022 & 2028)
- 2.3.2 India Globoidal Indexing Tables Sales in Volume, by Type (2017-2028)
3 Globoidal Indexing Tables by Application
- 3.1 Globoidal Indexing Tables Market Segment by Application
- 3.1.1 Automotive
- 3.1.2 Food and Packaging
- 3.1.3 Electronics and Semiconductors
- 3.1.4 Medical and Pharmaceutical
- 3.1.5 Others
- 3.2 Southeast Asia Globoidal Indexing Tables Market Size by Application
- 3.2.1 Southeast Asia Globoidal Indexing Tables Sales, by Application (2017, 2022 & 2028)
- 3.2.2 Southeast Asia Globoidal Indexing Tables Sales in Volume, by Application (2017, 2022 & 2028)
- 3.3 India Globoidal Indexing Tables Market Size by Application
- 3.3.1 India Globoidal Indexing Tables Sales, by Application (2017, 2022 & 2028)
- 3.3.2 India Globoidal Indexing Tables Sales in Volume, by Application (2017, 2022 & 2028)
4 Competitor Landscape by Company
- 4.1 Southeast Asia Globoidal Indexing Tables Market Size by Company
- 4.1.1 Southeast Asia Globoidal Indexing Tables Manufacturers Ranked by Revenue (2022)
- 4.1.2 Southeast Asia Globoidal Indexing Tables Revenue by Manufacturer (2017-2022)
- 4.1.3 Southeast Asia Globoidal Indexing Tables Sales by Manufacturer (2017-2022)
- 4.1.4 Southeast Asia Globoidal Indexing Tables Price by Manufacturer (2017-2022)
- 4.2 India Globoidal Indexing Tables Market Size by Company
- 4.2.1 India Globoidal Indexing Tables Manufacturers Ranked by Revenue (2022)
- 4.2.2 India Globoidal Indexing Tables Revenue by Manufacturer (2017-2022)
- 4.2.3 India Globoidal Indexing Tables Sales by Manufacturer (2017-2022)
- 4.2.4 India Globoidal Indexing Tables Price by Manufacturer (2017-2022)
- 4.3 Southeast Asia and India Globoidal Indexing Tables Manufacturing Base Distribution, Product Type
- 4.3.1 Southeast Asia and India Globoidal Indexing Tables Manufacturers, Headquarters and Distribution of Producing Region
- 4.3.2 Manufacturers Globoidal Indexing Tables Product Type
- 4.3.3 Date of Manufacturers Was Established
5 Southeast Asia
- 5.1 Southeast Asia Globoidal Indexing Tables Market Facts & Figures by Country (2017, 2022 & 2028)
- 5.1.1 Southeast Asia Globoidal Indexing Tables Sales in Volume by Country (2017-2028)
- 5.1.2 Southeast Asia Globoidal Indexing Tables Sales in Value by Country (2017, 2022 & 2028)
- 5.2 Indonesia
- 5.3 Singapore
- 5.4 Malaysia
- 5.5 Philippines
- 5.6 Thailand
- 5.7 Vietnam
6 Company Profiles
- 6.2 Sankyo Seisakusho
- 6.2.1 Sankyo Seisakusho Corporation Information
- 6.2.2 Sankyo Seisakusho Description and Business Overview
- 6.2.3 Sankyo Seisakusho in Southeast Asia and India: Globoidal Indexing Tables Sales, Revenue and Gross Margin (2017-2022)
- 6.2.4 Sankyo Seisakusho Globoidal Indexing Tables Products Offered
- 6.3 GOIZPER INDEXERS
- 6.3.1 GOIZPER INDEXERS Corporation Information
- 6.3.2 GOIZPER INDEXERS Description and Business Overview
- 6.3.3 GOIZPER INDEXERS in Southeast Asia and India: Globoidal Indexing Tables Sales, Revenue and Gross Margin (2017-2022)
- 6.3.4 GOIZPER INDEXERS Globoidal Indexing Tables Products Offered
- 6.4 Cam Driven Systems (CDS)
- 6.4.1 Cam Driven Systems (CDS) Corporation Information
- 6.4.2 Cam Driven Systems (CDS) Description and Business Overview
- 6.4.3 Cam Driven Systems (CDS) in Southeast Asia and India: Globoidal Indexing Tables Sales, Revenue and Gross Margin (2017-2022)
- 6.4.4 Cam Driven Systems (CDS) Globoidal Indexing Tables Products Offered
- 6.5 DESTACO
- 6.5.1 DESTACO Corporation Information
- 6.5.2 DESTACO Description and Business Overview
- 6.5.3 DESTACO in Southeast Asia and India: Globoidal Indexing Tables Sales, Revenue and Gross Margin (2017-2022)
- 6.5.4 DESTACO Globoidal Indexing Tables Products Offered
- 6.6 Italplant S.r.l.
- 6.6.1 Italplant S.r.l. Corporation Information
- 6.6.2 Italplant S.r.l. Description and Business Overview
- 6.6.3 Italplant S.r.l. in Southeast Asia and India: Globoidal Indexing Tables Sales, Revenue and Gross Margin (2017-2022)
- 6.6.4 Italplant S.r.l. Globoidal Indexing Tables Products Offered
- 6.7 Hannz Motrol
- 6.7.1 Hannz Motrol Corporation Information
- 6.7.2 Hannz Motrol Description and Business Overview
- 6.7.3 Hannz Motrol in Southeast Asia and India: Globoidal Indexing Tables Sales, Revenue and Gross Margin (2017-2022)
- 6.7.4 Hannz Motrol Globoidal Indexing Tables Products Offered
- 6.8 Pascal
- 6.8.1 Pascal Corporation Information
- 6.8.2 Pascal Description and Business Overview
- 6.8.3 Pascal in Southeast Asia and India: Globoidal Indexing Tables Sales, Revenue and Gross Margin (2017-2022)
- 6.8.4 Pascal Globoidal Indexing Tables Products Offered
- 6.9 Colombo Filippetti
- 6.9.1 Colombo Filippetti Corporation Information
- 6.9.2 Colombo Filippetti Description and Business Overview
- 6.9.3 Colombo Filippetti in Southeast Asia and India: Globoidal Indexing Tables Sales, Revenue and Gross Margin (2017-2022)
- 6.9.4 Colombo Filippetti Globoidal Indexing Tables Products Offered
- 6.10 Packam Controls Private Limited
- 6.10.1 Packam Controls Private Limited Corporation Information
- 6.10.2 Packam Controls Private Limited Description and Business Overview
- 6.10.3 Packam Controls Private Limited in Southeast Asia and India: Globoidal Indexing Tables Sales, Revenue and Gross Margin (2017-2022)
- 6.10.4 Packam Controls Private Limited Globoidal Indexing Tables Products Offered
7 Industry Chain and Sales Channels Analysis
- 7.1 Globoidal Indexing Tables Industry Chain Analysis
- 7.2 Globoidal Indexing Tables Key Raw Materials
- 7.2.1 Key Raw Materials
- 7.2.2 Raw Materials Key Suppliers
- 7.3 Globoidal Indexing Tables Production Mode & Process
- 7.4 Globoidal Indexing Tables Sales and Marketing
- 7.4.1 Globoidal Indexing Tables Sales Channels
- 7.4.2 Globoidal Indexing Tables Distributors
- 7.5 Globoidal Indexing Tables Customers
8 Research Findings and Conclusion
9 Appendix
- 9.1 Research Methodology
- 9.1.1 Methodology/Research Approach
- 9.1.2 Data Source
- 9.2 Author Details
- 9.3 Disclaimer