|
|
市場調査レポート
商品コード
1249446
ゴムリサイクルの世界市場:産業分析・成長動向・競合分析 (2023年~2029年)Global Rubber Recycling Industry Research Report, Growth Trends and Competitive Analysis 2023-2029 |
||||||
|
|
|||||||
|
● お客様のご希望に応じて、既存データの加工や未掲載情報(例:国別セグメント)の追加などの対応が可能です。 詳細はお問い合わせください。 |
|||||||


| ゴムリサイクルの世界市場:産業分析・成長動向・競合分析 (2023年~2029年) |
|
出版日: 2023年03月29日
発行: QYResearch
ページ情報: 英文 162 Pages
納期: 2~3営業日
|
- 全表示
- 概要
- 図表
- 目次
世界のゴムリサイクルの市場規模は、COVID-19の大流行により、2022年に38億9,000万米ドルに達した後、予測期間中 (2023年~2029年) に2.84%のCAGRで成長し、2029年までに47億1,000万米ドルの再調整規模になると予測されます。
この健康危機による経済変化を十分に考慮し、2022年に世界市場の82.77%を占めるタイヤ由来製品は、2023年から2029年にかけて2.91%のCAGRで成長し、2029年までに39億3,000万米ドルの規模に達すると予測されます。一方、製造業向け代替燃料のセグメントは、この予測期間を通じて2.47%のCAGRに変更されています。
当レポートでは、世界のゴムリサイクルの市場について分析し、種類別・用途別・地域別 (国別) の市場動向の見通し (2018年~2029年)、主要企業のプロファイルなどについて調査しております。
目次
第1章 分析概要
- 分析範囲
- 種類別の市場分析
- 市場規模・成長率:種類別 (2018年・2022年・2029年)
- タイヤ由来燃料
- タイヤ由来製品
- 用途別の市場
- 市場成長率:用途別 (2018年・2022年・2029年)
- 製造業向け代替燃料
- 建設・土木
- 消費財
- スポーツ・レジャー
- その他
- 前提・制約条件
- 分析対象
- 分析期間
第2章 市場の展望
- 世界のゴムリサイクルの市場規模 (2018年~2029年)
- 主要地域のゴムリサイクルの市場規模 (2018年・2022年・2029年)
- 世界のゴムリサイクルの市場規模:地域別 (2018年~2023年)
- 世界のゴムリサイクルの市場規模、予測:地域別 (2024年~2029年)
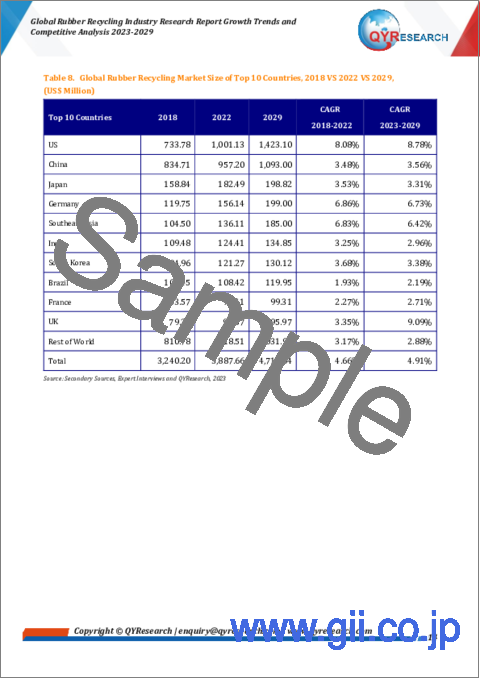
- ゴムリサイクルの市場規模:上位10ヶ国のランキング
第3章 企業別の競合情勢
- 世界のゴムリサイクルの収益:企業別
- 市場シェア:企業の種類別 (ティア1、ティア2、ティア3)
- 分析対象企業:ゴムリサイクルの収益別のランキング
- 世界のゴムリサイクル市場の集中度
- ゴムリサイクルの主要企業:本社・提供エリア
- 企業合併・買収 (M&A)、拡張計画
第4章 ゴムリサイクル:種類別の内訳データ
- 過去の市場規模:種類別 (2018年~2023年)
- 市場規模の予測:種類別 (2024年~2029年)
第5章 ゴムリサイクル:用途別の内訳データ
- 過去の市場規模:用途別 (2018年~2023年)
- 市場規模の予測:用途別 (2024年~2029年)
第6章 北米
- 北米のゴムリサイクルの収益:企業別 (2021年~2023年)
- 北米のゴムリサイクルの収益:種類別 (2018年~2029年)
- 北米のゴムリサイクルの収益:用途別 (2018年~2029年)
- 北米のゴムリサイクルの収益:国別 (2018年~2029年)
- 米国
- カナダ
第7章 欧州
- 欧州のゴムリサイクルの収益:企業別 (2021年~2023年)
- 欧州のゴムリサイクルの収益:種類別 (2018年~2029年)
- 欧州のゴムリサイクルの収益:用途別 (2018年~2029年)
- 欧州のゴムリサイクルの収益:国別 (2018年~2029年)
- ドイツ
- フランス
- 英国
- イタリア
- スペイン
- ロシア
第8章 アジア太平洋
- アジア太平洋のゴムリサイクルの収益:企業別 (2021年~2023年)
- アジア太平洋のゴムリサイクルの収益:種類別 (2018年~2029年)
- アジア太平洋のゴムリサイクルの収益:用途別 (2018年~2029年)
- アジア太平洋のゴムリサイクルの収益:国別 (2018年~2029年)
- 中国
- 日本
- 韓国
- オーストラリア
- 東南アジア
- インド
第9章 ラテンアメリカ
- ラテンアメリカのゴムリサイクルの収益:企業別 (2021年~2023年)
- ラテンアメリカのゴムリサイクルの収益:種類別 (2018年~2029年)
- ラテンアメリカのゴムリサイクルの収益:用途別 (2018年~2029年)
- ラテンアメリカのゴムリサイクルの収益:国別 (2018年~2029年)
- ブラジル
- メキシコ
第10章 中東・アフリカ
- 中東・アフリカのゴムリサイクルの収益:企業別 (2021年~2023年)
- 中東・アフリカのゴムリサイクルの収益:種類別 (2018年~2029年)
- 中東・アフリカのゴムリサイクルの収益:用途別 (2018年~2029年)
- 中東・アフリカのゴムリサイクルの収益:国別 (2018年~2029年)
- アフリカ
- トルコ
- イスラエル
第11章 企業プロファイル
- Liberty Tire Services
- Genan
- Nantong Huili Rubber Co., Ltd
- CRM Rubber
- Emanuel Tire
- Scandinavian Enviro
- Tyrecycle
- Murfitts
- Jinan Laiwu Fuquan Rubber
- Tire Disposal &Recycling
- Entech
- L&S Tire
- Manhantango Enterprises
- Pyrum Innovations
- Kokubu Shokai
- ZC Rubber
- Beijing New Universal Science and Technology Co., Ltd.
- EPSCO Global General Trading recycling company
- Tyrec
- AKO Group
- Carbones del Cerrejon
第12章 ゴムリサイクルの市場力学
- ゴムリサイクル業界の動向
- ゴムリサイクル市場の促進要因
- ゴムリサイクル市場の課題
第13章 分析結果と結論
第14章 付録
List of Tables
- Table 1. Global Rubber Recycling Market Size Growth Rate (CAGR) by Type (US$ Million): 2018 VS 2022 VS 2029
- Table 2. Global Rubber Recycling Market Size Growth Rate (CAGR) by Application (US$ Million): 2018 VS 2022 VS 2029
- Table 3. Global Rubber Recycling Market Size (US$ Million) Growth Rate (CAGR) by Region: 2018 VS 2022 VS 2029
- Table 4. Global Rubber Recycling Revenue by Region (2018-2023) & (US$ Million)
- Table 5. Global Rubber Recycling Revenue Market Share by Region (2018-2023)
- Table 6. Global Rubber Recycling Revenue Forecast by Region (2024-2029) & (US$ Million)
- Table 7. Global Rubber Recycling Revenue Market Share Forecast by Region (2024-2029)
- Table 8. Global Rubber Recycling Market Size of Top 10 Countries, 2018 VS 2022 VS 2029, (US$ Million)
- Table 9. Global Rubber Recycling Revenue by Players (2018-2023) & (US$ Million)
- Table 10. Global Rubber Recycling Market Share by Players (2018-2023)
- Table 11. Global Top Rubber Recycling Players by Company Type (Tier 1, Tier 2, and Tier 3) & (based on the Revenue in Rubber Recycling as of 2022)
- Table 12. Ranking of Global Top Rubber Recycling Companies by Revenue (US$ Million) in 2022
- Table 13. Global 5 Largest Players Market Share by Rubber Recycling Revenue (CR5 and HHI) & (2018-2023)
- Table 14. Global Key Players of Rubber Recycling, Headquarters and Area Served
- Table 15. Mergers & Acquisitions, Expansion Plans
- Table 16. Global Rubber Recycling Market Size by Type (2018-2023) & (US$ Million)
- Table 17. Global Rubber Recycling Revenue Market Share by Type (2018-2023)
- Table 18. Global Rubber Recycling Forecasted Market Size by Type (2024-2029) & (US$ Million)
- Table 19. Global Rubber Recycling Revenue Market Share by Type (2024-2029)
- Table 20. Global Rubber Recycling Market Size by Application (2018-2023) & (US$ Million)
- Table 21. Global Rubber Recycling Revenue Market Share by Application (2018-2023)
- Table 22. Global Rubber Recycling Forecasted Market Size by Application (2024-2029) & (US$ Million)
- Table 23. Global Rubber Recycling Revenue Market Share by Application (2024-2029)
- Table 24. North America Rubber Recycling Revenue by Company (2021-2023) & (US$ Million)
- Table 25. North America Rubber Recycling Revenue by Type (2018-2023) & (US$ Million)
- Table 26. North America Rubber Recycling Revenue Market Share by Type (2018-2023)
- Table 27. North America Rubber Recycling Revenue by Type (2024-2029) & (US$ Million)
- Table 28. North America Rubber Recycling Revenue Market Share by Type (2024-2029)
- Table 29. North America Rubber Recycling Revenue by Application (2018-2023) & (US$ Million)
- Table 30. North America Rubber Recycling Revenue Market Share by Application (2018-2023)
- Table 31. North America Rubber Recycling Revenue by Application (2024-2029) & (US$ Million)
- Table 32. North America Rubber Recycling Revenue Market Share by Application (2024-2029)
- Table 33. North America Rubber Recycling Revenue Growth Rate (CAGR) by Country (US$ Million): 2018 VS 2022 VS 2029
- Table 34. North America Rubber Recycling Revenue by Country (2018-2023) & (US$ Million)
- Table 35. North America Rubber Recycling Revenue Market Share by Country (2018-2023)
- Table 36. North America Rubber Recycling Revenue by Country (2024-2029) & (US$ Million)
- Table 37. North America Rubber Recycling Revenue Market Share by Country (2024-2029)
- Table 38. Europe Rubber Recycling Revenue by Company (2021-2023) & (US$ Million)
- Table 39. Europe Rubber Recycling Revenue Market Share by Company (2021-2023)
- Table 40. Europe Rubber Recycling Revenue by Type (2018-2023) & (US$ Million)
- Table 41. Europe Rubber Recycling Revenue Market Share by Type (2018-2023)
- Table 42. Europe Rubber Recycling Revenue by Type (2024-2029) & (US$ Million)
- Table 43. Europe Rubber Recycling Revenue Market Share by Type (2024-2029)
- Table 44. Europe Rubber Recycling Revenue by Application (2018-2023) & (US$ Million)
- Table 45. Europe Rubber Recycling Revenue Market Share by Application (2018-2023)
- Table 46. Europe Rubber Recycling Revenue by Application (2024-2029) & (US$ Million)
- Table 47. Europe Rubber Recycling Revenue Market Share by Application (2024-2029)
- Table 48. Europe Rubber Recycling Revenue Growth Rate (CAGR) by Country (US$ Million): 2018 VS 2022 VS 2029
- Table 49. Europe Rubber Recycling Revenue by Country (2018-2023) & (US$ Million)
- Table 50. Europe Rubber Recycling Revenue Market Share by Country (2018-2023)
- Table 51. Europe Rubber Recycling Revenue by Country (2024-2029) & (US$ Million)
- Table 52. Europe Rubber Recycling Revenue Market Share by Country (2024-2029)
- Table 53. Asia Pacific Rubber Recycling Revenue by Company (2021-2023) & (US$ Million)
- Table 54. Asia Pacific Rubber Recycling Revenue Market Share by Company (2021-2023)
- Table 55. Asia Pacific Rubber Recycling Revenue by Type (2018-2023) & (US$ Million)
- Table 56. Asia Pacific Rubber Recycling Revenue Market Share by Type (2018-2023)
- Table 57. Asia Pacific Rubber Recycling Revenue by Type (2024-2029) & (US$ Million)
- Table 58. Asia Pacific Rubber Recycling Revenue Market Share by Type (2024-2029)
- Table 59. Asia Pacific Rubber Recycling Revenue by Application (2018-2023) & (US$ Million)
- Table 60. Asia Pacific Rubber Recycling Revenue Market Share by Application (2018-2023)
- Table 61. Asia Pacific Rubber Recycling Revenue by Application (2024-2029) & (US$ Million)
- Table 62. Asia Pacific Rubber Recycling Revenue Market Share by Application (2024-2029)
- Table 63. Asia Pacific Rubber Recycling Revenue Growth Rate (CAGR) by Country (US$ Million): 2018 VS 2022 VS 2029
- Table 64. Asia Pacific Rubber Recycling Revenue by Country (2018-2023) & (US$ Million)
- Table 65. Asia Pacific Rubber Recycling Revenue Market Share by Country (2018-2023)
- Table 66. Asia Pacific Rubber Recycling Revenue by Country (2024-2029) & (US$ Million)
- Table 67. Asia Pacific Rubber Recycling Revenue Market Share by Country (2024-2029)
- Table 68. Latin America Rubber Recycling Revenue by Company (2021-2023) & (US$ Million)
- Table 69. Latin America Rubber Recycling Revenue Market Share by Company (2021-2023)
- Table 70. Latin America Rubber Recycling Revenue by Type (2018-2023) & (US$ Million)
- Table 71. Latin America Rubber Recycling Revenue Market Share by Type (2018-2023)
- Table 72. Latin America Rubber Recycling Revenue by Type (2024-2029) & (US$ Million)
- Table 73. Latin America Rubber Recycling Revenue Market Share by Type (2024-2029)
- Table 74. Latin America Rubber Recycling Revenue by Application (2018-2023) & (US$ Million)
- Table 75. Latin America Rubber Recycling Revenue Market Share by Application (2018-2023)
- Table 76. Latin America Rubber Recycling Revenue by Application (2024-2029) & (US$ Million)
- Table 77. Latin America Rubber Recycling Revenue Market Share by Application (2024-2029)
- Table 78. Latin America Rubber Recycling Revenue Growth Rate (CAGR) by Country (US$ Million): 2018 VS 2022 VS 2029
- Table 79. Latin America Rubber Recycling Revenue by Country (2018-2023) & (US$ Million)
- Table 80. Latin America Rubber Recycling Revenue Market Share by Country (2018-2023)
- Table 81. Latin America Rubber Recycling Revenue by Country (2024-2029) & (US$ Million)
- Table 82. Latin America Rubber Recycling Revenue Market Share by Country (2024-2029)
- Table 83. Middle East and Africa Rubber Recycling Revenue by Company (2021-2023) & (US$ Million)
- Table 84. Middle East and Africa Rubber Recycling Revenue Market Share by Company (2021-2023)
- Table 85. Middle East and Africa Rubber Recycling Revenue by Type (2018-2023) & (US$ Million)
- Table 86. Middle East and Africa Rubber Recycling Revenue Market Share by Type (2018-2023)
- Table 87. Middle East and Africa Rubber Recycling Revenue by Type (2024-2029) & (US$ Million)
- Table 88. Middle East and Africa Rubber Recycling Revenue Market Share by Type (2024-2029)
- Table 89. Middle East and Africa Rubber Recycling Revenue by Application (2018-2023) & (US$ Million)
- Table 90. Middle East and Africa Rubber Recycling Revenue Market Share by Application (2018-2023)
- Table 91. Middle East and Africa Rubber Recycling Revenue by Application (2024-2029) & (US$ Million)
- Table 92. Middle East and Africa Rubber Recycling Revenue Market Share by Application (2024-2029)
- Table 93. Middle East and Africa Rubber Recycling Revenue Growth Rate (CAGR) by Country (US$ Million): 2018 VS 2022 VS 2029
- Table 94. Middle East and Africa Rubber Recycling Revenue by Country (2018-2023) & (US$ Million)
- Table 95. Middle East and Africa Rubber Recycling Revenue Market Share by Country (2018-2023)
- Table 96. Middle East and Africa Rubber Recycling Revenue by Country (2024-2029) & (US$ Million)
- Table 97. Middle East and Africa Rubber Recycling Revenue Market Share by Country (2024-2029)
- Table 98. Liberty Tire Services Company Details
- Table 99. Liberty Tire Services Rubber Recycling Products and Services
- Table 100. Liberty Tire Services Revenue in Rubber Recycling Business (2018-2023) & (US$ Million)
- Table 101. Liberty Tire Services Recent Development
- Table 102. Genan Company Details
- Table 103. Genan Rubber Recycling Products and Services
- Table 104. Genan Revenue in Rubber Recycling Business (2018-2023) & (US$ Million)
- Table 105. Genan Recent Development
- Table 106. Nantong Huili Rubber Company Details
- Table 107. Nantong Huili Rubber Rubber Recycling Products and Services
- Table 108. Nantong Huili Rubber Revenue in Rubber Recycling Business (2018-2023) & (US$ Million)
- Table 109. Nantong Huili Rubber Recent Development
- Table 110. CRM Rubber Company Details
- Table 111. CRM Rubber Rubber Recycling Products and Services
- Table 112. CRM Rubber Revenue in Rubber Recycling Business (2018-2023) & (US$ Million)
- Table 113. Emanuel Tire Company Details
- Table 114. Emanuel Tire Rubber Recycling Products and Services
- Table 115. Emanuel Tire Revenue in Rubber Recycling Business (2018-2023) & (US$ Million)
- Table 116. Scandinavian Enviro Company Details
- Table 117. Scandinavian Enviro Rubber Recycling Products and Services
- Table 118. Scandinavian Enviro Revenue in Rubber Recycling Business (2018-2023) & (US$ Million)
- Table 119. Scandinavian Enviro Recent Development
- Table 120. Tyrecycle Company Details
- Table 121. Tyrecycle Rubber Recycling Products and Services
- Table 122. Tyrecycle Revenue in Rubber Recycling Business (2018-2023) & (US$ Million)
- Table 123. Murfitts Company Details
- Table 124. Murfitts Rubber Recycling Products and Services
- Table 125. Murfitts Revenue in Rubber Recycling Business (2018-2023) & (US$ Million)
- Table 126. Murfitts Recent Development
- Table 127. Jinan Laiwu Fuquan Rubber Company Details
- Table 128. Jinan Laiwu Fuquan Rubber Rubber Recycling Products and Services
- Table 129. Jinan Laiwu Fuquan Rubber Revenue in Rubber Recycling Business (2018-2023) & (US$ Million)
- Table 130. Tire Disposal & Recycling Company Details
- Table 131. Tire Disposal & Recycling Rubber Recycling Products and Services
- Table 132. Tire Disposal & Recycling Revenue in Rubber Recycling Business (2018-2023) & (US$ Million)
- Table 133. Entech Company Details
- Table 134. Entech Rubber Recycling Products and Services
- Table 135. Entech Revenue in Rubber Recycling Business (2018-2023) & (US$ Million)
- Table 136. L&S Tire Company Details
- Table 137. L&S Tire Rubber Recycling Products and Services
- Table 138. L&S Tire Revenue in Rubber Recycling Business (2018-2023) & (US$ Million)
- Table 139. Manhantango Enterprises Company Details
- Table 140. Manhantango Enterprises Rubber Recycling Products and Services
- Table 141. Manhantango Enterprises Revenue in Rubber Recycling Business (2018-2023) & (US$ Million)
- Table 142. Pyrum Innovations Company Details
- Table 143. Pyrum Innovations Rubber Recycling Products and Services
- Table 144. Pyrum Innovations Revenue in Rubber Recycling Business (2018-2023) & (US$ Million)
- Table 145. Pyrum Innovations Recent Development
- Table 146. Kokubu Shokai Company Details
- Table 147. Kokubu Shokai Rubber Recycling Products and Services
- Table 148. Kokubu Shokai Revenue in Rubber Recycling Business (2018-2023) & (US$ Million)
- Table 149. ZC Rubber Company Details
- Table 150. ZC Rubber Rubber Recycling Products and Services
- Table 151. ZC Rubber Revenue in Rubber Recycling Business (2018-2023) & (US$ Million)
- Table 152. Beijing New Universal Science and Technology Company Details
- Table 153. Beijing New Universal Science and Technology Rubber Recycling Products and Services
- Table 154. Beijing New Universal Science and Technology Revenue in Rubber Recycling Business (2018-2023) & (US$ Million)
- Table 155. ZC Rubber Company Details
- Table 156. EPSCO Rubber Recycling Products and Services
- Table 157. EPSCO Revenue in Rubber Recycling Business (2018-2023) & (US$ Million)
- Table 158. Tyrec Company Details
- Table 159. Tyrec Rubber Recycling Products and Services
- Table 160. Tyrec Revenue in Rubber Recycling Business (2018-2023) & (US$ Million)
- Table 161. AKO Group Company Details
- Table 162. AKO Group Rubber Recycling Products and Services
- Table 163. AKO Group Revenue in Rubber Recycling Business (2018-2023) & (US$ Million)
- Table 164. Carbones del Cerrejon Company Details
- Table 165. Carbones del Cerrejon Rubber Recycling Products and Services
- Table 166. Carbones del Cerrejon Revenue in Rubber Recycling Business (2018-2023) & (US$ Million)
- Table 167. Rubber Recycling Market Trends
- Table 168. Rubber Recycling Market Drivers
- Table 169. Rubber Recycling Market Challenges
- Table 170. Research Programs/Design for This Report
- Table 171. Key Data Information from Secondary Sources
- Table 172. Key Data Information from Primary Sources
- Table 173. QYR Business Unit and Senior & Team Lead Analysts
List of Figures
- Figure 1. Rubber Recycling Product Picture
- Figure 2. Global Rubber Recycling Market Share by Type: 2022 VS 2029
- Figure 3. Tire-Derived Fuel Features
- Figure 4. Tire Derived Product Features
- Figure 5. Global Rubber Recycling Market Share by Application: 2022 VS 2029
- Figure 6. Rubber Recycling Report Years Considered
- Figure 7. Global Rubber Recycling Revenue, (US$ Billion), 2018 VS 2023 VS 2029
- Figure 8. Global Rubber Recycling Market Size 2018-2029 (US$ Million)
- Figure 9. Global Rubber Recycling Market Size Market Share by Region: 2022 VS 2029
- Figure 10. Global Rubber Recycling Revenue Market Share by Region in 2018 VS 2023
- Figure 11. Global Top Rubber Recycling Players by Company Type (Tier 1, Tier 2, and Tier 3) & (based on the Revenue in Rubber Recycling as of 2022)
- Figure 12. The Top 10 and 5 Players Market Share by Rubber Recycling Revenue in 2022
- Figure 13. North America Rubber Recycling Revenue Market Share by Company (2021-2023)
- Figure 14. United States Rubber Recycling Revenue (2018-2029) & (US$ Million)
- Figure 15. Canada Rubber Recycling Revenue (2018-2029) & (US$ Million)
- Figure 16. Germany Rubber Recycling Revenue (2018-2029) & (US$ Million)
- Figure 17. France Rubber Recycling Revenue (2018-2029) & (US$ Million)
- Figure 18. U.K. Rubber Recycling Revenue (2018-2029) & (US$ Million)
- Figure 19. Italy Rubber Recycling Revenue (2018-2029) & (US$ Million)
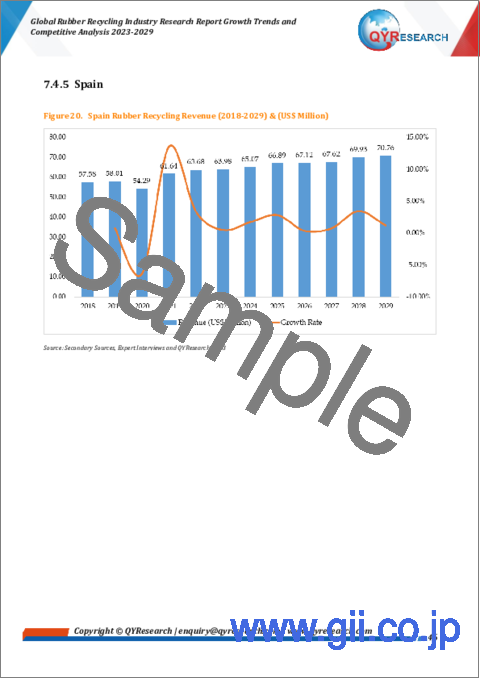
- Figure 20. Spain Rubber Recycling Revenue (2018-2029) & (US$ Million)
- Figure 21. Russia Rubber Recycling Revenue (2018-2029) & (US$ Million)
- Figure 22. China Rubber Recycling Revenue (2018-2029) & (US$ Million)
- Figure 23. Japan Rubber Recycling Revenue (2018-2029) & (US$ Million)
- Figure 24. South Korea Rubber Recycling Revenue (2018-2029) & (US$ Million)
- Figure 25. Australia Rubber Recycling Revenue (2018-2029) & (US$ Million)
- Figure 26. Southeast Asia Rubber Recycling Revenue (2018-2029) & (US$ Million)
- Figure 27. India Rubber Recycling Revenue (2018-2029) & (US$ Million)
- Figure 28. Brazil Rubber Recycling Revenue (2018-2029) & (US$ Million)
- Figure 29. Mexico Rubber Recycling Revenue (2018-2029) & (US$ Million)
- Figure 30. Africa Rubber Recycling Revenue (2018-2029) & (US$ Million)
- Figure 31. Turkey Rubber Recycling Revenue (2018-2029) & (US$ Million)
- Figure 32. Israel Rubber Recycling Revenue (2018-2029) & (US$ Million)
- Figure 33. Liberty Tire Services Revenue Growth Rate in Rubber Recycling Business (2018-2023)
- Figure 34. Genan Revenue Growth Rate in Rubber Recycling Business (2018-2023)
- Figure 35. Nantong Huili Rubber Revenue Growth Rate in Rubber Recycling Business (2018-2023)
- Figure 36. CRM Rubber Revenue Growth Rate in Rubber Recycling Business (2018-2023)
- Figure 37. Emanuel Tire Revenue Growth Rate in Rubber Recycling Business (2018-2023)
- Figure 38. Scandinavian Enviro Revenue Growth Rate in Rubber Recycling Business (2018-2023)
- Figure 39. Tyrecycle Revenue Growth Rate in Rubber Recycling Business (2018-2023)
- Figure 40. Murfitts Revenue Growth Rate in Rubber Recycling Business (2018-2023)
- Figure 41. Jinan Laiwu Fuquan Rubber Revenue Growth Rate in Rubber Recycling Business (2018-2023)
- Figure 42. Tire Disposal & Recycling Revenue Growth Rate in Rubber Recycling Business (2018-2023)
- Figure 43. Entech Revenue Growth Rate in Rubber Recycling Business (2018-2023)
- Figure 44. L&S Tire Revenue Growth Rate in Rubber Recycling Business (2018-2023)
- Figure 45. Manhantango Enterprises Revenue Growth Rate in Rubber Recycling Business (2018-2023)
- Figure 46. Pyrum Innovations Revenue Growth Rate in Rubber Recycling Business (2018-2023)
- Figure 47. Kokubu Shokai Revenue Growth Rate in Rubber Recycling Business (2018-2023)
- Figure 48. ZC Rubber Revenue Growth Rate in Rubber Recycling Business (2018-2023)
- Figure 49. Beijing New Universal Science and Technology Revenue Growth Rate in Rubber Recycling Business (2018-2023)
- Figure 50. EPSCO Revenue Growth Rate in Rubber Recycling Business (2018-2023)
- Figure 51. Tyrec Revenue Growth Rate in Rubber Recycling Business (2018-2023)
- Figure 52. AKO Group Revenue Growth Rate in Rubber Recycling Business (2018-2023)
- Figure 53. Carbones del Cerrejon Revenue Growth Rate in Rubber Recycling Business (2018-2023)
- Figure 54. Bottom-up and Top-down Approaches for This Report
- Figure 55. Data Triangulation
- Figure 56. Key Executives Interviewed
Due to the COVID-19 pandemic, the global Rubber Recycling market size was US$ 3.89 billion in 2022 and is forecast to a readjusted size of US$ 4.71 billion by 2029 with a CAGR of 2.84% during the forecast period 2023-2029. Fully considering the economic change by this health crisis, Tire-Derived Product accounting for 82.77% of the Rubber Recycling global market in 2022, is projected to value US$ 3.93 billion by 2029, growing at a revised 2.91% CAGR from 2023 to 2029. While Alternative Fuel for Manufacturing segment is altered to 2.47% CAGR throughout this forecast period.
The global key companies of Rubber Recycling include Liberty Tire Services, Genan, Nantong Huili Rubber, CRM Rubber Emanuel Tire, etc. In 2022, the global top five players hold a share approximately 9.86% in terms of revenue.
The market research report offered here is a very useful resource that can help manufacturers, stakeholders, decision-makers, and other market participants to become familiar with every factor impacting the growth of the global Rubber Recycling market. The analysts authoring the report have closely studied key strategies adopted by top players of the global Rubber Recycling market. Readers of the report can become informed about current and future trends of the global Rubber Recycling market and how they will impact market growth during the forecast period.
By Company
- Liberty Tire Services
- Genan
- Nantong Huili Rubber Co., Ltd
- CRM Rubber
- Emanuel Tire
- Scandinavian Enviro
- Tyrecycle
- Murfitts
- Jinan Laiwu Fuquan Rubber
- Tire Disposal & Recycling
- Entech
- L&S Tire
- Manhantango Enterprises
- Pyrum Innovations
- Kokubu Shokai
- ZC Rubber
- Beijing New Universal Science and Technology
- EPSCO Global General Trading recycling company
- Tyrec
- AKO Group
- Carbones del Cerrejon Ltd.
Segment by Type
- Tire-Derived Fuel
- Tire Derived Product
Segment by Application
- Alternative Fuel for Manufacturing
- Construction and Civil Engineering
- Consumer Goods
- Sport and Leisure
- Others
By Region
- North America
- United States
- Canada
- Asia-Pacific
- China
- Japan
- South Korea
- India
- Australia
- Southeast Asia
- Europe
- Germany
- France
- U.K.
- Italy
- Russia
- Spain
- Latin America
- Mexico
- Brazil
- Middle East & Africa
- Africa
- Turkey
- Israel
Chapter Outline
Chapter 1: Introduces the report scope of the report, executive summary of different market segments (product type, application, etc), including the market size of each market segment, future development potential, and so on.
Chapter 2: Revenue of Rubber Recycling in global and regional level.
Chapter 3: Detailed analysis of Rubber Recycling companies competitive landscape, revenue, market share and industry ranking, latest development plan, merger, and acquisition information, etc.
Chapter 4: Provides the analysis of various market segments by Type, covering the revenue, and development potential of each market segment, to help readers find the blue ocean market in different market segments.
Chapter 5: Provides the analysis of various market segments by Application, covering the revenue, and development potential of each market segment, to help readers find the blue ocean market in different downstream markets.
Chapter 6: North America (US & Canada) by Type, by Application and by country, revenue for each segment.
Chapter 7: Europe by Type, by Application and by country, revenue for each segment.
Chapter 8: Asia Pacific by Type, by Application and by region, revenue for each segment.
Chapter 9: Latin America by Type, by Application and by country, revenue for each segment.
Chapter 10: Middle East and Africa, by Type, by Application and by country, revenue for each segment.
Chapter 11: Provides profiles of key companies, introducing the basic situation of the main companies in the market in detail, including product descriptions and specifications, Rubber Recycling revenue, gross margin, and recent development, etc.
Chapter 12: Introduces the market dynamics, latest developments of the market, the driving factors and restrictive factors of the market, the challenges and risks faced by manufacturers in the industry, and the analysis of relevant policies in the industry.
Chapter 13: Research Findings and Conclusion
Table of Contents
1 Report Overview
- 1.1 Study Scope
- 1.2 Market Analysis by Type
- 1.2.1 Global Rubber Recycling Market Size Growth Rate by Type: 2018 VS 2022 VS 2029
- 1.2.2 Tire-Derived Fuel
- 1.2.3 Tire Derived Product
- 1.3 Market by Application
- 1.3.1 Global Rubber Recycling Market Growth by Application: 2018 VS 2022 VS 2029
- 1.3.2 Alternative Fuel for Manufacturing
- 1.3.3 Construction and Civil Engineering
- 1.3.4 Consumer Goods
- 1.3.5 Sport and Leisure
- 1.3.6 Others
- 1.4 Assumptions and Limitations
- 1.5 Study Objectives
- 1.6 Years Considered
2 Market Perspective
- 2.1 Global Rubber Recycling Market Size 2018-2029
- 2.2 Rubber Recycling Market Size across Key Geographies Worldwide: 2018 VS 2022 VS 2029
- 2.3 Global Rubber Recycling Market Size by Region (2018-2023)
- 2.4 Global Rubber Recycling Market Size Forecast by Region (2024-2029)
- 2.5 Global Top 10 Rubber Recycling Countries Ranking by Market Size
3 Rubber Recycling Competition by Company
- 3.1 Global Rubber Recycling Revenue by Players
- 3.1.1 Global Rubber Recycling Revenue by Players (2018-2023)
- 3.1.2 Global Rubber Recycling Market Share by Players (2018-2023)
- 3.2 Global Rubber Recycling Market Share by Company Type (Tier 1, Tier 2, and Tier 3)
- 3.3 Company Covered: Ranking by Rubber Recycling Revenue
- 3.4 Global Rubber Recycling Market Concentration Ratio
- 3.4.1 Global Rubber Recycling Market Concentration Ratio (CR5 and HHI)
- 3.4.2 Global Top 10 and Top 5 Companies by Rubber Recycling Revenue in 2022
- 3.5 Global Key Players of Rubber Recycling Head office and Area Served
- 3.6 Mergers & Acquisitions, Expansion Plans
4 Global Rubber Recycling Breakdown Data by Type
- 4.1 Global Rubber Recycling Historic Market Size by Type (2018-2023)
- 4.2 Global Rubber Recycling Forecasted Market Size by Type (2024-2029)
5 Global Rubber Recycling Breakdown Data by Application
- 5.1 Global Rubber Recycling Historic Market Size by Application (2018-2023)
- 5.2 Global Rubber Recycling Forecasted Market Size by Application (2024-2029)
6 North America
- 6.1 North America Rubber Recycling Revenue by Company (2021-2023)
- 6.2 North America Rubber Recycling Revenue by Type (2018-2029)
- 6.3 North America Rubber Recycling Revenue by Application (2018-2029)
- 6.4 North America Rubber Recycling Revenue by Country (2018-2029)
- 6.4.1 United States
- 6.4.2 Canada
7 Europe
- 7.1 Europe Rubber Recycling Revenue by Company (2021-2023)
- 7.2 Europe Rubber Recycling Revenue by Type (2018-2029)
- 7.3 Europe Rubber Recycling Revenue by Application (2018-2029)
- 7.4 Europe Rubber Recycling Revenue by Country (2018-2029)
- 7.4.1 Germany
- 7.4.2 France
- 7.4.3 U.K.
- 7.4.4 Italy
- 7.4.5 Spain
- 7.4.6 Russia
8 Asia Pacific
- 8.1 Asia Pacific Rubber Recycling Revenue by Company (2021-2023)
- 8.2 Asia Pacific Rubber Recycling Revenue by Type (2018-2029)
- 8.3 Asia Pacific Rubber Recycling Revenue by Application (2018-2029)
- 8.4 Asia Pacific Rubber Recycling Revenue by Country (2018-2029)
- 8.4.1 China
- 8.4.2 Japan
- 8.4.3 South Korea
- 8.4.4 Australia
- 8.4.5 Southeast Asia
- 8.4.6 India
9 Latin America
- 9.1 Latin America Rubber Recycling Revenue by Company (2021-2023)
- 9.2 Latin America Rubber Recycling Revenue by Type (2018-2029)
- 9.3 Latin America Rubber Recycling Revenue by Application (2018-2029)
- 9.4 Latin America Rubber Recycling Revenue by Country (2018-2029)
- 9.4.1 Brazil
- 9.4.2 Mexico
10 Middle East and Africa
- 10.1 Middle East and Africa Rubber Recycling Revenue by Company (2021-2023)
- 10.2 Middle East and Africa Rubber Recycling Revenue by Type (2018-2029)
- 10.3 Middle East and Africa Rubber Recycling Revenue by Application (2018-2029)
- 10.4 Middle East and Africa Rubber Recycling Revenue by Country (2018-2029)
- 10.4.1 Africa
- 10.4.2 Turkey
- 10.4.3 Israel
11 Company Profiles
- 11.1 Liberty Tire Services
- 11.1.1 Liberty Tire Services Company Details
- 11.1.2 Liberty Tire Services Business Overview
- 11.1.3 Liberty Tire Services Rubber Recycling Products and Servicess and Services
- 11.1.4 Liberty Tire Services Revenue in Rubber Recycling Business (2018-2023)
- 11.1.5 Liberty Tire Services Recent Development
- 11.2 Genan
- 11.2.1 Genan Company Details
- 11.2.2 Genan Business Overview
- 11.2.3 Genan Rubber Recycling Products and Servicess and Services
- 11.2.4 Genan Revenue in Rubber Recycling Business (2018-2023)
- 11.2.5 Genan Recent Development
- 11.3 Nantong Huili Rubber Co., Ltd
- 11.3.1 Nantong Huili Rubber Company Details
- 11.3.2 Nantong Huili Rubber Business Overview
- 11.3.3 Nantong Huili Rubber Rubber Recycling Products and Servicess and Services
- 11.3.4 Nantong Huili Rubber Revenue in Rubber Recycling Business (2018-2023)
- 11.3.5 Nantong Huili Rubber Recent Development
- 11.4 CRM Rubber
- 11.4.1 CRM Rubber Company Details
- 11.4.2 CRM Rubber Business Overview
- 11.4.3 CRM Rubber Rubber Recycling Products and Servicess and Services
- 11.4.4 CRM Rubber Revenue in Rubber Recycling Business (2018-2023)
- 11.5 Emanuel Tire
- 11.5.1 Emanuel Tire Company Details
- 11.5.2 Emanuel Tire Business Overview
- 11.5.3 Emanuel Tire Rubber Recycling Products and Servicess and Services
- 11.5.4 Emanuel Tire Revenue in Rubber Recycling Business (2018-2023)
- 11.6 Scandinavian Enviro
- 11.6.1 Scandinavian Enviro Company Details
- 11.6.2 Scandinavian Enviro Business Overview
- 11.6.3 Scandinavian Enviro Rubber Recycling Products and Servicess and Services
- 11.6.4 Scandinavian Enviro Revenue in Rubber Recycling Business (2018-2023)
- 11.6.5 Scandinavian Enviro Recent Development
- 11.7 Tyrecycle
- 11.7.1 Tyrecycle Company Details
- 11.7.2 Tyrecycle Business Overview
- 11.7.3 Tyrecycle Rubber Recycling Products and Servicess and Services
- 11.7.4 Tyrecycle Revenue in Rubber Recycling Business (2018-2023)
- 11.8 Murfitts
- 11.8.1 Murfitts Company Details
- 11.8.2 Murfitts Business Overview
- 11.8.3 Murfitts Rubber Recycling Products and Servicess and Services
- 11.8.4 Murfitts Revenue in Rubber Recycling Business (2018-2023)
- 11.8.5 Murfitts Recent Development
- 11.9 Jinan Laiwu Fuquan Rubber
- 11.9.1 Jinan Laiwu Fuquan Rubber Company Details
- 11.9.2 Jinan Laiwu Fuquan Rubber Business Overview
- 11.9.3 Jinan Laiwu Fuquan Rubber Rubber Recycling Products and Servicess and Services
- 11.9.4 Jinan Laiwu Fuquan Rubber Revenue in Rubber Recycling Business (2018-2023)
- 11.10 Tire Disposal & Recycling
- 11.10.1 Tire Disposal & Recycling Company Details
- 11.10.2 Tire Disposal & Recycling Business Overview
- 11.10.3 Tire Disposal & Recycling Rubber Recycling Products and Servicess and Services
- 11.10.4 Tire Disposal & Recycling Revenue in Rubber Recycling Business (2018-2023)
- 11.11 Entech
- 11.11.1 Entech Company Details
- 11.11.2 Entech Business Overview
- 11.11.3 Entech Rubber Recycling Products and Servicess and Services
- 11.11.4 Entech Revenue in Rubber Recycling Business (2018-2023)
- 11.12 L&S Tire
- 11.12.1 L&S Tire Company Details
- 11.12.2 L&S Tire Business Overview
- 11.12.3 L&S Tire Rubber Recycling Products and Servicess and Services
- 11.12.4 L&S Tire Revenue in Rubber Recycling Business (2018-2023)
- 11.13 Manhantango Enterprises
- 11.13.1 Manhantango Enterprises Company Details
- 11.13.2 Manhantango Enterprises Business Overview
- 11.13.3 Manhantango Enterprises Rubber Recycling Products and Servicess and Services
- 11.13.4 Manhantango Enterprises Revenue in Rubber Recycling Business (2018-2023)
- 11.14 Pyrum Innovations
- 11.14.1 Pyrum Innovations Company Details
- 11.14.2 Pyrum Innovations Business Overview
- 11.14.3 Pyrum Innovations Rubber Recycling Products and Servicess and Services
- 11.14.4 Pyrum Innovations Revenue in Rubber Recycling Business (2018-2023)
- 11.14.5 Pyrum Innovations Recent Development
- 11.15 Kokubu Shokai
- 11.15.1 Kokubu Shokai Company Details
- 11.15.2 Kokubu Shokai Business Overview
- 11.15.3 Kokubu Shokai Rubber Recycling Products and Servicess and Services
- 11.15.4 Kokubu Shokai Revenue in Rubber Recycling Business (2018-2023)
- 11.16 ZC Rubber
- 11.16.1 ZC Rubber Company Details
- 11.16.2 ZC Rubber Business Overview
- 11.16.3 ZC Rubber Rubber Recycling Products and Servicess and Services
- 11.16.4 ZC Rubber Revenue in Rubber Recycling Business (2018-2023)
- 11.17 Beijing New Universal Science and Technology Co., Ltd.
- 11.17.1 Beijing New Universal Science and Technology Company Details
- 11.17.2 Beijing New Universal Science and Technology Business Overview
- 11.17.3 Beijing New Universal Science and Technology Rubber Recycling Products and Servicess and Services
- 11.17.4 Beijing New Universal Science and Technology Revenue in Rubber Recycling Business (2018-2023)
- 11.18 EPSCO Global General Trading recycling company
- 11.18.1 ZC Rubber Company Details
- 11.18.2 EPSCO Business Overview
- 11.18.3 EPSCO Rubber Recycling Products and Servicess and Services
- 11.18.4 EPSCO Revenue in Rubber Recycling Business (2018-2023)
- 11.19 Tyrec
- 11.19.1 Tyrec Company Details
- 11.19.2 Tyrec Business Overview
- 11.19.3 Tyrec Rubber Recycling Products and Servicess and Services
- 11.19.4 Tyrec Revenue in Rubber Recycling Business (2018-2023)
- 11.20 AKO Group
- 11.20.1 AKO Group Company Details
- 11.20.2 AKO Group Business Overview
- 11.20.3 AKO Group Rubber Recycling Products and Servicess and Services
- 11.20.4 AKO Group Revenue in Rubber Recycling Business (2018-2023)
- 11.21 Carbones del Cerrejon
- 11.21.1 Carbones del Cerrejon Company Details
- 11.21.2 Carbones del Cerrejon Business Overview
- 11.21.3 Carbones del Cerrejon Rubber Recycling Products and Servicess and Services
- 11.21.4 Carbones del Cerrejon Revenue in Rubber Recycling Business (2018-2023)
12 Rubber Recycling Market Dynamics
- 12.1 Rubber Recycling Industry Trends
- 12.2 Rubber Recycling Market Drivers
- 12.3 Rubber Recycling Market Challenges
13 Research Findings and Conclusion
14 Appendix
- 14.1 Research Methodology
- 14.1.1 Methodology/Research Approach
- 14.1.2 Data Source
- 14.2 Author Details
- 14.3 Disclaimer