|
|
市場調査レポート
商品コード
1249421
有刺縫合糸の世界市場(2022年)Global Barbed Sutures Market Research Report 2022 |
||||||
|
|
|||||||
|
● お客様のご希望に応じて、既存データの加工や未掲載情報(例:国別セグメント)の追加などの対応が可能です。 詳細はお問い合わせください。 |
|||||||


| 有刺縫合糸の世界市場(2022年) |
|
出版日: 2023年03月29日
発行: QYResearch
ページ情報: 英文 125 Pages
納期: 2~3営業日
|
- 全表示
- 概要
- 図表
- 目次
世界の有刺縫合糸の市場規模は、2023年の6億2,226万米ドルから2029年までに10億8,076万米ドルに達し、2023年~2029年にCAGRで9.64%の成長が予測されています。
当レポートでは、世界の有刺縫合糸市場について調査分析し、市場規模と予測、地域とセグメントの分析、企業プロファイルなどを提供しています。
目次
第1章 有刺縫合糸市場の概要
- 製品の定義
- 有刺縫合糸:タイプ別
- 世界の有刺縫合糸の市場金額の比較:タイプ別(2023年~2029年)
- 一方向のとげ
- 双方向のとげ
- 有刺縫合糸:用途別
- 世界の有刺縫合糸の市場金額:用途別(2023年~2029年)
- 一般外科
- 整形外科
- 婦人科・産科
- 泌尿器科
- 形成外科
- 腫瘍
- 心臓胸部外科
- 小児外科
- 眼科
- その他
- 世界の有刺縫合糸の市場規模の推計と予測
- 世界の有刺縫合糸の収益(2018年~2029年)
- 世界の有刺縫合糸の売上(2018年~2029年)
- 世界の有刺縫合糸市場の平均価格(2018年~2029年)
- 前提条件と制限
第2章 有刺縫合糸市場の競合:メーカー別
- 世界の有刺縫合糸の売上の市場シェア:メーカー別(2018年~2023年)
- 世界の有刺縫合糸の収益の市場シェア:メーカー別(2018年~2023年)
- 世界の有刺縫合糸の平均価格:メーカー別(2018年~2023年)
- 世界の有刺縫合糸の主要企業、業界ランキング(2021年・2022年・2023年)
- 世界の有刺縫合糸の主要メーカー、製造拠点、本社
- 世界の有刺縫合糸の主要メーカー、製品タイプ、用途
- 世界の有刺縫合糸の主要メーカー、業界参入日
- 世界の有刺縫合糸市場の競合情勢と動向
- メーカーの合併と買収、拡張計画
第3章 世界の有刺縫合糸市場シナリオ:地域別
- 世界の有刺縫合糸の市場規模:地域別(2018年・2023年・2029年)
- 世界の有刺縫合糸の売上:地域別(2018年~2029年)
- 世界の有刺縫合糸の収益:地域別(2018年~2029年)
- 北米の有刺縫合糸市場の事実と数字:国別
- 北米の有刺縫合糸の市場規模:国別(2018年・2023年・2029年)
- 北米の有刺縫合糸の売上:国別(2018年~2029年)
- 北米の有刺縫合糸の収益:国別(2018年~2029年)
- 米国
- カナダ
- 欧州の有刺縫合糸市場の事実と数字:国別
- 欧州の有刺縫合糸の市場規模:国別(2018年・2023年・2029年)
- 欧州の有刺縫合糸の売上:国別(2018年~2029年)
- 欧州の有刺縫合糸の収益:国別(2018年~2029年)
- ドイツ
- フランス
- 英国
- イタリア
- ロシア
- アジア太平洋の有刺縫合糸市場の事実と数字:地域別
- アジア太平洋の有刺縫合糸の市場規模:地域別(2018年・2023年・2029年)
- アジア太平洋の有刺縫合糸の売上:地域別(2018年~2029年)
- アジア太平洋の有刺縫合糸の収益:地域別(2018年~2029年)
- 中国
- 日本
- 韓国
- 東南アジア
- インド
- オーストラリア
- ラテンアメリカの有刺縫合糸市場の事実と数字:国別
- ラテンアメリカの有刺縫合糸の市場規模:国別(2018年・2023年・2029年)
- ラテンアメリカの有刺縫合糸の売上:国別(2018年~2029年)
- ラテンアメリカの有刺縫合糸の収益:国別
- メキシコ
- ブラジル
- 中東・アフリカの有刺縫合糸市場の事実と数字:国別
- 中東・アフリカの有刺縫合糸の市場規模:国別(2018年・2023年・2029年)
- 中東・アフリカの有刺縫合糸の売上:国別(2018年~2029年)
- 中東・アフリカの有刺縫合糸の収益:国別
- サウジアラビア
- アラブ首長国連邦
- エジプト
- 南アフリカ
第4章 セグメント:タイプ別
- 世界の有刺縫合糸の売上:タイプ別(2018年~2029年)
- 世界の有刺縫合糸の収益:タイプ別(2018年~2029年)
- 世界の有刺縫合糸の価格:タイプ別(2018年~2029年)
第5章 セグメント:用途別
- 世界の有刺縫合糸の売上:用途別(2018年~2029年)
- 世界の有刺縫合糸の収益:用途別(2018年~2029年)
- 世界の有刺縫合糸の価格:用途別(2018年~2029年)
第6章 主要企業の紹介
- Corza Medical
- Johnson & Johnson
- Medtronic
- RESORBA Medical GmbH
- META BIOMED
- SERAG-WIESSNER
- Futura Surgicare
- Cortis
- Weigao Group
第7章 業界チェーンと販売チャネルの分析
- 有刺縫合糸の業界チェーン分析
- 有刺縫合糸の主な原材料
- 有刺縫合糸の生産モードとプロセス
- 有刺縫合糸の販売とマーケティング
- 有刺縫合糸の顧客
第8章 有刺縫合糸の市場力学
- 有刺縫合糸業界の動向
- 有刺縫合糸市場の促進要因
- 有刺縫合糸市場の課題
- 有刺縫合糸市場の抑制要因
第9章 調査結果と結論
第10章 調査手法とデータソース
List of Tables
- Table 1. Global Barbed Sutures Market Value Comparison by Type (2023-2029) & (US$ Million)
- Table 2. Global Barbed Sutures Market Value by Application (2023-2029) & (US$ Million)
- Table 3. Global Barbed Sutures Market Competitive Situation by Manufacturers in 2022
- Table 4. Global Barbed Sutures Sales (k Pcs) of Key Manufacturers (2018-2023)
- Table 5. Global Barbed Sutures Sales Market Share by Manufacturers (2018-2023)
- Table 6. Global Barbed Sutures Revenue (US$ Million) by Manufacturers (2018-2023)
- Table 7. Global Barbed Sutures Revenue Share by Manufacturers (2018-2023)
- Table 8. Global Market Barbed Sutures Average Price (US$/Pcs) of Key Manufacturers (2018-2023)
- Table 9. Global Key Players of Barbed Sutures, Industry Ranking, 2021 VS 2022 VS 2023
- Table 10. Global Key Manufacturers of Barbed Sutures, Manufacturing Sites & Headquarters
- Table 11. Global Key Manufacturers of Barbed Sutures, Product Type & Application
- Table 12. Global Key Manufacturers of Barbed Sutures, Date of Enter into This Industry
- Table 13. Global Manufacturers Market Concentration Ratio (CR5 and HHI)
- Table 14. Global Barbed Sutures by Company Type (Tier 1, Tier 2, and Tier 3) & (based on the Revenue in Barbed Sutures as of 2022)
- Table 15. Manufacturers Mergers & Acquisitions, Expansion Plans
- Table 16. Global Barbed Sutures Market Size by Region (US$ Million): 2018 VS 2023 VS 2029
- Table 17. Global Barbed Sutures Sales by Region (2018-2023) & (k Pcs)
- Table 18. Global Barbed Sutures Sales Market Share by Region (2018-2023)
- Table 19. Global Barbed Sutures Sales by Region (2024-2029) & (k Pcs)
- Table 20. Global Barbed Sutures Sales Market Share by Region (2024-2029)
- Table 21. Global Barbed Sutures Revenue by Region (2018-2023) & (US$ Million)
- Table 22. Global Barbed Sutures Revenue Market Share by Region (2018-2023)
- Table 23. Global Barbed Sutures Revenue by Region (2024-2029) & (US$ Million)
- Table 24. Global Barbed Sutures Revenue Market Share by Region (2024-2029)
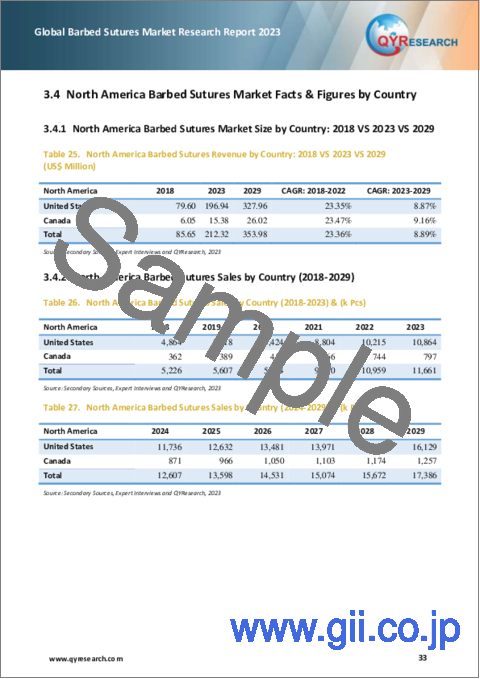
- Table 25. North America Barbed Sutures Revenue by Country: 2018 VS 2023 VS 2029 (US$ Million)
- Table 26. North America Barbed Sutures Sales by Country (2018-2023) & (k Pcs)
- Table 27. North America Barbed Sutures Sales by Country (2024-2029) & (k Pcs)
- Table 28. North America Barbed Sutures Revenue by Country (2018-2023) & (US$ Million)
- Table 29. North America Barbed Sutures Revenue by Country (2024-2029) & (US$ Million)
- Table 30. Europe Barbed Sutures Revenue by Country: 2018 VS 2023 VS 2029 (US$ Million)
- Table 31. Europe Barbed Sutures Sales by Country (2018-2023) & (k Pcs)
- Table 32. Europe Barbed Sutures Sales by Country (2024-2029) & (k Pcs)
- Table 33. Europe Barbed Sutures Revenue by Country (2018-2023) & (US$ Million)
- Table 34. Europe Barbed Sutures Revenue by Country (2024-2029) & (US$ Million)
- Table 35. Asia Pacific Barbed Sutures Revenue by Region: 2018 VS 2023 VS 2029 (US$ Million)
- Table 36. Asia Pacific Barbed Sutures Sales by Region (2018-2023) & (k Pcs)
- Table 37. Asia Pacific Barbed Sutures Sales by Region (2024-2029) & (k Pcs)
- Table 38. Asia Pacific Barbed Sutures Revenue by Region (2018-2023) & (US$ Million)
- Table 39. Asia Pacific Barbed Sutures Revenue by Region (2024-2029) & (US$ Million)
- Table 40. Latin America Barbed Sutures Revenue by Country: 2018 VS 2023 VS 2029 (US$ Million)
- Table 41. Latin America Barbed Sutures Sales by Country (2018-2023) & (k Pcs)
- Table 42. Latin America Barbed Sutures Sales by Country (2024-2029) & (k Pcs)
- Table 43. Latin America Barbed Sutures Revenue by Country (2018-2023) & (US$ Million)
- Table 44. Latin America Barbed Sutures Revenue Market Share by Country (2018-2023)
- Table 45. Middle East and Africa Barbed Sutures Revenue by Country: 2018 VS 2023 VS 2029 (US$ Million)
- Table 46. Middle East and Africa Barbed Sutures Sales by Country (2018-2023) & (k Pcs)
- Table 47. Middle East and Africa Barbed Sutures Sales by Country (2024-2029) & (k Pcs)
- Table 48. Middle East and Africa Barbed Sutures Revenue by Country (2018-2023) & (US$ Million)
- Table 49. Middle East and Africa Barbed Sutures Revenue by Country (2024-2029) & (US$ Million)
- Table 50. Global Barbed Sutures Sales (k Pcs) by Type (2018-2023)
- Table 51. Global Barbed Sutures Sales (k Pcs) by Type (2024-2029)
- Table 52. Global Barbed Sutures Sales Market Share by Type (2018-2023)
- Table 53. Global Barbed Sutures Sales Market Share by Type (2024-2029)
- Table 54. Global Barbed Sutures Revenue (US$ Million) by Type (2018-2023)
- Table 55. Global Barbed Sutures Revenue (US$ Million) by Type (2024-2029)
- Table 56. Global Barbed Sutures Revenue Market Share by Type (2018-2023)
- Table 57. Global Barbed Sutures Revenue Market Share by Type (2024-2029)
- Table 58. Global Barbed Sutures Price (US$/Pcs) by Type (2018-2023)
- Table 59. Global Barbed Sutures Price (US$/Pcs) by Type (2024-2029)
- Table 60. Global Barbed Sutures Sales (k Pcs) by Application (2018-2023)
- Table 61. Global Barbed Sutures Sales (k Pcs) by Application (2024-2029)
- Table 62. Global Barbed Sutures Sales Market Share by Application (2018-2023)
- Table 63. Global Barbed Sutures Sales Market Share by Application (2024-2029)
- Table 64. Global Barbed Sutures Revenue (US$ Million) by Application (2018-2023)
- Table 65. Global Barbed Sutures Revenue (US$ Million) by Application (2024-2029)
- Table 66. Global Barbed Sutures Revenue Market Share by Application (2018-2023)
- Table 67. Global Barbed Sutures Revenue Market Share by Application (2024-2029)
- Table 68. Global Barbed Sutures Price (US$/Pcs) by Application (2018-2023)
- Table 69. Global Barbed Sutures Price (US$/Pcs) by Application (2024-2029)
- Table 70. Corza Medical Company Information
- Table 71. Corza Medical Description and Business Overview
- Table 72. Corza Medical Barbed Sutures Sales (k Pcs), Revenue (US$ Million), Price (US$/Pcs) and Gross Margin (2018-2023)
- Table 73. Corza Medical Barbed Sutures Product
- Table 74. Corza Medical Recent Developments/Updates
- Table 75. Johnson & Johnson Company Information
- Table 76. Johnson & Johnson Description and Business Overview
- Table 77. Johnson & Johnson Barbed Sutures Sales (k Pcs), Revenue (US$ Million), Price (US$/Pcs) and Gross Margin (2018-2023)
- Table 78. Johnson & Johnson Barbed Sutures Product
- Table 79. Johnson & Johnson Recent Developments/Updates
- Table 80. Medtronic Company Information
- Table 81. Medtronic Description and Business Overview
- Table 82. Medtronic Barbed Sutures Sales (k Pcs), Revenue (US$ Million), Price (US$/Pcs) and Gross Margin (2018-2023)
- Table 83. Medtronic Barbed Sutures Product
- Table 84. Medtronic Recent Developments/Updates
- Table 85. RESORBA Medical GmbH Company Information
- Table 86. RESORBA Medical GmbH Description and Business Overview
- Table 87. RESORBA Medical GmbH Barbed Sutures Sales (k Pcs), Revenue (US$ Million), Price (US$/Pcs) and Gross Margin (2018-2023)
- Table 88. RESORBA Medical GmbH Barbed Sutures Product
- Table 89. RESORBA Medical GmbH Recent Developments/Updates
- Table 90. META BIOMED Company Information
- Table 91. META BIOMED Description and Business Overview
- Table 92. META BIOMED Barbed Sutures Sales (k Pcs), Revenue (US$ Million), Price (US$/Pcs) and Gross Margin (2018-2023)
- Table 93. META BIOMED Barbed Sutures Product
- Table 94. META BIOMED Recent Developments/Updates
- Table 95. SERAG-WIESSNER Company Information
- Table 96. SERAG-WIESSNER Description and Business Overview
- Table 97. SERAG-WIESSNER Barbed Sutures Sales (k Pcs), Revenue (US$ Million), Price (US$/Pcs) and Gross Margin (2018-2023)
- Table 98. SERAG-WIESSNER Barbed Sutures Product
- Table 99. Futura Surgicare Company Information
- Table 100. Futura Surgicare Description and Business Overview
- Table 101. Futura Surgicare Barbed Sutures Sales (k Pcs), Revenue (US$ Million), Price (US$/Pcs) and Gross Margin (2018-2023)
- Table 102. Futura Surgicare Barbed Sutures Product
- Table 103. Cortis Company Information
- Table 104. Cortis Description and Business Overview
- Table 105. Cortis Barbed Sutures Sales (k Pcs), Revenue (US$ Million), Price (US$/Pcs) and Gross Margin (2018-2023)
- Table 106. Cortis Barbed Sutures Product
- Table 107. Weigao Group Company Information
- Table 108. Weigao Group Description and Business Overview
- Table 109. Weigao Group Barbed Sutures Sales (k Pcs), Revenue (US$ Million), Price (US$/Pcs) and Gross Margin (2018-2023)
- Table 110. Weigao Group Barbed Sutures Product
- Table 111. Key Raw Materials Lists
- Table 112. Raw Materials Key Suppliers Lists
- Table 113. Barbed Sutures Distributors List
- Table 114. Barbed Sutures Customers List
- Table 115. Barbed Sutures Market Trends
- Table 116. Barbed Sutures Market Drivers
- Table 117. Barbed Sutures Market Challenges
- Table 118. Barbed Sutures Market Restraints
- Table 119. Research Programs/Design for This Report
- Table 120. Key Data Information from Secondary Sources
- Table 121. Key Data Information from Primary Sources
- Table 122. Authors List of This Report
- Table 123. QYR Business Unit and Senior & Team Lead Analysts
List of Figures
- Figure 1. Product Picture of Barbed Sutures
- Figure 2. Global Barbed Sutures Market Value Comparison by Type (2018-2029) & (US$ Million)
- Figure 3. Global Barbed Sutures Market Share by Type: 2022 & 2029
- Figure 4. Unidiretional Barb Product Picture
- Figure 5. Bi-directional Barb Product Picture
- Figure 6. Global Barbed Sutures Market Value by Application (2018-2029) & (US$ Million)
- Figure 7. Global Barbed Sutures Market Share by Application: 2022 & 2029
- Figure 8. General Surgery
- Figure 9. Orthopedic Surgery
- Figure 10. Gynecology and Obstetrics
- Figure 11. Urology
- Figure 12. Plastic Surgery
- Figure 13. Oncology
- Figure 14. Cardiothoracic Surgery
- Figure 15. Pediatric Surgery
- Figure 16. Ophthalmology
- Figure 17. Dermatology
- Figure 18. Global Barbed Sutures Revenue, (US$ Million), 2018 VS 2023 VS 2029
- Figure 19. Global Barbed Sutures Market Size (2018-2029) & (US$ Million)
- Figure 20. Global Barbed Sutures Sales (2018-2029) & (k Pcs)
- Figure 21. Global Barbed Sutures Average Price (US$/Pcs) & (2018-2029)
- Figure 22. Barbed Sutures Report Years Considered
- Figure 23. Barbed Sutures Sales Share by Manufacturers in 2022
- Figure 24. Global Barbed Sutures Revenue Share by Manufacturers in 2022
- Figure 25. Global 5 Largest Barbed Sutures Players: Market Share by Revenue in Barbed Sutures in 2022
- Figure 26. Barbed Sutures Market Share by Company Type (Tier 1, Tier 2, and Tier 3): 2018 VS 2022
- Figure 27. Global Barbed Sutures Market Size by Region (US$ Million): 2018 VS 2023 VS 2029
- Figure 28. North America Barbed Sutures Sales Market Share by Country (2018-2029)
- Figure 29. North America Barbed Sutures Revenue Market Share by Country (2018-2029)
- Figure 30. United States Barbed Sutures Revenue Growth Rate (2018-2029) & (US$ Million)
- Figure 31. Canada Barbed Sutures Revenue Growth Rate (2018-2029) & (US$ Million)
- Figure 32. Europe Barbed Sutures Sales Market Share by Country (2018-2029)
- Figure 33. Europe Barbed Sutures Revenue Market Share by Country (2018-2029)
- Figure 34. Germany Barbed Sutures Revenue Growth Rate (2018-2029) & (US$ Million)
- Figure 35. France Barbed Sutures Revenue Growth Rate (2018-2029) & (US$ Million)
- Figure 36. U.K. Barbed Sutures Revenue Growth Rate (2018-2029) & (US$ Million)
- Figure 37. Italy Barbed Sutures Revenue Growth Rate (2018-2029) & (US$ Million)
- Figure 38. Russia Barbed Sutures Revenue Growth Rate (2018-2029) & (US$ Million)
- Figure 39. Asia Pacific Barbed Sutures Sales Market Share by Region (2018-2029)
- Figure 40. Asia Pacific Barbed Sutures Revenue Market Share by Region (2018-2029)
- Figure 41. China Barbed Sutures Revenue Growth Rate (2018-2029) & (US$ Million)
- Figure 42. Japan Barbed Sutures Revenue Growth Rate (2018-2029) & (US$ Million)
- Figure 43. South Korea Barbed Sutures Revenue Growth Rate (2018-2029) & (US$ Million)
- Figure 44. Southeast Asia Barbed Sutures Revenue Growth Rate (2018-2029) & (US$ Million)
- Figure 45. India Barbed Sutures Revenue Growth Rate (2018-2029) & (US$ Million)
- Figure 46. Australia Barbed Sutures Revenue Growth Rate (2018-2029) & (US$ Million)
- Figure 47. Latin America Barbed Sutures Sales Market Share by Country (2018-2029)
- Figure 48. Mexico Barbed Sutures Revenue Growth Rate (2018-2029) & (US$ Million)
- Figure 49. Brazil Barbed Sutures Revenue Growth Rate (2018-2029) & (US$ Million)
- Figure 50. Middle East and Africa Barbed Sutures Sales Market Share by Country (2018-2029)
- Figure 51. Middle East and Africa Barbed Sutures Revenue Market Share by Country (2018-2029)
- Figure 52. Saudi Arabia Barbed Sutures Revenue Growth Rate (2018-2029) & (US$ Million)
- Figure 53. UAE Barbed Sutures Revenue Growth Rate (2018-2029) & (US$ Million)
- Figure 54. Egypt Barbed Sutures Revenue Growth Rate (2018-2029) & (US$ Million)
- Figure 55. South Africa Barbed Sutures Revenue Growth Rate (2018-2029) & (US$ Million)
- Figure 56. Global Sales Market Share of Barbed Sutures by Type (2018-2029)
- Figure 57. Global Revenue Market Share of Barbed Sutures by Type (2018-2029)
- Figure 58. Global Barbed Sutures Price (US$/Pcs) by Type (2018-2029)
- Figure 59. Global Sales Market Share of Barbed Sutures by Application (2018-2029)
- Figure 60. Global Revenue Market Share of Barbed Sutures by Application (2018-2029)
- Figure 61. Global Barbed Sutures Price (US$/Pcs) by Application (2018-2029)
- Figure 62. Barbed Sutures Value Chain
- Figure 63. Barbed Sutures Production Process
- Figure 64. Channels of Distribution (Direct Vs Distribution)
- Figure 65. Distributors Profiles
- Figure 66. Bottom-up and Top-down Approaches for This Report
- Figure 67. Data Triangulation
- Figure 68. Key Executives Interviewed
Global Barbed Sutures market size in terms of revenue is projected to reach 1,080.76 Million USD by 2029 from 622.26 Million USD in 2023, with a CAGR 9.64% during 2023-2029. The influence of COVID-19 and the Russia-Ukraine War were considered while estimating market sizes.
North America market for Barbed Sutures is estimated to increase from 212.32 million USD in 2023 to reach 353.98 million USD by 2029, at a CAGR of 8.89% during the forecast period of 2023 through 2029.
Europe market for Barbed Sutures is estimated to increase from 173.54 million USD in 2023 to reach 295.86 million USD by 2029, at a CAGR of 9.30% during the forecast period of 2023 through 2029.
Asia-Pacific market for Barbed Sutures is estimated to increase from 200.74 million USD in 2023 to reach 365.76 million USD by 2029, at a CAGR of 10.52% during the forecast period of 2023 through 2029.
Latin America market for Barbed Sutures is estimated to increase from 17.66 million USD in 2023 to reach 33.04 million USD by 2029, at a CAGR of 11.00% during the forecast period of 2023 through 2029.
Middle East and Africa market for Barbed Sutures is estimated to increase from 18.00 million USD in 2023 to reach 32.12 million USD by 2029, at a CAGR of 10.13% during the forecast period of 2023 through 2029.
The major global manufacturers of Barbed Sutures include Corza Medical, Johnson & Johnson, Medtronic, Resorba (Advanced Medical Solutions), Meta Biomed, Serag-Wiessner, Dolphin Sutures (Futura Surgicare), Cortis, Shandong Weigao, etc. In 2022, the world's top five vendors accounted for approximately 85.29% of the revenue.
Report Scope
This report aims to provide a comprehensive presentation of the global market for Barbed Sutures, with both quantitative and qualitative analysis, to help readers develop business/growth strategies, assess the market competitive situation, analyze their position in the current marketplace, and make informed business decisions regarding Barbed Sutures.
The Barbed Sutures market size, estimations, and forecasts are provided in terms of sales volume (k Pcs) and revenue ($ millions), considering 2021 as the base year, with history and forecast data for the period from 2017 to 2028. This report segments the global Barbed Sutures market comprehensively. Regional market sizes, concerning products by Type, by Application, and by players, are also provided.
For a more in-depth understanding of the market, the report provides profiles of the competitive landscape, key competitors, and their respective market ranks. The report also discusses technological trends and new product developments.
The report will help the Barbed Sutures manufacturers, new entrants, and industry chain related companies in this market with information on the revenues, sales volume, and average price for the overall market and the sub-segments across the different segments, by company, by Type, by Application, and by regions.
By Company
- Corza Medical
- Johnson & Johnson
- Medtronic
- Resorba (Advanced Medical Solutions)
- Meta Biomed
- Serag-Wiessner
- Dolphin Sutures (Futura Surgicare)
- Cortis
- Shandong Weigao
Segment by Type
- Unidirectional
- Bidirectional
Segment by Application
- General Surgery
- Orthopedic Surgery
- Gynecology and Obstetrics
- Urology
- Plastic Surgery
- Oncology
- Cardiothoracic Surgery
- Pediatric Surgery
- Ophthalmology
- Others
Consumption by Region
- North America
- U.S.
- Canada
- Asia-Pacific
- China
- Japan
- South Korea
- Southeast Asia
- India
- Australia
- Europe
- Germany
- France
- U.K.
- Italy
- Russia
- Rest of Europe
- South America
- Mexico
- Brazil
- Rest of South America
Core Chapters
Chapter 1: Introduces the report scope of the report, executive summary of different market segments (by region, product type, application, etc), including the market size of each market segment, future development potential, and so on. It offers a high-level view of the current state of the market and its likely evolution in the short to mid-term, and long term.
Chapter 2: Detailed analysis of Barbed Sutures manufacturers competitive landscape, price, sales and revenue market share, latest development plan, merger, and acquisition information, etc.
Chapter 3: Sales, revenue of Barbed Sutures in regional level and country level. It provides a quantitative analysis of the market size and development potential of each region and its main countries and introduces the market development, future development prospects, market space, and market size of each country in the world.
Chapter 4: Provides the analysis of various market segments by Type, covering the market size and development potential of each market segment, to help readers find the blue ocean market in different market segments.
Chapter 5: Provides the analysis of various market segments by Application, covering the market size and development potential of each market segment, to help readers find the blue ocean market in different downstream markets.
Chapter 6: Provides profiles of key players, introducing the basic situation of the main companies in the market in detail, including product sales, revenue, price, gross margin, product introduction, recent development, etc.
Chapter 7: Analysis of industrial chain, including the upstream and downstream of the industry.
Chapter 8: Introduces the market dynamics, latest developments of the market, the driving factors and restrictive factors of the market, the challenges and risks faced by manufacturers in the industry, and the analysis of relevant policies in the industry.
Chapter 9: The main points and conclusions of the report.
Table of Contents
1 Barbed Sutures Market Overview
- 1.1 Product Definition
- 1.2 Barbed Sutures by Type
- 1.2.1 Global Barbed Sutures Market Value Comparison by Type (2023-2029)
- 1.2.2 Unidiretional Barb
- 1.2.3 Bi-directional Barb
- 1.3 Barbed Sutures by Application
- 1.3.1 Global Barbed Sutures Market Value by Application (2023-2029)
- 1.3.2 General Surgery
- 1.3.3 Orthopedic Surgery
- 1.3.4 Gynecology and Obstetrics
- 1.3.5 Urology
- 1.3.6 Plastic Surgery
- 1.3.7 Oncology
- 1.3.8 Cardiothoracic Surgery
- 1.3.9 Pediatric Surgery
- 1.3.10 Ophthalmology
- 1.3.11 Others
- 1.4 Global Barbed Sutures Market Size Estimates and Forecasts
- 1.4.1 Global Barbed Sutures Revenue 2018-2029
- 1.4.2 Global Barbed Sutures Sales 2018-2029
- 1.4.3 Global Barbed Sutures Market Average Price (2018-2029)
- 1.5 Assumptions and Limitations
2 Barbed Sutures Market Competition by Manufacturers
- 2.1 Global Barbed Sutures Sales Market Share by Manufacturers (2018-2023)
- 2.2 Global Barbed Sutures Revenue Market Share by Manufacturers (2018-2023)
- 2.3 Global Barbed Sutures Average Price by Manufacturers (2018-2023)
- 2.4 Global Key Players of Barbed Sutures, Industry Ranking, 2021 VS 2022 VS 2023
- 2.5 Global Key Manufacturers of Barbed Sutures, Manufacturing Sites & Headquarters
- 2.6 Global Key Manufacturers of Barbed Sutures, Product Type & Application
- 2.7 Global Key Manufacturers of Barbed Sutures, Date of Enter into This Industry
- 2.8 Global Barbed Sutures Market Competitive Situation and Trends
- 2.8.1 Global Barbed Sutures Market Concentration Rate
- 2.8.2 The Global 5 Largest Barbed Sutures Players Market Share by Revenue
- 2.8.3 Global Barbed Sutures Market Share by Company Type (Tier 1, Tier 2, and Tier 3)
- 2.9 Manufacturers Mergers & Acquisitions, Expansion Plans
3 Global Barbed Sutures Market Scenario by Region
- 3.1 Global Barbed Sutures Market Size by Region: 2018 Versus 2023 Versus 2029
- 3.2 Global Barbed Sutures Sales by Region: 2018-2029
- 3.2.1 Global Barbed Sutures Sales by Region: 2018-2023
- 3.2.2 Global Barbed Sutures Sales by Region: 2024-2029
- 3.3 Global Barbed Sutures Revenue by Region: 2018-2029
- 3.3.1 Global Barbed Sutures Revenue by Region: 2018-2023
- 3.3.2 Global Barbed Sutures Revenue by Region: 2024-2029
- 3.4 North America Barbed Sutures Market Facts & Figures by Country
- 3.4.1 North America Barbed Sutures Market Size by Country: 2018 VS 2023 VS 2029
- 3.4.2 North America Barbed Sutures Sales by Country (2018-2029)
- 3.4.3 North America Barbed Sutures Revenue by Country (2018-2029)
- 3.4.4 United States
- 3.4.5 Canada
- 3.5 Europe Barbed Sutures Market Facts & Figures by Country
- 3.5.1 Europe Barbed Sutures Market Size by Country: 2018 VS 2023 VS 2029
- 3.5.2 Europe Barbed Sutures Sales by Country (2018-2029)
- 3.5.3 Europe Barbed Sutures Revenue by Country (2018-2029)
- 3.5.4 Germany
- 3.5.5 France
- 3.5.6 U.K.
- 3.5.7 Italy
- 3.5.8 Russia
- 3.6 Asia Pacific Barbed Sutures Market Facts & Figures by Region
- 3.6.1 Asia Pacific Barbed Sutures Market Size by Region: 2018 VS 2023 VS 2029
- 3.6.2 Asia Pacific Barbed Sutures Sales by Region (2018-2029)
- 3.6.3 Asia Pacific Barbed Sutures Revenue by Region (2018-2029)
- 3.6.4 China
- 3.6.5 Japan
- 3.6.6 South Korea
- 3.6.7 Southeast Asia
- 3.6.8 India
- 3.6.9 Australia
- 3.7 Latin America Barbed Sutures Market Facts & Figures by Country
- 3.7.1 Latin America Barbed Sutures Market Size by Country: 2018 VS 2023 VS 2029
- 3.7.2 Latin America Barbed Sutures Sales by Country (2018-2029)
- 3.7.3 Latin America Barbed Sutures Revenue by Country
- 3.7.4 Mexico
- 3.7.5 Brazil
- 3.8 Middle East and Africa Barbed Sutures Market Facts & Figures by Country
- 3.8.1 Middle East and Africa Barbed Sutures Market Size by Country: 2018 VS 2023 VS 2029
- 3.8.2 Middle East and Africa Barbed Sutures Sales by Country (2018-2029)
- 3.8.3 Middle East and Africa Barbed Sutures Revenue by Country
- 3.8.4 Saudi Arabia
- 3.8.5 UAE
- 3.8.6 Egypt
- 3.8.7 South Africa
4 Segment by Type
- 4.1 Global Barbed Sutures Sales by Type (2018-2029)
- 4.1.1 Global Barbed Sutures Sales by Type (2018-2023)
- 4.1.2 Global Barbed Sutures Sales by Type (2024-2029)
- 4.1.3 Global Barbed Sutures Sales Market Share by Type (2018-2029)
- 4.2 Global Barbed Sutures Revenue by Type (2018-2029)
- 4.2.1 Global Barbed Sutures Revenue by Type (2018-2023)
- 4.2.2 Global Barbed Sutures Revenue by Type (2024-2029)
- 4.2.3 Global Barbed Sutures Revenue Market Share by Type (2018-2029)
- 4.3 Global Barbed Sutures Price by Type (2018-2029)
5 Segment by Application
- 5.1 Global Barbed Sutures Sales by Application (2018-2029)
- 5.1.1 Global Barbed Sutures Sales by Application (2018-2023)
- 5.1.2 Global Barbed Sutures Sales by Application (2024-2029)
- 5.1.3 Global Barbed Sutures Sales Market Share by Application (2018-2029)
- 5.2 Global Barbed Sutures Revenue by Application (2018-2029)
- 5.2.1 Global Barbed Sutures Revenue by Application (2018-2023)
- 5.2.2 Global Barbed Sutures Revenue by Application (2024-2029)
- 5.2.3 Global Barbed Sutures Revenue Market Share by Application (2018-2029)
- 5.3 Global Barbed Sutures Price by Application (2018-2029)
6 Key Companies Profiled
- 6.1 Corza Medical
- 6.1.1 Corza Medical Company Information
- 6.1.2 Corza Medical Description and Business Overview
- 6.1.3 Corza Medical Barbed Sutures Sales, Revenue and Gross Margin (2018-2023)
- 6.1.4 Corza Medical Barbed Sutures Product Portfolio
- 6.1.5 Corza Medical Recent Developments/Updates
- 6.2 Johnson & Johnson
- 6.2.1 Johnson & Johnson Company Information
- 6.2.2 Johnson & Johnson Description and Business Overview
- 6.2.3 Johnson & Johnson Barbed Sutures Sales, Revenue and Gross Margin (2018-2023)
- 6.2.4 Johnson & Johnson Barbed Sutures Product Portfolio
- 6.2.5 Johnson & Johnson Recent Developments/Updates
- 6.3 Medtronic
- 6.3.1 Medtronic Company Information
- 6.3.2 Medtronic Description and Business Overview
- 6.3.3 Medtronic Barbed Sutures Sales, Revenue and Gross Margin (2018-2023)
- 6.3.4 Medtronic Barbed Sutures Product Portfolio
- 6.3.5 Medtronic Recent Developments/Updates
- 6.4 RESORBA Medical GmbH
- 6.4.1 RESORBA Medical GmbH Company Information
- 6.4.2 RESORBA Medical GmbH Description and Business Overview
- 6.4.3 RESORBA Medical GmbH Barbed Sutures Sales, Revenue and Gross Margin (2018-2023)
- 6.4.4 RESORBA Medical GmbH Barbed Sutures Product Portfolio
- 6.4.5 RESORBA Medical GmbH Recent Developments/Updates
- 6.5 META BIOMED
- 6.5.1 META BIOMED Company Information
- 6.5.2 META BIOMED Description and Business Overview
- 6.5.3 META BIOMED Barbed Sutures Sales, Revenue and Gross Margin (2018-2023)
- 6.5.4 META BIOMED Barbed Sutures Product Portfolio
- 6.5.5 META BIOMED Recent Developments/Updates
- 6.6 SERAG-WIESSNER
- 6.6.1 SERAG-WIESSNER Company Information
- 6.6.2 SERAG-WIESSNER Description and Business Overview
- 6.6.3 SERAG-WIESSNER Barbed Sutures Sales, Revenue and Gross Margin (2018-2023)
- 6.6.4 SERAG-WIESSNER Barbed Sutures Product Portfolio
- 6.7 Futura Surgicare
- 6.7.1 Futura Surgicare Company Information
- 6.7.2 Futura Surgicare Description and Business Overview
- 6.7.3 Futura Surgicare Barbed Sutures Sales, Revenue and Gross Margin (2018-2023)
- 6.7.4 Futura Surgicare Barbed Sutures Product Portfolio
- 6.8 Cortis
- 6.8.1 Cortis Company Information
- 6.8.2 Cortis Description and Business Overview
- 6.8.3 Cortis Barbed Sutures Sales, Revenue and Gross Margin (2018-2023)
- 6.8.4 Cortis Barbed Sutures Product Portfolio
- 6.9 Weigao Group
- 6.9.1 Weigao Group Company Information
- 6.9.2 Weigao Group Description and Business Overview
- 6.9.3 Weigao Group Barbed Sutures Sales, Revenue and Gross Margin (2018-2023)
- 6.9.4 Weigao Group Barbed Sutures Product Portfolio
7 Industry Chain and Sales Channels Analysis
- 7.1 Barbed Sutures Industry Chain Analysis
- 7.2 Barbed Sutures Key Raw Materials
- 7.2.1 Key Raw Materials
- 7.2.2 Raw Materials Key Suppliers
- 7.3 Barbed Sutures Production Mode & Process
- 7.4 Barbed Sutures Sales and Marketing
- 7.4.1 Barbed Sutures Sales Channels
- 7.4.2 Barbed Sutures Distributors
- 7.5 Barbed Sutures Customers
8 Barbed Sutures Market Dynamics
- 8.1 Barbed Sutures Industry Trends
- 8.2 Barbed Sutures Market Drivers
- 8.3 Barbed Sutures Market Challenges
- 8.4 Barbed Sutures Market Restraints
9 Research Findings and Conclusion
10 Methodology and Data Source
- 10.1 Methodology/Research Approach
- 10.1.1 Research Programs/Design
- 10.1.2 Market Size Estimation
- 10.1.3 Market Breakdown and Data Triangulation
- 10.2 Data Source
- 10.2.1 Secondary Sources
- 10.2.2 Primary Sources
- 10.3 Author List
- 10.4 Disclaimer