|
|
市場調査レポート
商品コード
1238103
ラボ用ロボットの世界市場:分析・実績・予測 (2023年~2029年)Global Laboratory Robotics Market Report, History and Forecast 2023-2029 |
||||||
|
|
|||||||
|
● お客様のご希望に応じて、既存データの加工や未掲載情報(例:国別セグメント)の追加などの対応が可能です。 詳細はお問い合わせください。 |
|||||||


| ラボ用ロボットの世界市場:分析・実績・予測 (2023年~2029年) |
|
出版日: 2023年03月16日
発行: QYResearch
ページ情報: 英文 110 Pages
納期: 2~3営業日
|
- 全表示
- 概要
- 図表
- 目次
ラボ用ロボットの世界市場は、2022年に3億9,384万米ドルと推定され、2029年には6億4,086万米ドルの改定規模に達し、予測期間2023-2029年に7.12%のCAGRで成長すると予測されます。
当レポートでは、世界のラボ用ロボットの市場について分析し、種類別・用途別・地域別 (国別) の市場動向の見通し (2018年~2029年)、主要企業のプロファイルなどについて調査しております。
目次
第1章 ラボ用ロボット:市場概要
- ラボ用ロボット:製品概要
- ラボ用ロボット市場:種類別
- 生物学向けラボ用ロボット
- 製薬向けラボ用ロボット
- 種類別の市場規模
- 市場規模の概要:種類別 (2018年~2029年)
- 過去の市場規模:種類別 (2018年~2023年)
- 市場規模の予測:種類別 (2024年~2029年)
- 主要地域の市場規模:種類別
- 北米のラボ用ロボットの販売:種類別 (2018年~2023年)
- 欧州のラボ用ロボットの販売:種類別 (2018年~2023年)
- アジア太平洋のラボ用ロボットの販売:種類別 (2018年~2023年)
- ラテンアメリカのラボ用ロボットの販売:種類別 (2018年~2023年)
- 中東・アフリカのラボ用ロボットの販売:種類別 (2018年~2023年)
第2章 ラボ用ロボット:企業別の市場競争
- 世界のラボ用ロボットの主要企業の収益 (2020年~2023年)
- 世界のラボ用ロボットの主要メーカーの製造拠点
- ラボ用ロボット市場の競争状況と動向
- 世界の主要メーカー:企業の種類別 (ティア1、ティア2、ティア3) (収益別、2022年)
- 企業合併・買収 (M&A)、拡大
第3章 ラボ用ロボット:地域別の現状と展望
- 世界のラボ用ロボットの市場規模・CAGR:地域別 (2018年・2022年・2029年)
- 過去の市場規模:地域別
- 市場規模の予測:地域別
第4章 ラボ用ロボット:用途別
- ラボ用ロボット市場:用途別
- 臨床検査室
- 研究室
- 用途別の市場規模
- 市場規模の概要:用途別 (2018年~2029年)
- 過去の市場規模:用途別 (2018年~2023年)
- 市場規模の予測:用途別 (2024年~2029年)
- 主要地域の市場規模:用途別
- 欧州のラボ用ロボットの販売:用途別 (2018年~2023年)
- アジア太平洋のラボ用ロボットの販売:用途別 (2018年~2023年)
- ラテンアメリカのラボ用ロボットの販売:用途別 (2018年~2023年)
- 中東・アフリカのラボ用ロボットの販売:用途別 (2018年~2023年)
第5章 北米のラボ用ロボット:国別
- 過去の市場規模:国別
- 市場規模の予測:国別
第6章 欧州のラボ用ロボット:国別
第7章 アジア太平洋のラボ用ロボット:地域別
第8章 ラテンアメリカのラボ用ロボット:国別
第9章 中東・アフリカのラボ用ロボット:国別
第10章 企業プロファイル
- Beckman Coulter
- Tecan Group
- Yaskawa Electric
- Thermo Fisher Scientific
- Protedyne (LabCorp)
- PerkinElmer
- Universal Robots
- Anton Paar
- HighRes Biosolutions
- Hamilton Company
- Aurora Biomed
- Labman
- Hudson Robotics
- ST Robotics
- Chemspeed Technologies
- AB Controls
- Peak Analysis &Automation
第11章 上流工程・機会・課題・リスク・影響要因の分析
- ラボ用ロボットの主要原材料
- 製造コストの構造
- ラボ用ロボットの産業チェーンの分析
- ラボ用ロボットの市場力学
第12章 マーケティング戦略分析、流通業者
- 販売チャンネル
- ラボ用ロボットの流通業者
- ラボ用ロボットの下流工程の顧客
第13章 調査結果と結論
第14章 付録
List of Tables
- Table 1. Global Laboratory Robotics Sales by Type: 2018 VS 2022 VS 2029 (US$ Million)
- Table 2. Global Laboratory Robotics Sales by Type (2018-2023) & (US$ Million)
- Table 3. Global Laboratory Robotics Sales Market Share in Value by Type (2018-2023)
- Table 4. Global Laboratory Robotics Sales by Type (2024-2029) & (US$ Million)
- Table 5. Global Laboratory Robotics Sales Market Share in Value by Type (2024-2029)
- Table 6. North America Laboratory Robotics Sales by Type (2018-2023) & (US$ Million)
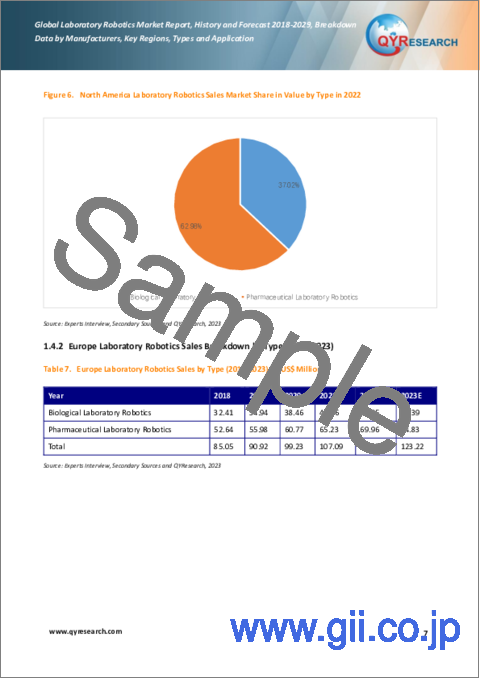
- Table 7. Europe Laboratory Robotics Sales by Type (2018-2023) & (US$ Million)
- Table 8. Asia-Pacific Laboratory Robotics Sales by Type (2018-2023) & (US$ Million)
- Table 9. Latin America Laboratory Robotics Sales by Type (2018-2023) & (US$ Million)
- Table 10. Middle East and Africa Laboratory Robotics Sales by Type (2018-2023) & (US$ Million)
- Table 11. Global Laboratory Robotics Revenue by Company (2020-2023) & (US$ Million)
- Table 12. Global Laboratory Robotics Revenue Share by Company (2020-2023)
- Table 13. Global Laboratory Robotics Top Manufacturers Manufacturing Base Distribution
- Table 14. Global Laboratory Robotics Manufacturers Market Concentration Ratio (CR5 and HHI)
- Table 15. Global Top Manufacturers Market Share by Company Type (Tier 1, Tier 2, and Tier 3) & (based on the Revenue in Laboratory Robotics as of 2022)
- Table 16. Mergers & Acquisitions, Expansion Plans
- Table 17. Global Laboratory Robotics Market Size Comparison by Region (US$ Million): 2018 VS 2022 VS 2029
- Table 18. Global Laboratory Robotics Sales by Region (2018-2023) & (Units)
- Table 19. Global Laboratory Robotics Sales Market Share in Volume by Region (2018-2023)
- Table 20. Global Laboratory Robotics Sales by Region (2018-2023) & (US$ Million)
- Table 21. Global Laboratory Robotics Sales Market Share in Value by Region (2018-2023)
- Table 22. Global Laboratory Robotics Sales (Units), Value (US$ Million), Price (US$/Unit) (2018-2023)
- Table 23. Global Laboratory Robotics Sales by Region (2024-2029) & (Units)
- Table 24. Global Laboratory Robotics Sales Market Share in Volume by Region (2024-2029)
- Table 25. Global Laboratory Robotics Sales by Region (2024-2029) & (US$ Million)
- Table 26. Global Laboratory Robotics Sales Market Share in Value by Region (2024-2029)
- Table 27. Global Laboratory Robotics Sales (Units), Value (US$ Million), Price (US$/Unit) & (2024-2029)
- Table 28. Global Laboratory Robotics Sales by Application: 2018 VS 2022 VS 2029 (US$ Million)
- Table 29. Global Laboratory Robotics Sales by Application (2018-2023) & (US$ Million)
- Table 30. Global Laboratory Robotics Sales Market Share in Value by Application (2018-2023)
- Table 31. Global Laboratory Robotics Sales by Application (2024-2029) & (US$ Million)
- Table 32. Global Laboratory Robotics Sales Market Share in Value by Application (2024-2029)
- Table 33. North America Laboratory Robotics Sales by Application (2018-2023) & (US$ Million)
- Table 34. Europe Laboratory Robotics Sales by Application (2018-2023) & (US$ Million)
- Table 35. Asia-Pacific Laboratory Robotics Sales by Application (2018-2023) & (US$ Million)
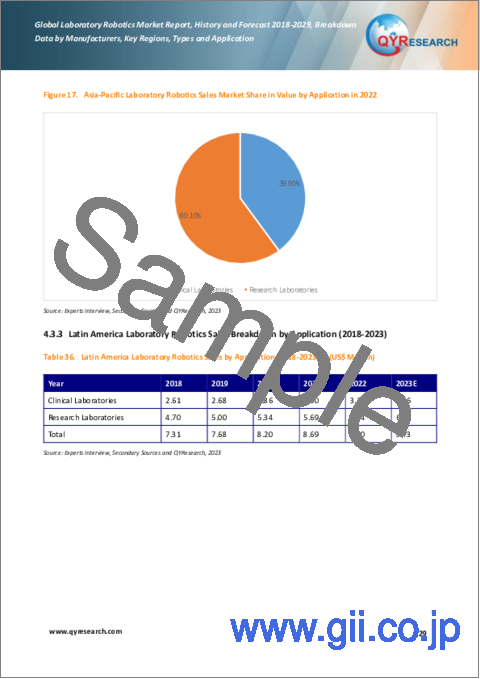
- Table 36. Latin America Laboratory Robotics Sales by Application (2018-2023) & (US$ Million)
- Table 37. Middle East and Africa Laboratory Robotics Sales by Application (2018-2023) & (US$ Million)
- Table 38. North America Laboratory Robotics Sales by Country (2018-2023) & (Units)
- Table 39. North America Laboratory Robotics Sales Market Share in Volume by Country (2018-2023)
- Table 40. North America Laboratory Robotics Sales by Country (2018-2023) & (US$ Million)
- Table 41. North America Laboratory Robotics Sales Market Share in Value by Country (2018-2023)
- Table 42. North America Laboratory Robotics Sales by Country (2024-2029) & (Units)
- Table 43. North America Laboratory Robotics Sales by Country (2024-2029) & (US$ Million)
- Table 44. Europe Laboratory Robotics Sales by Country (2018-2023) & (Units)
- Table 45. Europe Laboratory Robotics Sales Market Share in Volume by Country (2018-2023)
- Table 46. Europe Laboratory Robotics Sales by Country (2018-2023) & (US$ Million)
- Table 47. Europe Laboratory Robotics Sales Market Share in Value by Country (2018-2023)
- Table 48. Europe Laboratory Robotics Sales by Country (2024-2029) & (Units)
- Table 49. Europe Laboratory Robotics Sales by Country (2024-2029) & (US$ Million)
- Table 50. Asia-Pacific Laboratory Robotics Sales by Region (2018-2023) & (Units)
- Table 51. Asia-Pacific Laboratory Robotics Sales Market Share in Volume by Region (2018-2023)
- Table 52. Asia-Pacific Laboratory Robotics Sales by Region (2018-2023) & (US$ Million)
- Table 53. Asia-Pacific Laboratory Robotics Sales Market Share in Value by Region (2018-2023)
- Table 54. Asia-Pacific Laboratory Robotics Sales by Region (2024-2029) & (Units)
- Table 55. Asia-Pacific Laboratory Robotics Sales by Region (2024-2029) & (US$ Million)
- Table 56. Latin America Laboratory Robotics Sales by Country (2018-2023) & (Units)
- Table 57. Latin America Laboratory Robotics Sales Market Share in Volume by Country (2018-2023)
- Table 58. Latin America Laboratory Robotics Sales by Country (2018-2023) & (US$ Million)
- Table 59. Latin America Laboratory Robotics Sales Market Share in Value by Country (2018-2023)
- Table 60. Latin America Laboratory Robotics Sales by Country (2024-2029) & (Units)
- Table 61. Latin America Laboratory Robotics Sales by Country (2024-2029) & (US$ Million)
- Table 62. Middle East and Africa Laboratory Robotics Sales by Country (2018-2023) & (Units)
- Table 63. Middle East and Africa Laboratory Robotics Sales Market Share in Volume by Country (2018-2023)
- Table 64. Middle East and Africa Laboratory Robotics Sales by Country (2018-2023) & (US$ Million)
- Table 65. Middle East and Africa Laboratory Robotics Sales Market Share in Value by Country (2018-2023)
- Table 66. Middle East and Africa Laboratory Robotics Sales by Country (2024-2029) & (Units)
- Table 67. Middle East and Africa Laboratory Robotics Sales by Country (2024-2029) & (US$ Million)
- Table 68. Beckman Coulter Company Information
- Table 69. Beckman Coulter Laboratory Robotics Revenue (US$ Million), Gross Margin and Global Market Share (2020-2023)
- Table 70. Beckman Coulter Laboratory Robotics Product
- Table 71. Tecan Group Company Information
- Table 72. Tecan Group Laboratory Robotics Revenue (US$ Million), Gross Margin and Global Market Share (2020-2023)
- Table 73. Tecan Group Laboratory Robotics Product
- Table 74. Yaskawa Electric Company Information
- Table 75. Yaskawa Electric Laboratory Robotics Revenue (US$ Million), Gross Margin and Global Market Share (2020-2023)
- Table 76. Yaskawa Electric Laboratory Robotics Product
- Table 77. Thermo Fisher Scientific Company Information
- Table 78. Thermo Fisher Scientific Laboratory Robotics Revenue (US$ Million), Gross Margin and Global Market Share (2020-2023)
- Table 79. Thermo Fisher Scientific Laboratory Robotics Product
- Table 80. Protedyne (LabCorp) Company Information
- Table 81. Protedyne (LabCorp) Laboratory Robotics Revenue (US$ Million), Gross Margin and Global Market Share (2020-2023)
- Table 82. Protedyne (LabCorp) Laboratory Robotics Product
- Table 83. PerkinElmer Company Information
- Table 84. PerkinElmer Laboratory Robotics Revenue (US$ Million), Gross Margin and Global Market Share (2020-2023)
- Table 85. PerkinElmer Laboratory Robotics Product
- Table 86. Universal Robots Company Information
- Table 87. Universal Robots Laboratory Robotics Revenue (US$ Million), Gross Margin and Global Market Share (2020-2023)
- Table 88. Universal Robots Laboratory Robotics Product
- Table 89. Anton Paar Company Information
- Table 90. Anton Paar Laboratory Robotics Revenue (US$ Million), Gross Margin and Global Market Share (2020-2023)
- Table 91. Anton Paar Laboratory Robotics Product
- Table 92. HighRes Biosolutions Company Information
- Table 93. HighRes Biosolutions Laboratory Robotics Revenue (US$ Million), Gross Margin and Global Market Share (2020-2023)
- Table 94. HighRes Biosolutions Laboratory Robotics Product
- Table 95. Hamilton Company Company Information
- Table 96. Hamilton Company Laboratory Robotics Revenue (US$ Million), Gross Margin and Global Market Share (2020-2023)
- Table 97. Hamilton Company Laboratory Robotics Product
- Table 98. Aurora Biomed Company Information
- Table 99. Aurora Biomed Laboratory Robotics Revenue (US$ Million), Gross Margin and Global Market Share (2020-2023)
- Table 100. Aurora Biomed Laboratory Robotics Product
- Table 101. Labman Company Information
- Table 102. Labman Laboratory Robotics Revenue (US$ Million), Gross Margin and Global Market Share (2020-2023)
- Table 103. Labman Laboratory Robotics Product
- Table 104. Hudson Robotics Company Information
- Table 105. Hudson Robotics Laboratory Robotics Revenue (US$ Million), Gross Margin and Global Market Share (2020-2023)
- Table 106. Hudson Robotics Laboratory Robotics Product
- Table 107. ST Robotics Company Information
- Table 108. ST Robotics Laboratory Robotics Revenue (US$ Million), Gross Margin and Global Market Share (2020-2023)
- Table 109. ST Robotics Laboratory Robotics Product
- Table 110. Chemspeed Technologies Company Information
- Table 111. Chemspeed Technologies Laboratory Robotics Revenue (US$ Million), Gross Margin and Global Market Share (2020-2023)
- Table 112. Chemspeed Technologies Laboratory Robotics Product
- Table 113. AB Controls Company Information
- Table 114. AB Controls Laboratory Robotics Revenue (US$ Million), Gross Margin and Global Market Share (2020-2023)
- Table 115. AB Controls Laboratory Robotics Product
- Table 116. Peak Analysis & Automation Company Information
- Table 117. Peak Analysis & Automation Laboratory Robotics Revenue (US$ Million), Gross Margin and Global Market Share (2020-2023)
- Table 118. Peak Analysis & Automation Laboratory Robotics Product
- Table 119. Raw Materials Key Suppliers Lists
- Table 120. Laboratory Robotics Market Drivers
- Table 121. Laboratory Robotics Market Challenges
- Table 122. Laboratory Robotics Distributors List
- Table 123. Laboratory Robotics Downstream Customers
- Table 124. Research Programs/Design for This Report
- Table 125. Key Data Information from Secondary Sources
- Table 126. Key Data Information from Primary Sources
- Table 127. QYR Business Unit and Senior & Team Lead Analysts
List of Figures
- Figure 1. Global Laboratory Robotics Market Size, 2018 VS 2022 VS 2029 (US$ Million)
- Figure 2. Global Laboratory Robotics Market Size Status and Outlook (2018-2029) & (US$ Million)
- Figure 3. Global Laboratory Robotics Sales Status and Outlook (2018-2029) & (Units)
- Figure 4. Global Laboratory Robotics Sales by Type (2018-2029) & (US$ Million)
- Figure 5. Global Laboratory Robotics Market Share by Type in 2022 & 2029
- Figure 6. North America Laboratory Robotics Sales Market Share in Value by Type in 2022
- Figure 7. Europe Laboratory Robotics Sales Market Share in Value by Type in 2022
- Figure 8. Asia-Pacific Laboratory Robotics Sales Market Share in Value by Type in 2022
- Figure 9. Latin America Laboratory Robotics Sales Market Share in Value by Type in 2022
- Figure 10. Middle East and Africa Laboratory Robotics Sales Market Share in Value by Type in 2022
- Figure 11. The 3 Largest Manufacturers in the World: Market Share by Laboratory Robotics Revenue in 2022
- Figure 12. The 6 Largest Manufacturers in the World: Market Share by Laboratory Robotics Revenue in 2022
- Figure 13. Global Laboratory Robotics Sales by Application (2018-2029) & (US$ Million)
- Figure 14. Global Laboratory Robotics Market Share by Application in 2022 & 2029
- Figure 15. North America Laboratory Robotics Sales Market Share in Value by Application in 2022
- Figure 16. Europe Laboratory Robotics Sales Market Share in Value by Application in 2022
- Figure 17. Asia-Pacific Laboratory Robotics Sales Market Share in Value by Application in 2022
- Figure 18. Latin America Laboratory Robotics Sales Market Share in Value by Application in 2022
- Figure 19. Middle East and Africa Laboratory Robotics Sales Market Share in Value by Application in 2022
- Figure 20. Laboratory Robotics Manufacturing Cost Structure
- Figure 21. Laboratory Robotics Industrial Chain Analysis
- Figure 22. Channels of Distribution
- Figure 23. Distributors Profiles
- Figure 24. Bottom-up and Top-down Approaches for This Report
- Figure 25. Data Triangulation
- Figure 26. Key Executives Interviewed
The global market for Laboratory Robotics was estimated at US$ 393.84 million in the year 2022, is projected to reach a revised size of US$ 640.86 million by 2029, growing at a CAGR of 7.12% during the forecast period 2023-2029.
Report Scope
This report aims to provide a comprehensive presentation of the global market for Laboratory Robotics, with both quantitative and qualitative analysis, to help readers develop business/growth strategies, assess the market competitive situation, analyze their position in the current marketplace, and make informed business decisions regarding Laboratory Robotics.
The Laboratory Robotics market size, estimations, and forecasts are provided in terms of sales volume (Units) and revenue ($ millions), considering 2022 as the base year, with history and forecast data for the period from 2018 to 2029. This report segments the global Laboratory Robotics market comprehensively. Regional market sizes, concerning products by Type, by Application, and by players, are also provided. The influence of COVID-19 and the Russia-Ukraine War were considered while estimating market sizes.
For a more in-depth understanding of the market, the report provides profiles of the competitive landscape, key competitors, and their respective market ranks. The report also discusses technological trends and new product developments.
This report will help the readers to understand the competition within the industries and strategies for the competitive environment to enhance the potential profit. The report also focuses on the competitive landscape of the global Laboratory Robotics market, and introduces in detail the market share, industry ranking, competitor ecosystem, market performance, new product development, operation situation, expansion, and acquisition. etc. of the main players, which helps the readers to identify the main competitors and deeply understand the competition pattern of the market.
Market Segmentation
This report covers the Laboratory Robotics segments by manufacturers, by Type, by Application, by region and country, and provides market size (value, volume and average price) and CAGR for the history and forecast period (2018-2022, 2023-2029), considering 2022 as the base year. It elucidates potential revenue opportunities across different segments and explains attractive investment proposition matrices for this market.
By Company
- Beckman Coulter
- Tecan Group
- Yaskawa Electric
- Thermo Fisher Scientific
- Protedyne (LabCorp)
- PerkinElmer
- Universal Robots
- Anton Paar
- HighRes Biosolutions
- Hamilton Company
- Aurora Biomed
- Labman
- Hudson Robotics
- ST Robotics
- Chemspeed Technologies
- AB Controls
- Peak Analysis & Automation
Segment by Type
- Biological Laboratory Robotics
- Pharmaceutical Laboratory Robotics
Segment by Application
- Clinical Laboratories
- Research Laboratories
By Region
- North America
- United States
- Canada
- Mexico
- Asia-Pacific
- China
- Japan
- Korea
- India
- Southeast Asia
- Australia
- Rest of Asia-Pacific
- Europe
- Germany
- UK
- France
- Russia
- Italy
- Rest of Europe
- Latin America
- Brazil
- Argentina
- Rest of Latin America
- Middle East & Africa
- Middle East
- Africa
Table of Contents
1 Laboratory Robotics Market Overview
- 1.1 Laboratory Robotics Product Overview
- 1.2 Laboratory Robotics Market by Type
- 1.2.1 Biological Laboratory Robotics
- 1.2.2 Pharmaceutical Laboratory Robotics
- 1.3 Global Laboratory Robotics Market Size by Type
- 1.3.1 Global Laboratory Robotics Market Size Overview by Type (2018-2029)
- 1.3.2 Global Laboratory Robotics Historic Market Size Review by Type (2018-2023)
- 1.3.3 Global Laboratory Robotics Forecasted Market Size by Type (2024-2029)
- 1.4 Key Regions Market Size by Type
- 1.4.1 North America Laboratory Robotics Sales Breakdown by Type (2018-2023)
- 1.4.2 Europe Laboratory Robotics Sales Breakdown by Type (2018-2023)
- 1.4.3 Asia-Pacific Laboratory Robotics Sales Breakdown by Type (2018-2023)
- 1.4.4 Latin America Laboratory Robotics Sales Breakdown by Type (2018-2023)
- 1.4.5 Middle East and Africa Laboratory Robotics Sales Breakdown by Type (2018-2023)
2 Laboratory Robotics Market Competition by Company
- 2.1 Global Top Players by Laboratory Robotics Revenue (2020-2023)
- 2.2 Global Top Manufacturers Laboratory Robotics Manufacturing Base Distribution
- 2.3 Laboratory Robotics Market Competitive Situation and Trends
- 2.3.1 Laboratory Robotics Market Concentration Rate (2020-2023)
- 2.3.2 Global 3 and 6 Largest Manufacturers by Laboratory Robotics Revenue in 2022
- 2.4 Global Top Manufacturers by Company Type (Tier 1, Tier 2, and Tier 3) & (based on the Revenue in Laboratory Robotics as of 2022)
- 2.5 Mergers & Acquisitions, Expansion
3 Laboratory Robotics Status and Outlook by Region
- 3.1 Global Laboratory Robotics Market Size and CAGR by Region: 2018 VS 2022 VS 2029
- 3.2 Global Laboratory Robotics Historic Market Size by Region
- 3.2.1 Global Laboratory Robotics Sales in Volume by Region (2018-2023)
- 3.2.2 Global Laboratory Robotics Sales in Value by Region (2018-2023)
- 3.2.3 Global Laboratory Robotics Sales (Volume & Value), Price (2018-2023)
- 3.3 Global Laboratory Robotics Forecasted Market Size by Region
- 3.3.1 Global Laboratory Robotics Sales in Volume by Region (2024-2029)
- 3.3.2 Global Laboratory Robotics Sales in Value by Region (2024-2029)
- 3.3.3 Global Laboratory Robotics Sales (Volume & Value), Price (2024-2029)
4 Laboratory Robotics by Application
- 4.1 Laboratory Robotics Market by Application
- 4.1.1 Clinical Laboratories
- 4.1.2 Research Laboratories
- 4.2 Global Laboratory Robotics Market Size by Application
- 4.2.1 Global Laboratory Robotics Market Size Overview by Application (2018-2029)
- 4.2.2 Global Laboratory Robotics Historic Market Size Review by Application (2018-2023)
- 4.2.3 Global Laboratory Robotics Forecasted Market Size by Application (2024-2029)
- 4.3 Key Regions Market Size by Application
- 4.3.1 Europe Laboratory Robotics Sales Breakdown by Application (2018-2023)
- 4.3.2 Asia-Pacific Laboratory Robotics Sales Breakdown by Application (2018-2023)
- 4.3.3 Latin America Laboratory Robotics Sales Breakdown by Application (2018-2023)
- 4.3.4 Middle East and Africa Laboratory Robotics Sales Breakdown by Application (2018-2023)
5 North America Laboratory Robotics by Country
- 5.1 North America Laboratory Robotics Historic Market Size by Country
- 5.1.1 North America Laboratory Robotics Sales in Volume by Country (2018-2023)
- 5.1.2 North America Laboratory Robotics Sales in Value by Country (2018-2023)
- 5.2 North America Laboratory Robotics Forecasted Market Size by Country
- 5.2.1 North America Laboratory Robotics Sales in Volume by Country (2024-2029)
- 5.2.2 North America Laboratory Robotics Sales in Value by Country (2024-2029)
6 Europe Laboratory Robotics by Country
- 6.1 Europe Laboratory Robotics Historic Market Size by Country
- 6.1.1 Europe Laboratory Robotics Sales in Volume by Country (2018-2023)
- 6.1.2 Europe Laboratory Robotics Sales in Value by Country (2018-2023)
- 6.2 Europe Laboratory Robotics Forecasted Market Size by Country
- 6.2.1 Europe Laboratory Robotics Sales in Volume by Country (2024-2029)
- 6.2.2 Europe Laboratory Robotics Sales in Value by Country (2024-2029)
7 Asia-Pacific Laboratory Robotics by Region
- 7.1 Asia-Pacific Laboratory Robotics Historic Market Size by Region
- 7.1.1 Asia-Pacific Laboratory Robotics Sales in Volume by Region (2018-2023)
- 7.1.2 Asia-Pacific Laboratory Robotics Sales in Value by Region (2018-2023)
- 7.2 Asia-Pacific Laboratory Robotics Forecasted Market Size by Region
- 7.2.1 Asia-Pacific Laboratory Robotics Sales in Volume by Region (2024-2029)
- 7.2.2 Asia-Pacific Laboratory Robotics Sales in Value by Region (2024-2029)
8 Latin America Laboratory Robotics by Country
- 8.1 Latin America Laboratory Robotics Historic Market Size by Country
- 8.1.1 Latin America Laboratory Robotics Sales in Volume by Country (2018-2023)
- 8.1.2 Latin America Laboratory Robotics Sales in Value by Country (2018-2023)
- 8.2 Latin America Laboratory Robotics Forecasted Market Size by Country
- 8.2.1 Latin America Laboratory Robotics Sales in Volume by Country (2024-2029)
- 8.2.2 Latin America Laboratory Robotics Sales in Value by Country (2024-2029)
9 Middle East and Africa Laboratory Robotics by Country
- 9.1 Middle East and Africa Laboratory Robotics Historic Market Size by Country
- 9.1.1 Middle East and Africa Laboratory Robotics Sales in Volume by Country (2018-2023)
- 9.1.2 Middle East and Africa Laboratory Robotics Sales in Value by Country (2018-2023)
- 9.2 Middle East and Africa Laboratory Robotics Forecasted Market Size by Country
- 9.2.1 Middle East and Africa Laboratory Robotics Sales in Volume by Country (2024-2029)
- 9.2.2 Middle East and Africa Laboratory Robotics Sales in Value by Country (2024-2029)
10 Company Profiles
- 10.1 Beckman Coulter
- 10.1.1 Beckman Coulter Company Information
- 10.1.2 Beckman Coulter Introduction and Business Overview
- 10.1.3 Beckman Coulter Laboratory Robotics Revenue, Gross Margin and Global Market Share (2020-2023)
- 10.1.4 Beckman Coulter Laboratory Robotics Products Offered
- 10.2 Tecan Group
- 10.2.1 Tecan Group Company Information
- 10.2.2 Tecan Group Introduction and Business Overview
- 10.2.3 Tecan Group Laboratory Robotics Revenue, Gross Margin and Global Market Share (2020-2023)
- 10.2.4 Tecan Group Laboratory Robotics Products Offered
- 10.3 Yaskawa Electric
- 10.3.1 Yaskawa Electric Company Information
- 10.3.2 Yaskawa Electric Introduction and Business Overview
- 10.3.3 Yaskawa Electric Laboratory Robotics Revenue, Gross Margin and Global Market Share (2020-2023)
- 10.3.4 Yaskawa Electric Laboratory Robotics Products Offered
- 10.4 Thermo Fisher Scientific
- 10.4.1 Thermo Fisher Scientific Company Information
- 10.4.2 Thermo Fisher Scientific Introduction and Business Overview
- 10.4.3 Thermo Fisher Scientific Laboratory Robotics Revenue, Gross Margin and Global Market Share (2020-2023)
- 10.4.4 Thermo Fisher Scientific Laboratory Robotics Products Offered
- 10.5 Protedyne (LabCorp)
- 10.5.1 Protedyne (LabCorp) Company Information
- 10.5.2 Protedyne (LabCorp) Introduction and Business Overview
- 10.5.3 Protedyne (LabCorp) Laboratory Robotics Revenue, Gross Margin and Global Market Share (2020-2023)
- 10.5.4 Protedyne (LabCorp) Laboratory Robotics Products Offered
- 10.6 PerkinElmer
- 10.6.1 PerkinElmer Company Information
- 10.6.2 PerkinElmer Introduction and Business Overview
- 10.6.3 PerkinElmer Laboratory Robotics Revenue, Gross Margin and Global Market Share (2020-2023)
- 10.6.4 PerkinElmer Laboratory Robotics Products Offered
- 10.7 Universal Robots
- 10.7.1 Universal Robots Company Information
- 10.7.2 Universal Robots Introduction and Business Overview
- 10.7.3 Universal Robots Laboratory Robotics Revenue, Gross Margin and Global Market Share (2020-2023)
- 10.7.4 Universal Robots Laboratory Robotics Products Offered
- 10.8 Anton Paar
- 10.8.1 Anton Paar Company Information
- 10.8.2 Anton Paar Introduction and Business Overview
- 10.8.3 Anton Paar Laboratory Robotics Revenue, Gross Margin and Global Market Share (2020-2023)
- 10.8.4 Anton Paar Laboratory Robotics Products Offered
- 10.9 HighRes Biosolutions
- 10.9.1 HighRes Biosolutions Company Information
- 10.9.2 HighRes Biosolutions Introduction and Business Overview
- 10.9.3 HighRes Biosolutions Laboratory Robotics Revenue, Gross Margin and Global Market Share (2020-2023)
- 10.9.4 HighRes Biosolutions Laboratory Robotics Products Offered
- 10.10 Hamilton Company
- 10.10.1 Hamilton Company Company Information
- 10.10.2 Hamilton Company Introduction and Business Overview
- 10.10.3 Hamilton Company Laboratory Robotics Revenue, Gross Margin and Global Market Share (2020-2023)
- 10.10.4 Hamilton Company Laboratory Robotics Products Offered
- 10.11 Aurora Biomed
- 10.11.1 Aurora Biomed Company Information
- 10.11.2 Aurora Biomed Introduction and Business Overview
- 10.11.3 Aurora Biomed Laboratory Robotics Revenue, Gross Margin and Global Market Share (2020-2023)
- 10.11.4 Aurora Biomed Laboratory Robotics Products Offered
- 10.12 Labman
- 10.12.1 Labman Company Information
- 10.12.2 Labman Introduction and Business Overview
- 10.12.3 Labman Laboratory Robotics Revenue, Gross Margin and Global Market Share (2020-2023)
- 10.12.4 Labman Laboratory Robotics Products Offered
- 10.13 Hudson Robotics
- 10.13.1 Hudson Robotics Company Information
- 10.13.2 Hudson Robotics Introduction and Business Overview
- 10.13.3 Hudson Robotics Laboratory Robotics Revenue, Gross Margin and Global Market Share (2020-2023)
- 10.13.4 Hudson Robotics Laboratory Robotics Products Offered
- 10.14 ST Robotics
- 10.14.1 ST Robotics Company Information
- 10.14.2 ST Robotics Introduction and Business Overview
- 10.14.3 ST Robotics Laboratory Robotics Revenue, Gross Margin and Global Market Share (2020-2023)
- 10.14.4 ST Robotics Laboratory Robotics Products Offered
- 10.15 Chemspeed Technologies
- 10.15.1 Chemspeed Technologies Company Information
- 10.15.2 Chemspeed Technologies Introduction and Business Overview
- 10.15.3 Chemspeed Technologies Laboratory Robotics Revenue, Gross Margin and Global Market Share (2020-2023)
- 10.15.4 Chemspeed Technologies Laboratory Robotics Products Offered
- 10.16 AB Controls
- 10.16.1 AB Controls Company Information
- 10.16.2 AB Controls Introduction and Business Overview
- 10.16.3 AB Controls Laboratory Robotics Revenue, Gross Margin and Global Market Share (2020-2023)
- 10.16.4 AB Controls Laboratory Robotics Products Offered
- 10.17 Peak Analysis & Automation
- 10.17.1 Peak Analysis & Automation Company Information
- 10.17.2 Peak Analysis & Automation Introduction and Business Overview
- 10.17.3 Peak Analysis & Automation Laboratory Robotics Revenue, Gross Margin and Global Market Share (2020-2023)
- 10.17.4 Peak Analysis & Automation Laboratory Robotics Products Offered
11 Upstream, Opportunities, Challenges, Risks and Influences Factors Analysis
- 11.1 Laboratory Robotics Key Raw Materials
- 11.1.1 Key Raw Materials
- 11.1.2 Raw Materials Key Suppliers
- 11.2 Manufacturing Cost Structure
- 11.2.1 Raw Materials
- 11.2.2 Labor Cost
- 11.2.3 Manufacturing Expenses
- 11.3 Laboratory Robotics Industrial Chain Analysis
- 11.4 Laboratory Robotics Market Dynamics
- 11.4.1 Laboratory Robotics Industry Trends
- 11.4.2 Laboratory Robotics Market Drivers
- 11.4.3 Laboratory Robotics Market Challenges and Restraints
12 Marketing Strategy Analysis, Distributors
- 12.1 Sales Channel
- 12.2 Laboratory Robotics Distributors
- 12.3 Laboratory Robotics Downstream Customers
13 Research Findings and Conclusion
14 Appendix
- 14.1 Research Methodology
- 14.1.1 Methodology/Research Approach
- 14.1.2 Data Source
- 14.2 Author Details
- 14.3 Disclaimer