|
|
市場調査レポート
商品コード
1235094
ゴム用粘着付与樹脂の世界市場の分析 (2023年)Global Rubber Tackifier Resins Market Research Report 2023 |
||||||
|
|
|||||||
|
● お客様のご希望に応じて、既存データの加工や未掲載情報(例:国別セグメント)の追加などの対応が可能です。 詳細はお問い合わせください。 |
|||||||


| ゴム用粘着付与樹脂の世界市場の分析 (2023年) |
|
出版日: 2023年03月13日
発行: QYResearch
ページ情報: 英文 174 Pages
納期: 2~3営業日
|
- 全表示
- 概要
- 図表
- 目次
世界のゴム用粘着付与樹脂の市場規模は、2022年に12億3,453万米ドル、2029年には17億6,212万米ドルに達すると予測され、予測期間中 (2023年~2029年) に5.37%のCAGRで成長する見通しです。
北米のゴム用粘着付与樹脂の市場規模は、予測期間中 (2023年~2029年) に4.54%のCAGRで成長し、2023年の1億9,719万米ドルから、2029年には2億5,742万米ドルに達する、と予測されます。
アジア太平洋のゴム用粘着付与樹脂の市場規模は、予測期間中 (2023年~2029年) に5.87%のCAGRで成長し、2022年の7億8,979万米ドルから、2029年には11億1,198万米ドルに達する、と予測されます。
当レポートでは、世界のゴム用粘着付与樹脂 (タッキファイヤー) の市場について分析し、種類別・用途別・地域別 (国別) の市場動向の見通し (2018年~2029年)、主要企業のプロファイルなどについて調査しております。
目次
第1章 ゴム系粘着付与樹脂市場概要
第1章 ゴム用粘着付与樹脂:市場概要
- 製品の定義
- ゴム用粘着付与樹脂市場:種類別
- 市場規模・成長率の分析:種類別 (2022年・2029年)
- フェノール樹脂
- 炭化水素樹脂
- その他
- ゴム用粘着付与樹脂市場:用途別
- 市場規模・成長率の分析:用途別 (2022年・2029年)
- 自動車
- 医療
- 工業
- その他
- 世界市場の成長見通し
- 世界のゴム用粘着付与樹脂の生産額:推定・予測 (2018年~2029年)
- 世界のゴム用粘着付与樹脂の生産能力:推定・予測 (2018年~2029年)
- 世界のゴム用粘着付与樹脂の生産量:推定・予測 (2018年~2029年)
- 世界のゴム用粘着付与樹脂の平均市場価格:推定・予測 (2018年~2029年)
- 前提・制約条件
第2章 メーカー別の市場競争
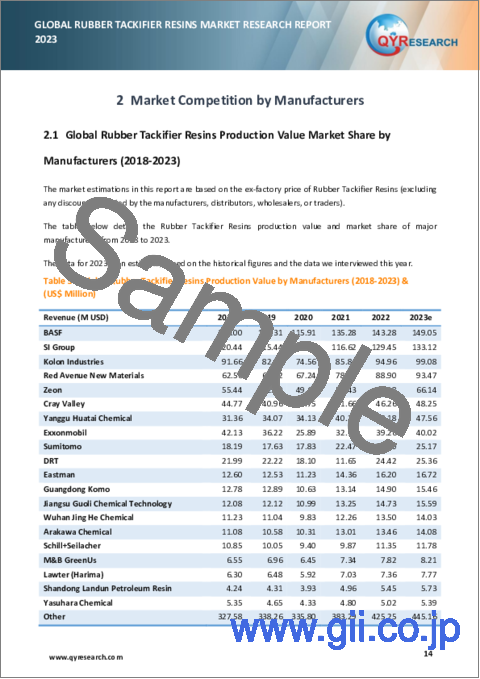
- 世界のゴム用粘着付与樹脂の生産額・市場シェア:メーカー別 (2018年~2023年)
- 世界のゴム用粘着付与樹脂の主要企業:業界ランキング (2021年・2022年)
- 市場シェア:企業の種類別(ティア1、ティア2、ティア3)
- 世界のゴム用粘着付与樹脂の平均価格:メーカー別 (2018年~2023年)
- ゴム用粘着付与樹脂の主要メーカー:製造拠点・本社
- ゴム用粘着付与樹脂の主要メーカー:主力製品とその用途
- ゴム用粘着付与樹脂の主要メーカー:設立時期
- 世界のゴム用粘着付与樹脂市場:競争状況と動向
- 企業合併・買収 (M&A)、拡大
第3章 ゴム用粘着付与樹脂の生産:地域別
- ゴム用粘着付与樹脂の生産額の推定・予測:地域別 (2018年・2022年・2029年)
- ゴム用粘着付与樹脂の生産額:地域別 (2018年~2029年)
- 生産額・市場シェア:地域別 (2018年~2023年)
- 生産額の予測:地域別 (2024年~2029年)
- ゴム用粘着付与樹脂の生産量の推定・予測:地域別 (2018年・2022年・2029年)
- ゴム用粘着付与樹脂の生産量:地域別 (2018年~2029年)
- 生産量・市場シェア:地域別 (2018年~2023年)
- 生産量の予測:地域別 (2024年~2029年)
- ゴム用粘着付与樹脂の市場価格の分析:地域別 (2018年~2023年)
- ゴム用粘着付与樹脂の生産量・生産額・対前年成長率 (YoY)
- 北米のゴム用粘着付与樹脂の生産額、推定・予測 (2018年~2029年)
- 欧州のゴム用粘着付与樹脂の生産額、推定・予測 (2018年~2029年)
- 中国のゴム用粘着付与樹脂の生産額、推定・予測 (2018年~2029年)
- 日本のゴム用粘着付与樹脂の生産額、推定・予測 (2018年~2029年)
第4章 ゴム用粘着付与樹脂:地域別の消費
- 世界のゴム用粘着付与樹脂の消費、推定・予測:地域別 (2018年・2022年・2029年)
- 世界のゴム用粘着付与樹脂の消費:地域別 (2018年~2029年)
- 消費:地域別 (2018年~2029年)
- 消費予測:地域別 (2024年~2029年)
- 北米
- 米国
- カナダ
- 欧州
- ドイツ
- フランス
- 英国
- イタリア
- ロシア
- アジア太平洋
- 中国
- 日本
- 韓国
- 東南アジア
- インド
- オーストラリア
- ラテンアメリカ
- メキシコ
- ブラジル
- アルゼンチン
- コロンビア
- 中東・アフリカ
- サウジアラビア
- アラブ首長国連邦
- トルコ
第5章 種類別のセグメント
- ゴム用粘着付与樹脂の生産量:種類別 (2018年~2029年)
- ゴム用粘着付与樹脂の生産額:種類別 (2018年~2029年)
- ゴム用粘着付与樹脂の価格:種類別 (2018年~2029年)
第6章 用途別のセグメント
- ゴム用粘着付与樹脂の生産量:用途別 (2018年~2029年)
- ゴム用粘着付与樹脂の生産額:用途別 (2018年~2029年)
- ゴム用粘着付与樹脂の価格:用途別 (2018年~2029年)
第7章 主要企業のプロファイル
- BASF
- 企業情報
- 製品ポートフォリオ
- 生産量・生産額・価格・粗利益 (2018年~2023年)
- 主力事業・市場
- 近年の動向
- SI Group
- Kolon Industries
- Red Avenue New Materials
- Zeon
- Cray Valley
- Yanggu Huatai Chemical
- Exxonmobil
- Sumitomo
- DRT
- Eastman
- Guangdong Komo
- Jiangsu Guoli Chemical Technology
- Wuhan Jing He Chemical
- Arakawa Chemical
- Schill+Seilacher
- M&B GreenUs
- Lawter (Harima)
- Shandong Landun Petroleum Resin
- Yasuhara Chemical
第8章 産業チェーンと販売チャネルの分析
- ゴム用粘着付与樹脂の産業チェーンの分析
- ゴム用粘着付与樹脂の主要原材料
- ゴム用粘着付与樹脂の製造モードとプロセス
- ゴム用粘着付与樹脂の流通業者
- ゴム用粘着付与樹脂の顧客
第9章 ゴム用粘着付与樹脂の市場力学
- ゴム用粘着付与樹脂業界の動向
- ゴム用粘着付与樹脂市場の促進要因
- ゴム用粘着付与樹脂市場の課題
- ゴム用粘着付与樹脂市場の抑制要因
第10章 調査結果と結論
第11章 調査手法とデータソース
List of Tables
- Table 1. Global Rubber Tackifier Resins Market Value by Type, (US$ Million) & (2022 VS 2029)
- Table 2. Global Rubber Tackifier Resins Market Value by Application, (US$ Million) & (2022 VS 2029)
- Table 3. Global Rubber Tackifier Resins Production Value by Manufacturers (2018-2023) & (US$ Million)
- Table 4. Global Rubber Tackifier Resins Production Value Share by Manufacturers (2018-2023)
- Table 5. Global Key Players of Rubber Tackifier Resins, Industry Ranking, 2021 VS 2022
- Table 6. Company Type (Tier 1, Tier 2, and Tier 3) & (based on the Production Value in Rubber Tackifier Resins as of 2022)
- Table 7. Global Market Rubber Tackifier Resins Average Price by Manufacturers (US$/Ton) & (2018-2023)
- Table 8. Global Key Manufacturers of Rubber Tackifier Resins, Manufacturing Base Distribution and Headquarters
- Table 9. Global Key Manufacturers of Rubber Tackifier Resins, Product Offered and Application
- Table 10. Global Key Manufacturers Established date of Rubber Tackifier Resins
- Table 11. Global Rubber Tackifier Resins Manufacturers Market Concentration Ratio (CR5)
- Table 12. Mergers & Acquisitions, Expansion Plans
- Table 13. Global Rubber Tackifier Resins Production Value by Region: 2018 VS 2022 VS 2029 (US$ Million)
- Table 14. Global Rubber Tackifier Resins Production Value (US$ Million) by Region (2018-2023)
- Table 15. Global Rubber Tackifier Resins Production Value Market Share by Region (2018-2023)
- Table 16. Global Rubber Tackifier Resins Production Value (US$ Million) Forecast by Region (2024-2029)
- Table 17. Global Rubber Tackifier Resins Production Value Market Share Forecast by Region (2024-2029)
- Table 18. Global Rubber Tackifier Resins Production Comparison by Region: 2018 VS 2022 VS 2029 (K Tons)
- Table 19. Global Rubber Tackifier Resins Production (K Tons) by Region (2018-2023)
- Table 20. Global Rubber Tackifier Resins Production Market Share by Region (2018-2023)
- Table 21. Global Rubber Tackifier Resins Production (K Tons) Forecast by Region (2024-2029)
- Table 22. Global Rubber Tackifier Resins Production Market Share Forecast by Region (2024-2029)
- Table 23. Global Rubber Tackifier Resins Market Average Price (US$/Ton) by Region (2018-2023)
- Table 24. Global Rubber Tackifier Resins Market Average Price (US$/Ton) by Region (2024-202*)
- Table 25. Global Rubber Tackifier Resins Consumption Growth Rate by Region: 2018 VS 2022 VS 2029 (K Tons)
- Table 26. Global Rubber Tackifier Resins Consumption by Region (2018-2023) & (K Tons)
- Table 27. Global Rubber Tackifier Resins Consumption Market Share by Region (2018-2023)
- Table 28. Global Rubber Tackifier Resins Forecasted Consumption by Region (2024-2029) & (K Tons)
- Table 29. Global Rubber Tackifier Resins Forecasted Consumption Market Share by Region (2018-2023)
- Table 30. North America Rubber Tackifier Resins Consumption Growth Rate by Country: 2018 VS 2022 VS 2029 (K Tons)
- Table 31. North America Rubber Tackifier Resins Consumption by Country (2018-2023) & (K Tons)
- Table 32. North America Rubber Tackifier Resins Consumption by Country (2024-2029) & (K Tons)
- Table 33. Europe Rubber Tackifier Resins Consumption Growth Rate by Country: 2018 VS 2022 VS 2029 (K Tons)
- Table 34. Europe Rubber Tackifier Resins Consumption by Country (2018-2023) & (K Tons)
- Table 35. Europe Rubber Tackifier Resins Consumption by Country (2024-2029) & (K Tons)
- Table 36. Asia Pacific Rubber Tackifier Resins Consumption Growth Rate by Country: 2018 VS 2022 VS 2029 (K Tons)
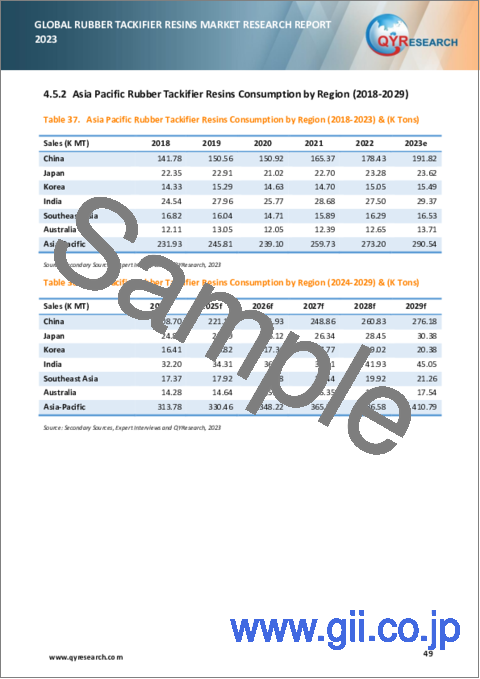
- Table 37. Asia Pacific Rubber Tackifier Resins Consumption by Region (2018-2023) & (K Tons)
- Table 38. Asia Pacific Rubber Tackifier Resins Consumption by Region (2024-2029) & (K Tons)
- Table 39. Latin America Rubber Tackifier Resins Consumption Growth Rate by Country: 2018 VS 2022 VS 2029 (K Tons)
- Table 40. Latin America Rubber Tackifier Resins Consumption by Country (2018-2023) & (K Tons)
- Table 41. Latin America Rubber Tackifier Resins Consumption by Country (2024-2029) & (K Tons)
- Table 42. Middle East & Africa Rubber Tackifier Resins Consumption Growth Rate by Country: 2018 VS 2022 VS 2029 (K Tons)
- Table 43. Middle East & Africa Rubber Tackifier Resins Consumption by Country (2018-2023) & (K Tons)
- Table 44. Middle East & Africa Rubber Tackifier Resins Consumption by Country (2024-2029) & (K Tons)
- Table 45. Global Rubber Tackifier Resins Production (K Tons) by Type (2018-2023)
- Table 46. Global Rubber Tackifier Resins Production (K Tons) by Type (2024-2029)
- Table 47. Global Rubber Tackifier Resins Production Market Share by Type (2018-2023)
- Table 48. Global Rubber Tackifier Resins Production Market Share by Type (2024-2029)
- Table 49. Global Rubber Tackifier Resins Production Value (US$ Million) by Type (2018-2023)
- Table 50. Global Rubber Tackifier Resins Production Value (US$ Million) by Type (2024-2029)
- Table 51. Global Rubber Tackifier Resins Production Value Market Share by Type (2018-2023)
- Table 52. Global Rubber Tackifier Resins Production Value Market Share by Type (2024-2029)
- Table 53. Global Rubber Tackifier Resins Price (US$/Ton) by Type (2018-2023)
- Table 54. Global Rubber Tackifier Resins Price (US$/Ton) by Type (2024-2029)
- Table 55. Global Rubber Tackifier Resins Production (K Tons) by Application (2018-2023)
- Table 56. Global Rubber Tackifier Resins Production (K Tons) by Application (2024-2029)
- Table 57. Global Rubber Tackifier Resins Production Market Share by Application (2018-2023)
- Table 58. Global Rubber Tackifier Resins Production Market Share by Application (2024-2029)
- Table 59. Global Rubber Tackifier Resins Production Value (US$ Million) by Application (2018-2023)
- Table 60. Global Rubber Tackifier Resins Production Value (US$ Million) by Application (2024-2029)
- Table 61. Global Rubber Tackifier Resins Production Value Market Share by Application (2018-2023)
- Table 62. Global Rubber Tackifier Resins Production Value Market Share by Application (2024-2029)
- Table 63. Global Rubber Tackifier Resins Price (US$/Ton) by Application (2018-2023)
- Table 64. Global Rubber Tackifier Resins Price (US$/Ton) by Application (2024-2029)
- Table 80. Red Avenue New Materials Rubber Tackifier Resins Company Information
- Table 81. Red Avenue New Materials Rubber Tackifier Resins Specification and Application
- Table 82. Red Avenue New Materials Rubber Tackifier Resins Production (K Tons), Value (US$ Million), Price (US$/Ton) and Gross Margin (2018-2023)
- Table 83. Red Avenue New Materials Main Business and Markets Served
- Table 84. Red Avenue New Materials Recent Developments/Updates
- Table 90. Cray Valley Rubber Tackifier Resins Company Information
- Table 91. Cray Valley Rubber Tackifier Resins Specification and Application
- Table 92. Cray Valley Rubber Tackifier Resins Production (K Tons), Value (US$ Million), Price (US$/Ton) and Gross Margin (2018-2023)
- Table 93. Cray Valley Main Business and Markets Served
- Table 94. Cray Valley Recent Developments/Updates
- Table 95. Yanggu Huatai Chemical Rubber Tackifier Resins Company Information
- Table 96. Yanggu Huatai Chemical Rubber Tackifier Resins Specification and Application
- Table 97. Yanggu Huatai Chemical Rubber Tackifier Resins Production (K Tons), Value (US$ Million), Price (US$/Ton) and Gross Margin (2018-2023)
- Table 98. Yanggu Huatai Chemical Main Business and Markets Served
- Table 114. Guangdong Komo Rubber Tackifier Resins Company Information
- Table 115. Guangdong Komo Rubber Tackifier Resins Specification and Application
- Table 116. Guangdong Komo Rubber Tackifier Resins Production (K Tons), Value (US$ Million), Price (US$/Ton) and Gross Margin (2018-2023)
- Table 117. Guangdong Komo Main Business and Markets Served
- Table 118. Jiangsu Guoli Chemical Technology Rubber Tackifier Resins Company Information
- Table 119. Jiangsu Guoli Chemical Technology Rubber Tackifier Resins Specification and Application
- Table 120. Jiangsu Guoli Chemical Technology Rubber Tackifier Resins Production (K Tons), Value (US$ Million), Price (US$/Ton) and Gross Margin (2018-2023)
- Table 121. Jiangsu Guoli Chemical Technology Main Business and Markets Served
- Table 122. Jiangsu Guoli Chemical Technology Recent Developments/Updates
- Table 127. M&B GreenUs Rubber Tackifier Resins Company Information
- Table 128. M&B GreenUs Rubber Tackifier Resins Specification and Application
- Table 129. M&B GreenUs Rubber Tackifier Resins Production (K Tons), Value (US$ Million), Price (US$/Ton) and Gross Margin (2018-2023)
- Table 130. M&B GreenUs Main Business and Markets Served
- Table 131. Shandong Landun Petroleum Resin Rubber Tackifier Resins Company Information
- Table 132. Shandong Landun Petroleum Resin Rubber Tackifier Resins Specification and Application
- Table 133. Shandong Landun Petroleum Resin Rubber Tackifier Resins Production (K Tons), Value (US$ Million), Price (US$/Ton) and Gross Margin (2018-2023)
- Table 134. Shandong Landun Petroleum Resin Main Business and Markets Served
- Table 135. Raw Materials Key Suppliers Lists
- Table 136. Rubber Tackifier Resins Distributors List
- Table 137. Rubber Tackifier Resins Customers List
- Table 138. Rubber Tackifier Resins Market Trends
- Table 139. Rubber Tackifier Resins Market Drivers
- Table 140. Rubber Tackifier Resins Market Challenges
- Table 141. Rubber Tackifier Resins Market Restraints
- Table 142. Research Programs/Design for This Report
- Table 143. Key Data Information from Secondary Sources
- Table 144. Key Data Information from Primary Sources
- Table 145. Authors List of This Report
- Table 146. QYR Business Unit and Senior & Team Lead Analysts
List of Figures
- Figure 1. Product Picture of Rubber Tackifier Resins
- Figure 2. Global Rubber Tackifier Resins Market Value by Type, (US$ Million) & (2018-2029)
- Figure 3. Global Rubber Tackifier Resins Market Share by Type: 2022 VS 2029
- Figure 4. Phenolic Resin Product Picture
- Figure 5. Hydrocarbon Resins Product Picture
- Figure 6. Others Product Picture
- Figure 7. Global Rubber Tackifier Resins Market Value by Application, (US$ Million) & (2022 VS 2029)
- Figure 8. Global Rubber Tackifier Resins Market Share by Application: 2022 VS 2029
- Figure 9. Automotive
- Figure 10. Medical
- Figure 11. Industry
- Figure 12. Others
- Figure 13. Global Rubber Tackifier Resins Production Value (US$ Million), 2018 VS 2022 VS 2029
- Figure 14. Global Rubber Tackifier Resins Production Value (US$ Million) & (2018-2029)
- Figure 15. Global Rubber Tackifier Resins Production (K Tons) & (2018-2029)
- Figure 16. Global Rubber Tackifier Resins Average Price (US$/Ton) & (2018-2029)
- Figure 17. Rubber Tackifier Resins Report Years Considered
- Figure 18. The Global 5 Largest Players: Market Share by Rubber Tackifier Resins Revenue in 2022
- Figure 19. Global Rubber Tackifier Resins Production Value by Region: (2018-2029) (US$ Million)
- Figure 20. Global Rubber Tackifier Resins Production Value Market Share by Region: (2018-2029)
- Figure 21. Global Rubber Tackifier Resins Production Comparison by Region: (2018-2029) (K Tons)
- Figure 22. Global Rubber Tackifier Resins Production Market Share by Region: 2018 VS 2022 VS 2029
- Figure 23. North America Rubber Tackifier Resins Production Value (US$ Million) Growth Rate (2018-2029)
- Figure 24. Europe Rubber Tackifier Resins Production Value (US$ Million) Growth Rate (2018-2029)
- Figure 25. China Rubber Tackifier Resins Production Value (US$ Million) Growth Rate (2018-2029)
- Figure 26. Japan Rubber Tackifier Resins Production Value (US$ Million) Growth Rate (2018-2029)
- Figure 27. Global Rubber Tackifier Resins Consumption by Region: (2018 -2029) (K Tons)
- Figure 28. Global Rubber Tackifier Resins Consumption Market Share by Region: (2018-2029)
- Figure 29. North America Rubber Tackifier Resins Consumption and Growth Rate (2018-2029) & (K Tons)
- Figure 30. North America Rubber Tackifier Resins Consumption Market Share by Country (2018-2029)
- Figure 31. U.S. Rubber Tackifier Resins Consumption and Growth Rate (2018-2029) & (K Tons)
- Figure 32. Canada Rubber Tackifier Resins Consumption and Growth Rate (2018-2029) & (K Tons)
- Figure 33. Europe Rubber Tackifier Resins Consumption and Growth Rate (2018-2029) & (K Tons)
- Figure 34. Europe Rubber Tackifier Resins Consumption Market Share by Country (2018-2029)
- Figure 35. Germany Rubber Tackifier Resins Consumption and Growth Rate (2018-2029) & (K Tons)
- Figure 36. France Rubber Tackifier Resins Consumption and Growth Rate (2018-2029) & (K Tons)
- Figure 37. U.K. Rubber Tackifier Resins Consumption and Growth Rate (2018-2029) & (K Tons)
- Figure 38. Italy Rubber Tackifier Resins Consumption and Growth Rate (2018-2029) & (K Tons)
- Figure 39. Russia Rubber Tackifier Resins Consumption and Growth Rate (2018-2029) & (K Tons)
- Figure 40. Asia Pacific Rubber Tackifier Resins Consumption and Growth Rate (2018-2029) & (K Tons)
- Figure 41. Asia Pacific Rubber Tackifier Resins Consumption Market Share by Region (2024-2029)
- Figure 42. China Rubber Tackifier Resins Consumption and Growth Rate (2018-2029) & (K Tons)
- Figure 43. Japan Rubber Tackifier Resins Consumption and Growth Rate (2018-2029) & (K Tons)
- Figure 44. South Korea Rubber Tackifier Resins Consumption and Growth Rate (2018-2029) & (K Tons)
- Figure 45. Southeast Asia Rubber Tackifier Resins Consumption and Growth Rate (2018-2029) & (K Tons)
- Figure 46. India Rubber Tackifier Resins Consumption and Growth Rate (2018-2029) & (K Tons)
- Figure 47. Australia Rubber Tackifier Resins Consumption and Growth Rate (2018-2029) & (K Tons)
- Figure 48. Latin America Rubber Tackifier Resins Consumption and Growth Rate (2018-2029) & (K Tons)
- Figure 49. Latin America Rubber Tackifier Resins Consumption Market Share by Country (2018-2029)
- Figure 50. Mexico Rubber Tackifier Resins Consumption and Growth Rate (2018-2029) & (K Tons)
- Figure 51. Brazil Rubber Tackifier Resins Consumption and Growth Rate (2018-2029) & (K Tons)
- Figure 52. Argentina Rubber Tackifier Resins Consumption and Growth Rate (2018-2029) & (K Tons)
- Figure 53. Colombia Rubber Tackifier Resins Consumption and Growth Rate (2018-2029) & (K Tons)
- Figure 54. Middle East & Africa Rubber Tackifier Resins Consumption and Growth Rate (2018-2029) & (K Tons)
- Figure 55. Middle East & Africa Rubber Tackifier Resins Consumption Market Share by Country (2018-2029)
- Figure 56. Saudi Arabia Rubber Tackifier Resins Consumption and Growth Rate (2018-2029) & (K Tons)
- Figure 57. UAE Rubber Tackifier Resins Consumption and Growth Rate (2018-2029) & (K Tons)
- Figure 58. Turkey Rubber Tackifier Resins Consumption and Growth Rate (2018-2029) & (K Tons)
- Figure 59. Global Production Market Share of Rubber Tackifier Resins by Type (2018-2029)
- Figure 60. Global Production Value Market Share of Rubber Tackifier Resins by Type (2018-2029)
- Figure 61. Global Rubber Tackifier Resins Price (US$/Ton) by Type (2018-2029)
- Figure 62. Global Production Market Share of Rubber Tackifier Resins by Application (2018-2029)
- Figure 63. Global Production Value Market Share of Rubber Tackifier Resins by Application (2018-2029)
- Figure 64. Global Rubber Tackifier Resins Price (US$/Ton) by Application (2018-2029)
- Figure 65. Rubber Tackifier Resins Value Chain
- Figure 66. Rubber Tackifier Resins Production Process
- Figure 67. Distributors Profiles
- Figure 68. Bottom-up and Top-down Approaches for This Report
- Figure 69. Data Triangulation
The global Rubber Tackifier Resins market was valued at US$ 1,234.53 million in 2022 and is anticipated to reach US$ 1,762.12 million by 2029, witnessing a CAGR of 5.37% during the forecast period 2023-2029. The influence of COVID-19 and the Russia-Ukraine War were considered while estimating market sizes.
North American market for Rubber Tackifier Resins is estimated to increase from $ 197.19 million in 2023 to reach $ 257.42 million by 2029, at a CAGR of 4.54% during the forecast period of 2023 through 2029.
Asia-Pacific market for Rubber Tackifier Resins is estimated to increase from $ 789.79 million in 2022 to reach $ 1,111.98 million by 2029, at a CAGR of 5.87% during the forecast period of 2023 through 2029.
The major global manufacturers of Rubber Tackifier Resins include: BASF, Exxonmobil, Zeon, SI Group, Kolon Industries, Schill+Seilacher, DRT, and Red Avenue New Materials, etc. In 2022, the world's top three vendors accounted for approximately 29.78 % of the revenue.
Report Scope
This report aims to provide a comprehensive presentation of the global market for Rubber Tackifier Resins, with both quantitative and qualitative analysis, to help readers develop business/growth strategies, assess the market competitive situation, analyze their position in the current marketplace, and make informed business decisions regarding Rubber Tackifier Resins.
The Rubber Tackifier Resins market size, estimations, and forecasts are provided in terms of output/shipments (K Tons) and revenue ($ millions), considering 2022 as the base year, with history and forecast data for the period from 2018 to 2029. This report segments the global Rubber Tackifier Resins market comprehensively. Regional market sizes, concerning products by Type, by Application, and by players, are also provided.
For a more in-depth understanding of the market, the report provides profiles of the competitive landscape, key competitors, and their respective market ranks. The report also discusses technological trends and new product developments.
The report will help the Rubber Tackifier Resins manufacturers, new entrants, and industry chain related companies in this market with information on the revenues, production, and average price for the overall market and the sub-segments across the different segments, by company, by Type, by Application, and by regions.
By Company
- BASF
- SI Group
- Kolon Industries
- Red Avenue New Materials
- Zeon
- Cray Valley
- Yanggu Huatai Chemical
- Exxonmobil
- Sumitomo
- DRT
- Eastman
- Guangdong Komo
- Jiangsu Guoli Chemical Technology
- Wuhan Jing He Chemical
- Arakawa Chemical
- Schill+Seilacher
- M&B GreenUs
- Lawter (Harima)
- Shandong Landun Petroleum Resin
- Yasuhara Chemical
Segment by Type
- Phenolic Resin
- Hydrocarbon Resins
- Others
Segment by Application
- Automotive
- Medical
- Industry
- Others
Production by Region
- North America
- Europe
- China
- Japan
Consumption by Region
- North America
- U.S.
- Canada
- Asia-Pacific
- China
- Japan
- South Korea
- Southeast Asia
- India
- Australia
- Europe
- Germany
- France
- U.K.
- Italy
- Russia
- Rest of Europe
- Latin America
- Brazil
- Mexico
- Argentina
- Colombia
- Rest of Latin America
- Middle East and Africa
- Saudi Arabia
- UAE
- Turkey
- Rest of Middle East and Africa
Core Chapters
- Chapter 1: Introduces the report scope of the report, executive summary of different market segments (by region, by Type, by Application, etc), including the market size of each market segment, future development potential, and so on. It offers a high-level view of the current state of the market and its likely evolution in the short to mid-term, and long term.
- Chapter 2: Detailed analysis of Rubber Tackifier Resins manufacturers competitive landscape, price, production and value market share, latest development plan, merger, and acquisition information, etc.
- Chapter 3: Production/output, value of Rubber Tackifier Resins by region/country. It provides a quantitative analysis of the market size and development potential of each region in the next six years.
- Chapter 4: Consumption of Rubber Tackifier Resins in regional level and country level. It provides a quantitative analysis of the market size and development potential of each region and its main countries and introduces the market development, future development prospects, market space, and production of each country in the world.
- Chapter 5: Provides the analysis of various market segments by Type, covering the market size and development potential of each market segment, to help readers find the blue ocean market in different market segments.
- Chapter 6: Provides the analysis of various market segments by Application, covering the market size and development potential of each market segment, to help readers find the blue ocean market in different downstream markets.
- Chapter 7: Provides profiles of key players, introducing the basic situation of the main companies in the market in detail, including product production/output, value, price, gross margin, product introduction, recent development, etc.
- Chapter 8: Analysis of industrial chain, including the upstream and downstream of the industry.
- Chapter 9: Introduces the market dynamics, latest developments of the market, the driving factors and restrictive factors of the market, the challenges and risks faced by manufacturers in the industry, and the analysis of relevant policies in the industry.
- Chapter 10: The main points and conclusions of the report.
Table of Contents
1 Rubber Tackifier Resins Market Overview
- 1.1 Product Definition
- 1.2 Rubber Tackifier Resins by Type
- 1.2.1 Global Rubber Tackifier Resins Market Value Growth Rate Analysis by Type: 2022 VS 2029
- 1.2.2 Phenolic Resin
- 1.2.3 Hydrocarbon Resins
- 1.2.4 Others
- 1.3 Rubber Tackifier Resins by Application
- 1.3.1 Global Rubber Tackifier Resins Market Value Growth Rate Analysis by Application: 2022 VS 2029
- 1.3.2 Automotive
- 1.3.3 Medical
- 1.3.4 Industry
- 1.3.5 Others
- 1.4 Global Market Growth Prospects
- 1.4.1 Global Rubber Tackifier Resins Production Value Estimates and Forecasts (2018-2029)
- 1.4.2 Global Rubber Tackifier Resins Production Estimates and Forecasts (2018-2029)
- 1.4.3 Global Rubber Tackifier Resins Market Average Price Estimates and Forecasts (2018-2029)
- 1.5 Assumptions and Limitations
2 Market Competition by Manufacturers
- 2.1 Global Rubber Tackifier Resins Production Value Market Share by Manufacturers (2018-2023)
- 2.2 Global Key Players of Rubber Tackifier Resins, Industry Ranking, 2021 VS 2022
- 2.3 Global Rubber Tackifier Resins Market Share by Company Type (Tier 1, Tier 2, and Tier 3)
- 2.4 Global Rubber Tackifier Resins Average Price by Manufacturers (2018-2023)
- 2.5 Global Key Manufacturers of Rubber Tackifier Resins, Manufacturing Base Distribution and Headquarters
- 2.6 Global Key Manufacturers of Rubber Tackifier Resins, Product Offered and Application
- 2.7 Global Key Manufacturers Established Date of Rubber Tackifier Resins
- 2.8 Rubber Tackifier Resins Market Competitive Situation and Trends
- 2.8.1 Rubber Tackifier Resins Market Concentration Rate
- 2.8.2 Global 5 Largest Rubber Tackifier Resins Players Market Share by Revenue
- 2.9 Mergers & Acquisitions, Expansion
3 Rubber Tackifier Resins Production by Region
- 3.1 Global Rubber Tackifier Resins Production Value Estimates and Forecasts by Region: 2018 VS 2022 VS 2029
- 3.2 Global Rubber Tackifier Resins Production Value by Region (2018-2029)
- 3.2.1 Global Rubber Tackifier Resins Production Value Market Share by Region (2018-2023)
- 3.2.2 Global Forecasted Production Value of Rubber Tackifier Resins by Region (2024-2029)
- 3.3 Global Rubber Tackifier Resins Production Estimates and Forecasts by Region: 2018 VS 2022 VS 2029
- 3.4 Global Rubber Tackifier Resins Production by Region (2018-2029)
- 3.4.1 Global Rubber Tackifier Resins Production Market Share by Region (2018-2023)
- 3.4.2 Global Forecasted Production of Rubber Tackifier Resins by Region (2024-2029)
- 3.5 Global Rubber Tackifier Resins Market Price Analysis by Region (2018-2023)
- 3.6 Global Rubber Tackifier Resins Production and Value, Year-over-Year Growth
- 3.6.1 North America Rubber Tackifier Resins Production Value Estimates and Forecasts (2018-2029)
- 3.6.2 Europe Rubber Tackifier Resins Production Value Estimates and Forecasts (2018-2029)
- 3.6.3 China Rubber Tackifier Resins Production Value Estimates and Forecasts (2018-2029)
- 3.6.4 Japan Rubber Tackifier Resins Production Value Estimates and Forecasts (2018-2029)
4 Rubber Tackifier Resins Consumption by Region
- 4.1 Global Rubber Tackifier Resins Consumption Estimates and Forecasts by Region: 2018 VS 2022 VS 2029
- 4.2 Global Rubber Tackifier Resins Consumption by Region (2018-2029)
- 4.2.1 Global Rubber Tackifier Resins Consumption by Region (2018-2029)
- 4.2.2 Global Rubber Tackifier Resins Forecasted Consumption by Region (2024-2029)
- 4.3 North America
- 4.3.1 North America Rubber Tackifier Resins Consumption Growth Rate by Country: 2018 VS 2022 VS 2029
- 4.3.2 North America Rubber Tackifier Resins Consumption by Country (2018-2029)
- 4.3.3 U.S.
- 4.3.4 Canada
- 4.4 Europe
- 4.4.1 Europe Rubber Tackifier Resins Consumption Growth Rate by Country: 2018 VS 2022 VS 2029
- 4.4.2 Europe Rubber Tackifier Resins Consumption by Country (2018-2029)
- 4.4.3 Germany
- 4.4.4 France
- 4.4.5 U.K.
- 4.4.6 Italy
- 4.4.7 Russia
- 4.5 Asia Pacific
- 4.5.1 Asia Pacific Rubber Tackifier Resins Consumption Growth Rate by Country: 2018 VS 2022 VS 2029
- 4.5.2 Asia Pacific Rubber Tackifier Resins Consumption by Region (2018-2029)
- 4.5.3 China
- 4.5.4 Japan
- 4.5.5 South Korea
- 4.5.6 Southeast Asia
- 4.5.7 India
- 4.5.8 Australia
- 4.6 Latin America
- 4.6.1 Latin America Rubber Tackifier Resins Consumption Growth Rate by Country: 2018 VS 2022 VS 2029
- 4.6.2 Latin America Rubber Tackifier Resins Consumption by Country (2018-2029)
- 4.6.3 Mexico
- 4.6.4 Brazil
- 4.6.5 Argentina
- 4.6.6 Colombia
- 4.7 Middle East & Africa
- 4.7.1 Middle East & Africa Rubber Tackifier Resins Consumption Growth Rate by Country: 2018 VS 2022 VS 2029
- 4.7.2 Middle East & Africa Rubber Tackifier Resins Consumption by Country (2018-2029)
- 4.7.3 Saudi Arabia
- 4.7.4 UAE
- 4.7.5 Turkey
5 Segment by Type
- 5.1 Global Rubber Tackifier Resins Production by Type (2018-2029)
- 5.1.1 Global Rubber Tackifier Resins Production by Type (2018-2023)
- 5.1.2 Global Rubber Tackifier Resins Production by Type (2024-2029)
- 5.1.3 Global Rubber Tackifier Resins Production Market Share by Type (2018-2029)
- 5.2 Global Rubber Tackifier Resins Production Value by Type (2018-2029)
- 5.2.1 Global Rubber Tackifier Resins Production Value by Type (2018-2023)
- 5.2.2 Global Rubber Tackifier Resins Production Value by Type (2024-2029)
- 5.2.3 Global Rubber Tackifier Resins Production Value Market Share by Type (2018-2029)
- 5.3 Global Rubber Tackifier Resins Price by Type (2018-2029)
6 Segment by Application
- 6.1 Global Rubber Tackifier Resins Production by Application (2018-2029)
- 6.1.1 Global Rubber Tackifier Resins Production by Application (2018-2023)
- 6.1.2 Global Rubber Tackifier Resins Production by Application (2024-2029)
- 6.1.3 Global Rubber Tackifier Resins Production Market Share by Application (2018-2029)
- 6.2 Global Rubber Tackifier Resins Production Value by Application (2018-2029)
- 6.2.1 Global Rubber Tackifier Resins Production Value by Application (2018-2023)
- 6.2.2 Global Rubber Tackifier Resins Production Value by Application (2024-2029)
- 6.2.3 Global Rubber Tackifier Resins Production Value Market Share by Application (2018-2029)
- 6.3 Global Rubber Tackifier Resins Price by Application (2018-2029)
7 Key Companies Profiled
- 7.1 BASF
- 7.1.1 BASF Rubber Tackifier Resins Company Information
- 7.1.2 BASF Rubber Tackifier Resins Product Portfolio
- 7.1.3 BASF Rubber Tackifier Resins Production, Value, Price and Gross Margin (2018-2023)
- 7.1.4 BASF Main Business and Markets Served
- 7.1.5 BASF Recent Developments/Updates
- 7.2 SI Group
- 7.2.1 SI Group Rubber Tackifier Resins Company Information
- 7.2.2 SI Group Rubber Tackifier Resins Product Portfolio
- 7.2.3 SI Group Rubber Tackifier Resins Production, Value, Price and Gross Margin (2018-2023)
- 7.2.4 SI Group Main Business and Markets Served
- 7.2.5 SI Group Recent Developments/Updates
- 7.3 Kolon Industries
- 7.3.1 Kolon Industries Rubber Tackifier Resins Company Information
- 7.3.2 Kolon Industries Rubber Tackifier Resins Product Portfolio
- 7.3.3 Kolon Industries Rubber Tackifier Resins Production, Value, Price and Gross Margin (2018-2023)
- 7.3.4 Kolon Industries Main Business and Markets Served
- 7.3.5 Kolon Industries Recent Developments/Updates
- 7.4 Red Avenue New Materials
- 7.4.1 Red Avenue New Materials Rubber Tackifier Resins Company Information
- 7.4.2 Red Avenue New Materials Rubber Tackifier Resins Product Portfolio
- 7.4.3 Red Avenue New Materials Rubber Tackifier Resins Production, Value, Price and Gross Margin (2018-2023)
- 7.4.4 Red Avenue New Materials Main Business and Markets Served
- 7.4.5 Red Avenue New Materials Recent Developments/Updates
- 7.5 Zeon
- 7.5.1 Zeon Rubber Tackifier Resins Company Information
- 7.5.2 Zeon Rubber Tackifier Resins Product Portfolio
- 7.5.3 Zeon Rubber Tackifier Resins Production, Value, Price and Gross Margin (2018-2023)
- 7.5.4 Zeon Main Business and Markets Served
- 7.5.5 Zeon Recent Developments/Updates
- 7.6 Cray Valley
- 7.6.1 Cray Valley Rubber Tackifier Resins Company Information
- 7.6.2 Cray Valley Rubber Tackifier Resins Product Portfolio
- 7.6.3 Cray Valley Rubber Tackifier Resins Production, Value, Price and Gross Margin (2018-2023)
- 7.6.4 Cray Valley Main Business and Markets Served
- 7.6.5 Cray Valley Recent Developments/Updates
- 7.7 Yanggu Huatai Chemical
- 7.7.1 Yanggu Huatai Chemical Rubber Tackifier Resins Company Information
- 7.7.2 Yanggu Huatai Chemical Rubber Tackifier Resins Product Portfolio
- 7.7.3 Yanggu Huatai Chemical Rubber Tackifier Resins Production, Value, Price and Gross Margin (2018-2023)
- 7.7.4 Yanggu Huatai Chemical Main Business and Markets Served
- 7.8 Exxonmobil
- 7.8.1 Exxonmobil Rubber Tackifier Resins Company Information
- 7.8.2 Exxonmobil Rubber Tackifier Resins Product Portfolio
- 7.8.3 Exxonmobil Rubber Tackifier Resins Production, Value, Price and Gross Margin (2018-2023)
- 7.8.4 Exxonmobil Main Business and Markets Served
- 7.8.5 Exxonmobil Recent Developments/Updates
- 7.9 Sumitomo
- 7.9.1 Sumitomo Rubber Tackifier Resins Company Information
- 7.9.2 Sumitomo Rubber Tackifier Resins Product Portfolio
- 7.9.3 Sumitomo Rubber Tackifier Resins Production, Value, Price and Gross Margin (2018-2023)
- 7.9.4 Sumitomo Main Business and Markets Served
- 7.9.5 Sumitomo Recent Developments/Updates
- 7.10 DRT
- 7.10.1 DRT Rubber Tackifier Resins Company Information
- 7.10.2 DRT Rubber Tackifier Resins Product Portfolio
- 7.10.3 DRT Rubber Tackifier Resins Production, Value, Price and Gross Margin (2018-2023)
- 7.10.4 DRT Main Business and Markets Served
- 7.10.5 DRT Recent Developments/Updates
- 7.11 Eastman
- 7.11.1 Eastman Rubber Tackifier Resins Company Information
- 7.11.2 Eastman Rubber Tackifier Resins Product Portfolio
- 7.11.3 Eastman Rubber Tackifier Resins Production, Value, Price and Gross Margin (2018-2023)
- 7.11.4 Eastman Main Business and Markets Served
- 7.11.5 Eastman Recent Developments/Updates
- 7.12 Guangdong Komo
- 7.12.1 Guangdong Komo Rubber Tackifier Resins Company Information
- 7.12.2 Guangdong Komo Rubber Tackifier Resins Product Portfolio
- 7.12.3 Guangdong Komo Rubber Tackifier Resins Production, Value, Price and Gross Margin (2018-2023)
- 7.12.4 Guangdong Komo Main Business and Markets Served
- 7.13 Jiangsu Guoli Chemical Technology
- 7.13.1 Jiangsu Guoli Chemical Technology Rubber Tackifier Resins Company Information
- 7.13.2 Jiangsu Guoli Chemical Technology Rubber Tackifier Resins Product Portfolio
- 7.13.3 Jiangsu Guoli Chemical Technology Rubber Tackifier Resins Production, Value, Price and Gross Margin (2018-2023)
- 7.13.4 Jiangsu Guoli Chemical Technology Main Business and Markets Served
- 7.13.5 Jiangsu Guoli Chemical Technology Recent Developments/Updates
- 7.14 Wuhan Jing He Chemical
- 7.14.1 Wuhan Jing He Chemical Rubber Tackifier Resins Company Information
- 7.14.2 Wuhan Jing He Chemical Rubber Tackifier Resins Product Portfolio
- 7.14.3 Wuhan Jing He Chemical Rubber Tackifier Resins Production, Value, Price and Gross Margin (2018-2023)
- 7.14.4 Wuhan Jing He Chemical Main Business and Markets Served
- 7.15 Arakawa Chemical
- 7.15.1 Arakawa Chemical Rubber Tackifier Resins Company Information
- 7.15.2 Arakawa Chemical Rubber Tackifier Resins Product Portfolio
- 7.15.3 Arakawa Chemical Rubber Tackifier Resins Production, Value, Price and Gross Margin (2018-2023)
- 7.15.4 Arakawa Chemical Main Business and Markets Served
- 7.15.5 Arakawa Chemical Recent Developments/Updates
- 7.16 Schill+Seilacher
- 7.16.1 Schill+Seilacher Rubber Tackifier Resins Company Information
- 7.16.2 Schill+Seilacher Rubber Tackifier Resins Product Portfolio
- 7.16.3 Schill+Seilacher Rubber Tackifier Resins Production, Value, Price and Gross Margin (2018-2023)
- 7.16.4 Schill+Seilacher Main Business and Markets Served
- 7.17 M&B GreenUs
- 7.17.1 M&B GreenUs Rubber Tackifier Resins Company Information
- 7.17.2 M&B GreenUs Rubber Tackifier Resins Product Portfolio
- 7.17.3 M&B GreenUs Rubber Tackifier Resins Production, Value, Price and Gross Margin (2018-2023)
- 7.17.4 M&B GreenUs Main Business and Markets Served
- 7.18 Lawter (Harima)
- 7.18.1 Lawter (Harima) Rubber Tackifier Resins Company Information
- 7.18.2 Lawter (Harima) Rubber Tackifier Resins Product Portfolio
- 7.18.3 Lawter (Harima) Rubber Tackifier Resins Production, Value, Price and Gross Margin (2018-2023)
- 7.18.4 Lawter (Harima) Main Business and Markets Served
- 7.18.5 Lawter (Harima) Recent Developments/Updates
- 7.19 Shandong Landun Petroleum Resin
- 7.19.1 Shandong Landun Petroleum Resin Rubber Tackifier Resins Company Information
- 7.19.2 Shandong Landun Petroleum Resin Rubber Tackifier Resins Product Portfolio
- 7.19.3 Shandong Landun Petroleum Resin Rubber Tackifier Resins Production, Value, Price and Gross Margin (2018-2023)
- 7.19.4 Shandong Landun Petroleum Resin Main Business and Markets Served
- 7.20 Yasuhara Chemical
- 7.20.1 Yasuhara Chemical Rubber Tackifier Resins Company Information
- 7.20.2 Yasuhara Chemical Rubber Tackifier Resins Product Portfolio
- 7.20.3 Yasuhara Chemical Rubber Tackifier Resins Production, Value, Price and Gross Margin (2018-2023)
- 7.20.4 Yasuhara Chemical Main Business and Markets Served
8 Industry Chain and Sales Channels Analysis
- 8.1 Rubber Tackifier Resins Industry Chain Analysis
- 8.2 Rubber Tackifier Resins Key Raw Materials
- 8.2.1 Key Raw Materials
- 8.2.2 Raw Materials Key Suppliers
- 8.3 Rubber Tackifier Resins Production Mode & Process
- 8.4 Rubber Tackifier Resins Distributors
- 8.5 Rubber Tackifier Resins Customers
9 Rubber Tackifier Resins Market Dynamics
- 9.1 Rubber Tackifier Resins Industry Trends
- 9.2 Rubber Tackifier Resins Market Drivers
- 9.3 Rubber Tackifier Resins Market Challenges
- 9.4 Rubber Tackifier Resins Market Restraints
10 Research Findings and Conclusion
11 Methodology and Data Source
- 11.1 Methodology/Research Approach
- 11.1.1 Research Programs/Design
- 11.1.2 Market Size Estimation
- 11.1.3 Market Breakdown and Data Triangulation
- 11.2 Data Source
- 11.2.1 Secondary Sources
- 11.2.2 Primary Sources
- 11.3 Author List
- 11.4 Disclaimer