|
|
市場調査レポート
商品コード
1231819
組換えタンパク質の世界市場:分析・実績・予測 (2018年~2029年)Global Recombinant Protein Market Report, History and Forecast 2018-2029 |
||||||
|
|
|||||||
|
● お客様のご希望に応じて、既存データの加工や未掲載情報(例:国別セグメント)の追加などの対応が可能です。 詳細はお問い合わせください。 |
|||||||


| 組換えタンパク質の世界市場:分析・実績・予測 (2018年~2029年) |
|
出版日: 2023年03月07日
発行: QYResearch
ページ情報: 英文 127 Pages
納期: 2~3営業日
|
- 全表示
- 概要
- 図表
- 目次
世界の組換えタンパク質の市場規模は、COVID-19パンデミックとロシア・ウクライナ戦争の影響により、2022年に9億7,577万米ドル、2029年までに23億2,021万米ドルの改訂規模に達すると予測されています。
また、予測期間中 (2023年~2029年) に13.02%のCAGRで成長する見通しです。
北米の組換えタンパク質の市場規模は、2022年に3億3,479万米ドルに達した後、予測期間中 (2023年~2029年) 11.75%のCAGRで成長し、2029年までに7億3,653万米ドルに達すると予測されています。
アジア太平洋の組換えタンパク質の市場規模は、2022年に3億6,289万米ドルに達した後、予測期間中 (2023年~2029年) 15.52%のCAGRで成長し、2029年までに10億1,082万米ドルに達すると予測されています。
欧州の組換えタンパク質の市場規模は、2022年に2億4,037万米ドルに達した後、予測期間中 (2023年~2029年) 11.15%のCAGRで成長し、2029年までに5億809万米ドルに達すると予想されます。
当レポートでは、世界の組換えタンパク質の市場について分析し、種類別・用途別・地域別 (国別) の市場動向の見通し (2018年~2029年)、主要企業のプロファイルなどについて調査しております。
目次
第1章 組換えタンパク質:市場概要
- 組換えタンパク質:市場概要
- 市場規模の概要:地域別 (2018年・2022年・2029年)
- 市場規模:地域別 (2018年~2029年)
- 過去の市場規模:地域別 (2018年~2023年)
- 市場規模の予測:地域別 (2024年~2029年)
- 主要地域の市場規模 (2018年~2029年)
- 北米の組換えタンパク質の市場規模 (2018年~2029年)
- 欧州の組換えタンパク質の市場規模 (2018年~2029年)
- アジア太平洋の組換えタンパク質の市場規模 (2018年~2029年)
- 南米の組換えタンパク質の市場規模 (2018年~2029年)
- 中東・アフリカの組換えタンパク質の市場規模 (2018年~2029年)
第2章 組換えタンパク質市場の概要:種類別
- 市場規模の概要:種類別 (2018年・2022年・2029年)
- 過去の市場規模:種類別 (2018年~2023年)
- 市場規模の予測:種類別 (2024年~2029年)
- ホルモン
- 成長因子
- サイトカイン
- 血漿タンパク質因子
- 組換え代謝酵素
- 免疫チェックポイントレギュレーター
第3章 組換えタンパク質市場の概要:用途別
- 市場規模の概要:用途別 (2018年・2022年・2029年)
- 過去の市場規模:用途別 (2018年~2023年)
- 市場規模の予測:用途別 (2024年~2029年)
- バイオ医薬品企業
- 教育・研究機関
- CRO (医薬品開発業務受託機関)
第4章 組換えタンパク質:企業別の競合分析
- 市場規模:企業別 (2018年~2023年)
- 世界の主要メーカー:企業の種類別 (ティア1、ティア2、ティア3) (収益別、2022年)
- 世界の主要組換えタンパク質メーカーの本社・設立時期
- 競合情勢
- 企業合併・買収 (M&A)、拡張計画
第5章 企業 (主要企業) のプロファイルと主要データ
- Bio-Techne Corporation
- Abcam PLC
- Merck KGaA
- Miltenyi Biotec
- Thermo Fisher Scientific
- ACROBiosystems
- Sino Biological
- Cytiva
- Eurogentec
- GenScript Biotech Corporation
- Reprocell
- BPS Bioscience
- Abnova Corporation
- ProSpec Tany TechnoGene
- Ajinomoto
第6章 北米
- 組換えタンパク質の市場規模:国別 (2018年~2029年)
- 米国
- カナダ
- メキシコ
第7章 欧州
- 組換えタンパク質の市場規模:国別 (2018年~2029年)
- ドイツ
- フランス
- 英国
- イタリア
- ロシア
- 北欧諸国
- 他の欧州諸国
第8章 アジア太平洋
- 組換えタンパク質の市場規模:地域別 (2018年~2029年)
- 中国
- 日本
- 韓国
- 東南アジア
- インド
- オーストラリア
- 他のアジア太平洋諸国
第9章 南米
- 組換えタンパク質の市場規模:国別 (2018年~2029年)
- ブラジル
- 他の南米諸国
第10章 中東・アフリカ
- 組換えタンパク質の市場規模:国別
- 湾岸協力会議 (GCC) 諸国
- 南アフリカ
- トルコ
- 他の中東・アフリカ諸国
第11章 組換えタンパク質の市場力学
- 組換えタンパク質業界の動向
- 組換えタンパク質市場の促進要因
- 組換えタンパク質市場の課題
- 組換えタンパク質市場の成長戦略
第12章 調査結果/結論
第13章 調査手法とデータソース
List of Tables
- Table 1. Global Market Recombinant Protein Market Size (US$ Million) Comparison by Region: 2018 VS 2022 VS 2029
- Table 2. Global Recombinant Protein Market Size by Region (2018-2023) & (US$ Million)
- Table 3. Global Recombinant Protein Market Size Share by Region (2018-2023)
- Table 4. Global Recombinant Protein Forecasted Market Size by Region (2024-2029) & (US$ Million)
- Table 5. Global Recombinant Protein Forecasted Market Size Share by Region (2024-2029)
- Table 6. Global Recombinant Protein Market Size (US$ Million) by Type: 2018 VS 2022 VS 2029
- Table 7. Global Recombinant Protein Market Size by Type (2018-2023) & (US$ Million)
- Table 8. Global Recombinant Protein Revenue Market Share by Type (2018-2023)
- Table 9. Global Recombinant Protein Forecasted Market Size by Type (2024-2029) & (US$ Million)
- Table 10. Global Recombinant Protein Revenue Market Share by Type (2024-2029)
- Table 11. Global Recombinant Protein Market Size by Application: (US$ Million) 2018 VS 2022 VS 2029
- Table 12. Global Recombinant Protein Market Size by Application (2018-2023) & (US$ Million)
- Table 13. Global Recombinant Protein Revenue Market Share by Application (2018-2023)
- Table 14. Global Recombinant Protein Forecasted Market Size by Application (2024-2029) & (US$ Million)
- Table 15. Global Recombinant Protein Revenue Market Share by Application (2024-2029)
- Table 16. Global Recombinant Protein Revenue by Players (2018-2023) & (US$ Million)
- Table 17. Global Recombinant Protein Revenue Market Share by Players (2018-2023)
- Table 18. Global Top Players Market Share by Company Type (Tier 1, Tier 2, and Tier 3) & (based on the Revenue in Recombinant Protein as of 2022)
- Table 19. Global Key Players of Recombinant Protein, Headquarters and Founded Time
- Table 20. Global Recombinant Protein Players Market Concentration Ratio (CR5)
- Table 21. Mergers & Acquisitions, Expansion Plans
- Table 22. Bio-Techne Corporation Basic Information
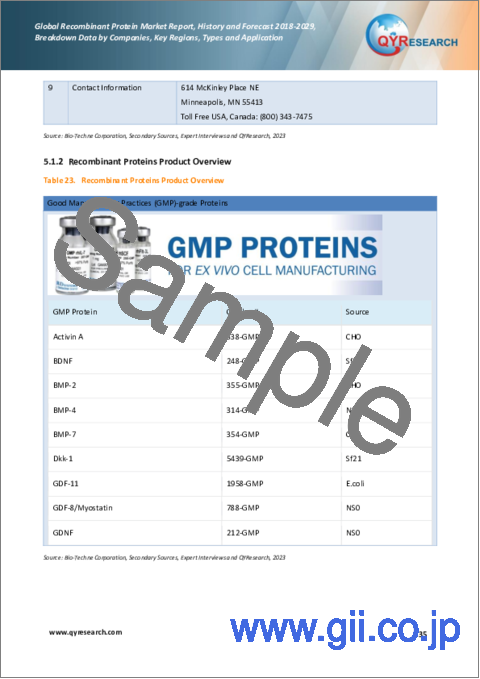
- Table 23. Recombinant Proteins Product Overview
- Table 24. Bio-Techne Corporation Recombinant Proteins Revenue and Gross Margin (2015-2020)
- Table 25. Bio-Techne Corporation Recent Developments
- Table 26. Abcam PLC Basic Information
- Table 27. Recombinant Proteins Product Overview
- Table 28. Abcam PLC Recombinant Proteins Revenue and Gross Margin (2015-2020)
- Table 29. Abcam PLC Recent Developments
- Table 30. Merck KGaA Basic Information
- Table 31. Recombinant Proteins Product Overview
- Table 32. Merck KGaA Recombinant Proteins Revenue and Gross Margin (2015-2020)
- Table 33. Merck KGaA Recent Developments
- Table 34. Miltenyi Biotec Basic Information
- Table 35. Recombinant Proteins Product Overview
- Table 36. Miltenyi Biotec Recombinant Proteins Revenue and Gross Margin (2015-2020)
- Table 37. Miltenyi Biotec Recent Developments
- Table 38. Thermo Fisher Scientific Basic Information
- Table 39. Recombinant Proteins Product Overview
- Table 40. Thermo Fisher Scientific Recombinant Proteins Revenue and Gross Margin (2015-2020)
- Table 41. Thermo Fisher Scientific Recent Developments
- Table 42. ACROBiosystems Basic Information
- Table 43. Recombinant Proteins Product Overview
- Table 44. ACROBiosystems Recombinant Proteins Revenue and Gross Margin (2015-2020)
- Table 45. ACROBiosystems Recent Developments
- Table 46. Sino Biological Basic Information
- Table 47. Recombinant Proteins Product Overview
- Table 48. Sino Biological Recombinant Proteins Revenue and Gross Margin (2015-2020)
- Table 49. Sino Biological Recent Developments
- Table 50. Cytiva Basic Information
- Table 51. Recombinant Proteins Product Overview
- Table 52. Cytiva Recombinant Proteins Revenue and Gross Margin (2015-2020)
- Table 53. Cytiva Recent Developments
- Table 54. Eurogentec Basic Information
- Table 55. Recombinant Proteins Product Overview
- Table 56. Eurogentec Recombinant Proteins Revenue and Gross Margin (2015-2020)
- Table 57. Eurogentec Recent Developments
- Table 58. GenScript Biotech Corporation Basic Information
- Table 59. Recombinant Proteins Product Overview
- Table 60. GenScript Biotech Corporation Recombinant Proteins Revenue and Gross Margin (2015-2020)
- Table 61. GenScript Biotech Corporation Recent Developments
- Table 62. Reprocell Basic Information
- Table 63. Recombinant Proteins Product Overview
- Table 64. Reprocell Recombinant Proteins Revenue and Gross Margin (2015-2020)
- Table 65. Reprocell Recent Developments
- Table 66. BPS Bioscience Basic Information
- Table 67. Recombinant Proteins Product Overview
- Table 68. BPS Bioscience Recombinant Proteins Revenue and Gross Margin (2015-2020)
- Table 69. Abnova Corporation Basic Information
- Table 70. Recombinant Proteins Product Overview
- Table 71. Abnova Corporation Recombinant Proteins Revenue and Gross Margin (2015-2020)
- Table 72. Abnova Corporation Recent Developments
- Table 73. ProSpec Tany TechnoGene Basic Information
- Table 74. Recombinant Proteins Product Overview
- Table 75. ProSpec Tany TechnoGene Recombinant Proteins Revenue and Gross Margin (2015-2020)
- Table 76. Ajinomoto Basic Information
- Table 77. Recombinant Proteins Product Overview
- Table 78. Ajinomoto Recombinant Proteins Revenue and Gross Margin (2015-2020)
- Table 79. Ajinomoto Recent Developments
- Table 80. North America Recombinant Protein Market Size Growth Rate (CAGR) by Country (US$ Million): 2018 VS 2022 VS 2029
- Table 81. North America Recombinant Protein Market Size by Country (2018-2023) & (US$ Million)
- Table 82. North America Recombinant Protein Market Size by Country (2024-2029) & (US$ Million)
- Table 83. Europe Recombinant Protein Market Size Growth Rate (CAGR) by Country (US$ Million): 2018 VS 2022 VS 2029
- Table 84. Europe Recombinant Protein Market Size by Country (2018-2023) & (US$ Million)
- Table 85. Europe Recombinant Protein Market Size by Country (2024-2029) & (US$ Million)
- Table 86. Europe Recombinant Protein Market Share by Country (2018-2023)
- Table 87. Europe Recombinant Protein Market Share by Country (2024-2029)
- Table 88. Asia-Pacific Recombinant Protein Market Size Growth Rate (CAGR) by Region (US$ Million): 2018 VS 2022 VS 2029
- Table 89. Asia-Pacific Recombinant Protein Market Size by Region (2018-2023) & (US$ Million)
- Table 90. Asia-Pacific Recombinant Protein Market Size by Region (2024-2029) & (US$ Million)
- Table 91. Asia-Pacific Recombinant Protein Market Share by Region (2018-2023)
- Table 92. Asia-Pacific Recombinant Protein Market Share by Region (2024-2029)
- Table 93. Japan Key Players Recombinant Proteins Revenue (2018-2023) (US$ Million)
- Table 94. Japan Key Players Recombinant Proteins Market Share (2019-2020)
- Table 95. South America Recombinant Protein Market Size Growth Rate (CAGR) by Country (US$ Million): 2018 VS 2022 VS 2029
- Table 96. South America Recombinant Protein Market Size by Country (2018-2023) & (US$ Million)
- Table 97. South America Recombinant Protein Market Size by Country (2024-2029) & (US$ Million)
- Table 98. Middle East and Africa Recombinant Protein Market Size Growth Rate (CAGR) by Country (US$ Million): 2018 VS 2022 VS 2029
- Table 99. Middle East & Africa Recombinant Protein Market Size by Country (2018-2023) & (US$ Million)
- Table 100. Middle East & Africa Recombinant Protein Market Size by Country (2024-2029) & (US$ Million)
- Table 101. Recombinant Protein Market Trends
- Table 102. Recombinant Protein Market Drivers
- Table 103. Recombinant Protein Market Challenges
- Table 104. Recombinant Proteins Market Growth Strategy
- Table 105. Research Programs/Design for This Report
- Table 106. Key Data Information from Secondary Sources
- Table 107. Key Data Information from Primary Sources
- Table 108. QYR Business Unit and Senior & Team Lead Analysts
List of Figures
- Figure 1. Recombinant Protein Product Picture
- Figure 2. Global Recombinant Protein Market Size Year-over-Year (2018-2029) & (US$ Million)
- Figure 3. Global Recombinant Protein Market Size, (US$ Million), 2018 VS 2023 VS 2029
- Figure 4. Global Recombinant Protein Market Share by Region: 2022 VS 2029
- Figure 5. Global Recombinant Protein Forecasted Market Size Share by Region (2018-2029)
- Figure 6. North America Recombinant Protein Market Size Growth Rate (2018-2029) & (US$ Million)
- Figure 7. Europe Recombinant Protein Market Size Growth Rate (2018-2029) & (US$ Million)
- Figure 8. Asia-Pacific Recombinant Protein Market Size Growth Rate (2018-2029) & (US$ Million)
- Figure 9. South America Recombinant Protein Market Size Growth Rate (2018-2029) & (US$ Million)
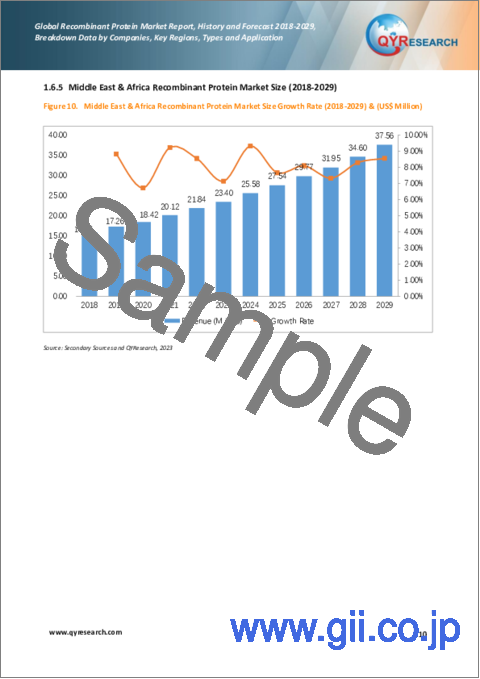
- Figure 10. Middle East & Africa Recombinant Protein Market Size Growth Rate (2018-2029) & (US$ Million)
- Figure 11. Global Recombinant Protein Market Size Share by Type: 2022 & 2029
- Figure 12. Hormones Market Size (US$ Million) & YoY Growth (2018-2029)
- Figure 13. Growth Factors Market Size (US$ Million) & YoY Growth (2018-2029)
- Figure 14. Cytokines Market Size (US$ Million) & YoY Growth (2018-2029)
- Figure 15. Plasma Protein Factor Market Size (US$ Million) & YoY Growth (2018-2029)
- Figure 16. Recombinant Metabolic Enzymes Market Size (US$ Million) & YoY Growth (2018-2029)
- Figure 17. Immune Checkpoint Regulators Market Size (US$ Million) & YoY Growth (2018-2029)
- Figure 18. Global Recombinant Protein Market Size Share by Application: 2022 & 2029
- Figure 19. Biopharmaceutical Companies Market Size (US$ Million) & YoY Growth (2018-2029)
- Figure 20. Academic and Research Institutes Market Size (US$ Million) & YoY Growth (2018-2029)
- Figure 21. Contract Research Organizations Market Size (US$ Million) & YoY Growth (2018-2029)
- Figure 22. Recombinant Protein Market Share by Company Type (Tier 1, Tier 2, and Tier 3): 2018 VS 2022
- Figure 23. The Top 10 and Top 5 Players Market Share by Recombinant Protein Sales in 2022
- Figure 24. North America Recombinant Protein Market Share by Country (2018-2029)
- Figure 25. United States Recombinant Protein Market Size (2018-2029) & (US$ Million)
- Figure 26. Canada Recombinant Protein Market Size (2018-2029) & (US$ Million)
- Figure 27. Mexico Recombinant Protein Market Size (2018-2029) & (US$ Million)
- Figure 28. Germany Recombinant Protein Market Size (2018-2029) & (US$ Million)
- Figure 29. France Recombinant Protein Market Size (2018-2029) & (US$ Million)
- Figure 30. U.K. Recombinant Protein Market Size (2018-2029) & (US$ Million)
- Figure 31. Italy Recombinant Protein Market Size (2018-2029) & (US$ Million)
- Figure 32. Russia Recombinant Protein Market Size (2018-2029) & (US$ Million)
- Figure 33. Nordic Countries Recombinant Protein Market Size (2018-2029) & (US$ Million)
- Figure 34. Rest of Europe Recombinant Protein Market Size (2018-2029) & (US$ Million)
- Figure 35. Asia-Pacific Recombinant Protein Market Share by Region (2018-2029)
- Figure 36. China Recombinant Protein Market Size (2018-2029) & (US$ Million)
- Figure 37. Japan Recombinant Protein Market Size (2018-2029) & (US$ Million)
- Figure 38. South Korea Recombinant Protein Market Size (2018-2029) & (US$ Million)
- Figure 39. Southeast Asia Recombinant Protein Market Size (2018-2029) & (US$ Million)
- Figure 40. India Recombinant Protein Market Size (2018-2029) & (US$ Million)
- Figure 41. Australia Recombinant Protein Market Size (2018-2029) & (US$ Million)
- Figure 42. Rest of Asia-Pacific Recombinant Protein Market Size (2018-2029) & (US$ Million)
- Figure 43. South America Recombinant Protein Market Share by Country (2018-2029)
- Figure 44. Brazil Recombinant Protein Market Size (2018-2029) & (US$ Million)
- Figure 45. Rest of South America Recombinant Protein Market Size (2018-2029) & (US$ Million)
- Figure 46. Middle East & Africa Recombinant Protein Market Share by Country (2018-2029)
- Figure 47. GCC Countries Recombinant Protein Market Size (2018-2029) & (US$ Million)
- Figure 48. South Africa Recombinant Protein Market Size (2018-2029) & (US$ Million)
- Figure 49. Turkey Recombinant Protein Market Size (2018-2029) & (US$ Million)
- Figure 50. Rest of Middle East & Africa Recombinant Protein Market Size (2018-2029) & (US$ Million)
- Figure 51. Bottom-up and Top-down Approaches for This Report
- Figure 52. Data Triangulation
Due to the COVID-19 pandemic and Russia-Ukraine War Influence, the global market for Recombinant Protein estimated was at US$ 975.77 million in the year 2022, is projected to reach a revised size of US$ 2,320.21 million by 2029, growing at a CAGR of 13.02% during the forecast period 2023-2029.
North American market for Recombinant Protein was valued at $ 334.79 million in 2022 and will reach $ 736.53 million by 2029, at a CAGR of 11.75% during the forecast period of 2023 through 2029.
Asia-Pacific market for Recombinant Protein was valued at $ 362.89 million in 2022 and will reach $ 1,010.82 million by 2029, at a CAGR of 15.52% during the forecast period of 2023 through 2029.
Europe market for Recombinant Protein was valued at $ 240.37 million in 2022 and will reach $ 508.09 million by 2029, at a CAGR of 11.15% during the forecast period of 2023 through 2029.
Report Scope
This report aims to provide a comprehensive presentation of the global market for Recombinant Protein, with both quantitative and qualitative analysis, to help readers develop business/growth strategies, assess the market competitive situation, analyze their position in the current marketplace, and make informed business decisions regarding Recombinant Protein.
The Recombinant Protein market size, estimations, and forecasts are provided in terms of revenue ($ millions), considering 2022 as the base year, with history and forecast data for the period from 2018 to 2029. This report segments the global Recombinant Protein market comprehensively. Regional market sizes, concerning products by Type, by Application, and by players, are also provided. The influence of COVID-19 and the Russia-Ukraine War were considered while estimating market sizes.
For a more in-depth understanding of the market, the report provides profiles of the competitive landscape, key competitors, and their respective market ranks. The report also discusses technological trends and new product developments.
This report will help the readers to understand the competition within the industries and strategies for the competitive environment to enhance the potential profit. The report also focuses on the competitive landscape of the global Recombinant Protein market, and introduces in detail the market share, industry ranking, competitor ecosystem, market performance, new product development, operation situation, expansion, and acquisition. etc. of the main players, which helps the readers to identify the main competitors and deeply understand the competition pattern of the market.
Market Segmentation
This report covers the Recombinant Protein segments by company, by Type, by Application, by region and country, and provides market size and CAGR for the history and forecast period (2018-2022, 2023-2029), considering 2022 as the base year. It elucidates potential revenue opportunities across different segments and explains attractive investment proposition matrices for this market.
By Company
- Bio-Techne Corporation
- Abcam PLC
- Merck KGaA
- Miltenyi Biotec
- Thermo Fisher Scientific
- ACROBiosystems
- Sino Biological
- Cytiva
- Eurogentec
- GenScript Biotech Corporation
- Reprocell
- BPS Bioscience
- Abnova Corporation
- ProSpec Tany TechnoGene
- Ajinomoto
Segment by Type
- Hormones
- Growth Factors
- Cytokines
- Plasma Protein Factor
- Recombinant Metabolic Enzymes
- Immune Checkpoint Regulators
- Others
Segment by Application
- Biopharmaceutical Companies
- Academic and Research Institutes
- Contract Research Organizations
By Region
- North America
- United States
- Canada
- Mexico
- Asia-Pacific
- China
- Japan
- South Korea
- Southeast Asia
- India
- Australia
- Europe
- Germany
- France
- U.K.
- Italy
- Russia
- Nordic Countries
- South America
- Brazil
- Middle East & Africa
- GCC Countries
- South Africa
- Turkey
Core Chapters
- Chapter One: Introduces the report scope of the report, executive summary of global and regional market size and CAGR for the history and forecast period (2018-2022, 2024-2029). It offers a high-level view of the current state of the market and its likely evolution in the short to mid-term, and long term.
- Chapter Two: Provides the analysis of various market segments by Type, covering the market size and development potential of each market segment, to help readers find the blue ocean market in different market segments.
- Chapter Three: Provides the analysis of various market segments by Application, covering the market size and development potential of each market segment, to help readers find the blue ocean market in different downstream markets.
- Chapter Four: Detailed analysis of Recombinant Protein companies' competitive landscape, revenue, market share and ranking, latest development plan, merger, and acquisition information, etc.
- Chapter Five: Provides profiles of key players, introducing the basic situation of the main companies in the market in detail, including product introduction, revenue, recent development, etc.
- Chapter Six, Seven, Eight, Nine and Ten: North America, Europe, Asia Pacific, South America, Middle East & Africa, revenue by country.
- Chapter Eleven: this section also introduces the market dynamics, latest developments of the market, the driving factors and restrictive factors of the market, the challenges and risks faced by companies in the industry, and the analysis of relevant policies in the industry.
- Chapter Twelve: Research Finding/Conclusion
Table of Contents
1 Market Overview of Recombinant Protein
- 1.1 Recombinant Protein Market Overview
- 1.1.1 Recombinant Protein Product Scope
- 1.1.2 Recombinant Protein Market Status and Outlook
- 1.2 Global Recombinant Protein Market Size Overview by Region 2018 VS 2022 VS 2029
- 1.3 Global Recombinant Protein Market Size by Region (2018-2029)
- 1.4 Global Recombinant Protein Historic Market Size by Region (2018-2023)
- 1.5 Global Recombinant Protein Market Size Forecast by Region (2024-2029)
- 1.6 Key Regions Recombinant Protein Market Size (2018-2029)
- 1.6.1 North America Recombinant Protein Market Size (2018-2029)
- 1.6.2 Europe Recombinant Protein Market Size (2018-2029)
- 1.6.3 Asia-Pacific Recombinant Protein Market Size (2018-2029)
- 1.6.4 South America Recombinant Protein Market Size (2018-2029)
- 1.6.5 Middle East & Africa Recombinant Protein Market Size (2018-2029)
2 Recombinant Protein Market Overview by Type
- 2.1 Global Recombinant Protein Market Size by Type: 2018 VS 2022 VS 2029
- 2.2 Global Recombinant Protein Historic Market Size by Type (2018-2023)
- 2.3 Global Recombinant Protein Forecasted Market Size by Type (2024-2029)
- 2.4 Hormones
- 2.5 Growth Factors
- 2.6 Cytokines
- 2.7 Plasma Protein Factor
- 2.8 Recombinant Metabolic Enzymes
- 2.9 Immune Checkpoint Regulators
3 Recombinant Protein Market Overview by Application
- 3.1 Global Recombinant Protein Market Size by Application: 2018 VS 2022 VS 2029
- 3.2 Global Recombinant Protein Historic Market Size by Application (2018-2023)
- 3.3 Global Recombinant Protein Forecasted Market Size by Application (2024-2029)
- 3.4 Biopharmaceutical Companies
- 3.5 Academic and Research Institutes
- 3.6 Contract Research Organizations
4 Recombinant Protein Competition Analysis by Players
- 4.1 Global Recombinant Protein Market Size by Players (2018-2023)
- 4.2 Global Top Players by Company Type (Tier 1, Tier 2, and Tier 3) & (based on the Revenue in Recombinant Protein as of 2022)
- 4.3 Global Key Players of Recombinant Protein Head office and Founded Time
- 4.4 Competitive Status
- 4.5 Mergers & Acquisitions, Expansion Plans
5 Company (Top Players) Profiles
- 5.1 Bio-Techne Corporation
- 5.1.1 Profile
- 5.1.2 Recombinant Proteins Product Overview
- 5.1.3 Bio-Techne Corporation Recombinant Proteins Revenue and Gross Margin (2015-2020)
- 5.1.4 Bio-Techne Corporation Recent Developments
- 5.2 Abcam PLC
- 5.2.1 Profile
- 5.2.2 Recombinant Proteins Product Overview
- 5.2.3 Abcam PLC Recombinant Proteins Revenue and Gross Margin (2015-2020)
- 5.2.4 Abcam PLC Recent Developments
- 5.3 Merck KGaA
- 5.3.1 Profile
- 5.3.2 Recombinant Proteins Product Overview
- 5.3.3 Merck KGaA Recombinant Proteins Revenue and Gross Margin (2015-2020)
- 5.3.4 Merck KGaA Recent Developments
- 5.4 Miltenyi Biotec
- 5.4.1 Profile
- 5.4.2 Recombinant Proteins Product Overview
- 5.4.3 Miltenyi Biotec Recombinant Proteins Revenue and Gross Margin (2015-2020)
- 5.4.4 Miltenyi Biotec Recent Developments
- 5.5 Thermo Fisher Scientific
- 5.5.1 Profile
- 5.5.2 Recombinant Proteins Product Overview
- 5.5.3 Thermo Fisher Scientific Recombinant Proteins Revenue and Gross Margin (2015-2020)
- 5.5.4 Thermo Fisher Scientific Recent Developments
- 5.6 ACROBiosystems
- 5.6.1 Profile
- 5.6.2 Recombinant Proteins Product Overview
- 5.6.3 ACROBiosystems Recombinant Proteins Revenue and Gross Margin (2015-2020)
- 5.6.4 ACROBiosystems Recent Developments
- 5.7 Sino Biological
- 5.7.1 Profile
- 5.7.2 Recombinant Proteins Product Overview
- 5.7.3 Sino Biological Recombinant Proteins Revenue and Gross Margin (2015-2020)
- 5.7.4 Sino Biological Recent Developments
- 5.8 Cytiva
- 5.8.1 Profile
- 5.8.2 Recombinant Proteins Product Overview
- 5.8.3 Cytiva Recombinant Proteins Revenue and Gross Margin (2015-2020)
- 5.8.4 Cytiva Recent Developments
- 5.9 Eurogentec
- 5.9.1 Profile
- 5.9.2 Recombinant Proteins Product Overview
- 5.9.3 Eurogentec Recombinant Proteins Revenue and Gross Margin (2015-2020)
- 5.9.4 Eurogentec Recent Developments
- 5.10 GenScript Biotech Corporation
- 5.10.1 Profile
- 5.10.2 Recombinant Proteins Product Overview
- 5.10.3 GenScript Biotech Corporation Recombinant Proteins Revenue and Gross Margin (2015-2020)
- 5.10.4 GenScript Biotech Corporation Recent Developments
- 5.11 Reprocell
- 5.11.1 Profile
- 5.11.2 Recombinant Proteins Product Overview
- 5.11.3 Reprocell Recombinant Proteins Revenue and Gross Margin (2015-2020)
- 5.11.4 Reprocell Recent Developments
- 5.12 BPS Bioscience
- 5.12.1 Profile
- 5.12.2 Recombinant Proteins Product Overview
- 5.12.3 BPS Bioscience Recombinant Proteins Revenue and Gross Margin (2015-2020)
- 5.13 Abnova Corporation
- 5.13.1 Profile
- 5.13.2 Recombinant Proteins Product Overview
- 5.13.3 Abnova Corporation Recombinant Proteins Revenue and Gross Margin (2015-2020)
- 5.13.4 Abnova Corporation Recent Developments
- 5.14 ProSpec Tany TechnoGene
- 5.14.1 Profile
- 5.14.2 Recombinant Proteins Product Overview
- 5.14.3 ProSpec Tany TechnoGene Recombinant Proteins Revenue and Gross Margin (2015-2020)
- 5.15 Ajinomoto
- 5.15.1 Profile
- 5.15.2 Recombinant Proteins Product Overview
- 5.15.3 Ajinomoto Recombinant Proteins Revenue and Gross Margin (2015-2020)
- 5.15.4 Ajinomoto Recent Developments
6 North America
- 6.1 North America Recombinant Protein Market Size by Country (2018-2029)
- 6.2 United States
- 6.3 Canada
- 6.4 Mexico
7 Europe
- 7.1 Europe Recombinant Protein Market Size by Country (2018-2029)
- 7.2 Germany
- 7.3 France
- 7.4 U.K.
- 7.5 Italy
- 7.6 Russia
- 7.7 Nordic Countries
- 7.8 Rest of Europe
8 Asia-Pacific
- 8.1 Asia-Pacific Recombinant Protein Market Size by Region (2018-2029)
- 8.2 China
- 8.3 Japan
- 8.4 South Korea
- 8.5 Southeast Asia
- 8.6 India
- 8.7 Australia
- 8.8 Rest of Asia-Pacific
9 South America
- 9.1 South America Recombinant Protein Market Size by Country (2018-2029)
- 9.2 Brazil
- 9.3 Rest of South America
10 Middle East & Africa
- 10.1 Middle East & Africa Recombinant Protein Market Size by Country
- 10.2 GCC Countries
- 10.3 South Africa
- 10.4 Turkey
- 10.5 Rest of Middle East & Africa
11 Recombinant Protein Market Dynamics
- 11.1 Recombinant Protein Industry Trends
- 11.2 Recombinant Protein Market Drivers
- 11.3 Recombinant Protein Market Challenges
- 11.4 Recombinant Proteins Market Growth Strategy
12 Research Finding/Conclusion
13 Methodology and Data Source
- 13.1 Methodology/Research Approach
- 13.1.1 Research Programs/Design
- 13.1.2 Market Size Estimation
- 13.1.3 Market Breakdown and Data Triangulation
- 13.2 Data Source
- 13.2.1 Secondary Sources
- 13.2.2 Primary Sources
- 13.3 Author List
- 13.4 Disclaimer