|
|
市場調査レポート
商品コード
1224404
高速コネクタの世界市場:産業分析・成長動向・競合分析 (2023年~2029年)Global High Speed Connector Industry Research Report Growth Trends and Competitive Analysis 2023-2029 |
||||||
|
|
|||||||
|
● お客様のご希望に応じて、既存データの加工や未掲載情報(例:国別セグメント)の追加などの対応が可能です。 詳細はお問い合わせください。 |
|||||||


| 高速コネクタの世界市場:産業分析・成長動向・競合分析 (2023年~2029年) |
|
出版日: 2023年02月23日
発行: QYResearch
ページ情報: 英文 195 Pages
納期: 2~3営業日
|
- 全表示
- 概要
- 図表
- 目次
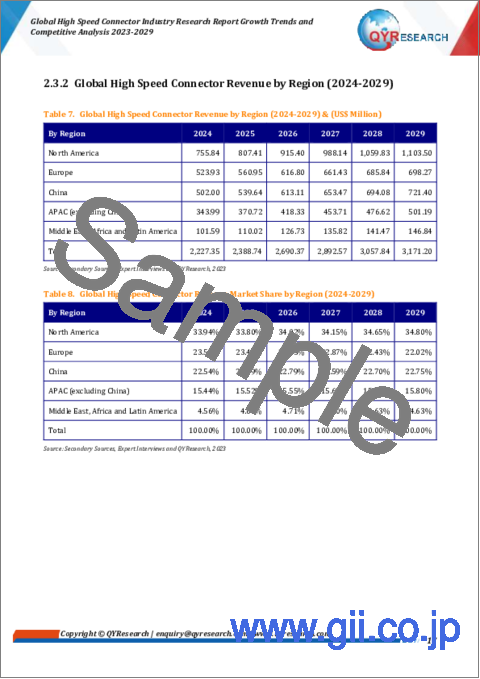
世界の高速コネクタの市場規模は、2022年に23億3,000万米ドルに達した後、予測期間中 (2023年~2029年) に6.15%のCAGRで成長し、2029年には31億7,000万米ドルに再調整されると予測されています。
米国の高速コネクタの市場規模は、2023年の7億6,918万米ドルから、2029年には11億米ドルに増加し、予測期間中 (2023年~2029年) に6.99%のCAGRで成長すると予測されます。
中国の高速コネクタの市場規模は、2023年の5億2,506万米ドルから、2029年には7億2,140万米ドルに増加し、予測期間中 (2023年~2029年) に6.33%のCAGRで成長すると予測されています。
欧州の高速コネクタの市場規模は、2023年の5億6,736万米ドルから、2029年には6億9,827万米ドルに増加し、予測期間中 (2023年~2029年) に4.51%のCAGRで成長すると推定されます。
当レポートでは、世界の高速コネクタの市場について分析し、種類別・用途別・地域別 (国別) の市場動向の見通し (2018年~2029年)、主要企業のプロファイルなどについて調査しております。
目次
第1章 分析概要
- 高速コネクタの定義
- 種類別の市場
- 市場規模・成長率:種類別 (2018年・2022年・2029年)
- 基板対基板コネクタ
- 電線対基板コネクタ
- その他
- 用途別の市場
- 市場規模・成長率:用途別 (2018年・2022年・2029年)
- 通信・IT
- 交通機械
- 工業用
- 航空宇宙・軍事
- その他
- 前提と制限
- 調査目的
- 検討年数
第2章 世界の高速コネクタの販売
- 世界の高速コネクタの収益:推定・予測 (2018年~2029年)
- 世界の高速コネクタの収益:地域別 (2018年・2022年・2029年)
- 世界の高速コネクタの収益:地域別
- 収益:地域別 (2018年~2023年)
- 収益:地域別 (2024年~2029年)
- 世界の高速コネクタの販売:推定・予測 (2018年~2029年)
- 世界の高速コネクタの販売:地域別 (2018年・2022年・2029年)
- 世界の高速コネクタの販売:地域別
- 販売:地域別 (2018年~2023年)
- 販売:地域別 (2024年~2029年)
- 北米
- 欧州
- 中国
- アジア太平洋 (中国以外)
- 中東・アフリカ、ラテンアメリカ
第3章 世界の高速コネクタの生産 (製造拠点ベース)
- 世界の高速コネクタの生産額:地域別 (2018年・2022年・2029年)
- 世界の高速コネクタの生産額:地域別
- 過去の生産額:地域別 (2018年~2023年)
- 生産額の予測:地域別 (2024年~2029年)
- 世界の高速コネクタの生産量:地域別 (2018年・2022年・2029年)
- 世界の高速コネクタの生産量:地域別
- 過去の生産量:地域別 (2018年~2023年)
- 生産量の予測:地域別 (2024年~2029年)
- 北米
- 欧州
- 中国
- 日本
第4章 メーカー別の競合
- 世界の高速コネクタの販売量:メーカー別
- 世界の高速コネクタの収益額:メーカー別
- 世界の高速コネクタの販売価格:メーカー別
- 世界の高速コネクタの主要企業:業界ランキング (2021年・2022年)
- 競合情勢の分析
- 世界の高速コネクタの主要メーカー:製造拠点・本社
- 世界の高速コネクタの主要メーカー:主要製品
- 世界の高速コネクタの主要メーカー:設立時期
- 企業合併・買収 (M&A)、拡張計画
第5章 種類別の市場規模
- 世界の高速コネクタの販売:種類別
- 世界の高速コネクタの収益:種類別
- 世界の高速コネクタの価格:種類別
第6章 用途別の市場規模
- 世界の高速コネクタの販売:用途別
- 世界の高速コネクタの収益:用途別
- 世界の高速コネクタの価格:用途別
第7章 北米
- 高速コネクタの販売:企業別
- 高速コネクタの市場規模:種類別
- 高速コネクタの市場規模:用途別
- 高速コネクタの市場規模:国別
- 米国
- カナダ
第8章 欧州
- 高速コネクタの販売:企業別
- 高速コネクタの市場規模:種類別
- 高速コネクタの市場規模:用途別
- 高速コネクタの市場規模:国別
- ドイツ
- フランス
- 英国
- イタリア
第9章 中国
- 高速コネクタの販売:企業別
- 高速コネクタの市場規模:種類別
- 高速コネクタの市場規模:用途別
第10章 アジア太平洋 (中国以外)
- 高速コネクタの販売:企業別
- 高速コネクタの市場規模:種類別
- 高速コネクタの市場規模:用途別
- 高速コネクタの市場規模:地域別
- 日本
- 韓国
- 台湾
- 東南アジア
- インド
第11章 中東・アフリカ・ラテンアメリカ
- 高速コネクタの販売:企業別
- 高速コネクタの市場規模:種類別
- 高速コネクタの市場規模:用途別
第12章 企業プロファイル
- TE Connectivity
- Samtec
- Amphenol
- Molex
- Hirose
- Japan Aviation Electronics Industry
- Yamaichi Electronics
- Kyocera
- IMS Connector Systems
- Omron
- Smiths Interconnect
- IRISO Electronics
第13章 バリューチェーンと販売チャネルの分析
- 高速コネクタのバリューチェーンの分析
- 高速コネクタの主要原材料
- 高速コネクタの製造モードとプロセス
- 高速コネクタの販売とマーケティング
- 高速コネクタの顧客
第14章 高速コネクタの市場力学
- 高速コネクタ業界の動向
- 高速コネクタ市場の促進要因
- 高速コネクタ市場の課題
第15章 世界の高速コネクタ市場:主な調査結果
第16章 付録
List of Tables
- Table 1. Global High Speed Connector Market Size Growth Rate (CAGR) by Type, 2018 VS 2022 VS 2029 (US$ Million)
- Table 2. Major Manufacturers of Wire-to-Board Connectors
- Table 3. Global High Speed Connector Market Size Growth Rate (CAGR) by Application, 2018 VS 2022 VS 2029 (US$ Million)
- Table 4. Global High Speed Connector Revenue by Region: 2018 VS 2022 VS 2029 (US$ Million)
- Table 5. Global High Speed Connector Revenue by Region (2018-2023) & (US$ Million)
- Table 6. Global High Speed Connector Revenue Market Share by Region (2018-2023)
- Table 7. Global High Speed Connector Revenue by Region (2024-2029) & (US$ Million)
- Table 8. Global High Speed Connector Revenue Market Share by Region (2024-2029)
- Table 9. Global High Speed Connector Sales Quantity by Region: 2018 VS 2022 VS 2029 (K Units)
- Table 10. Global High Speed Connector Sales Quantity by Region (2018-2023) & (K Units)
- Table 11. Global High Speed Connector Sales Quantity Market Share by Region (2018-2023)
- Table 12. Global High Speed Connector Sales Quantity by Region (2024-2029) & (K Units)
- Table 13. Global High Speed Connector Sales Quantity Market Share by Region (2024-2029)
- Table 14. Global High Speed Connector Production Value Growth Rate (CAGR) by Region: 2018 VS 2022 VS 2029 (US$ Million)
- Table 15. Global High Speed Connector Production Value by Region (2018-2023) & (US$ Million)
- Table 16. Global High Speed Connector Production Value Market Share by Region (2018-2023)
- Table 17. Global High Speed Connector Production Value by Region (2024-2029) & (US$ Million)
- Table 18. Global High Speed Connector Production Value Market Share by Region (2024-2029)
- Table 19. Global High Speed Connector Production Growth Rate (CAGR) by Region: 2018 VS 2022 VS 2029 (K Units)
- Table 20. Global High Speed Connector Production by Region (2018-2023) & (K Units)
- Table 21. Global High Speed Connector Production Market Share by Region (2018-2023)
- Table 22. Global High Speed Connector Production by Region (2024-2029) & (K Units)
- Table 23. Global High Speed Connector Production Market Share by Region (2024-2029)
- Table 24. Global High Speed Connector Sales Quantity by Manufacturers (2018-2023) & (K Units)
- Table 25. Global High Speed Connector Sales Quantity Share by Manufacturers (2018-2023)
- Table 26. Global High Speed Connector Revenue by Manufacturers (2018-2023) & (US$ Million)
- Table 27. Global High Speed Connector Revenue Share by Manufacturers (2018-2023)
- Table 28. Global High Speed Connector Price by Manufacturers 2018-2023 (US$/Unit)
- Table 29. Global Key Players of High Speed Connector, Industry Ranking, 2021 VS 2022 & (US$ Million)
- Table 30. Global High Speed Connector Manufacturers Market Concentration Ratio (CR5 and HHI)
- Table 31. Global High Speed Connector by Company Type (Tier 1, Tier 2, and Tier 3) & (based on the Revenue in High Speed Connector as of 2022)
- Table 32. Global Key Manufacturers of High Speed Connector, Manufacturing Base Distribution and Headquarters
- Table 33. Global Key Manufacturers of High Speed Connector, Product Offered
- Table 34. Global Key Manufacturers of High Speed Connector, Date of Enter into This Industry
- Table 35. Mergers & Acquisitions, Expansion Plans
- Table 36. Global High Speed Connector Sales Quantity by Type (2018-2023) & (K Units)
- Table 37. Global High Speed Connector Sales Quantity by Type (2024-2029) & (K Units)
- Table 38. Global High Speed Connector Sales Quantity Share by Type (2018-2023)
- Table 39. Global High Speed Connector Sales Quantity Share by Type (2024-2029)
- Table 40. Global High Speed Connector Revenue by Type (2018-2023) & (US$ Million)
- Table 41. Global High Speed Connector Revenue by Type (2024-2029) & (US$ Million)
- Table 42. Global High Speed Connector Revenue Share by Type (2018-2023)
- Table 43. Global High Speed Connector Revenue Share by Type (2024-2029)
- Table 44. High Speed Connector Price by Type (2018-2023) & (US$/Unit)
- Table 45. Global High Speed Connector Price Forecast by Type (2024-2029) & (US$/Unit)
- Table 46. Global High Speed Connector Sales Quantity by Application (2018-2023) & (K Units)
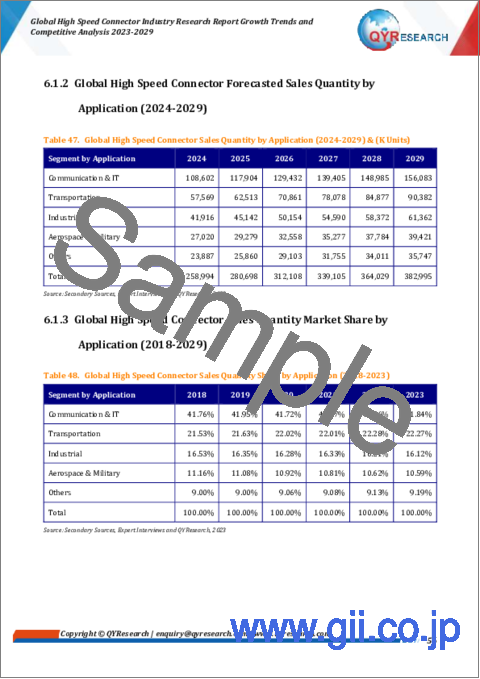
- Table 47. Global High Speed Connector Sales Quantity by Application (2024-2029) & (K Units)
- Table 48. Global High Speed Connector Sales Quantity Share by Application (2018-2023)
- Table 49. Global High Speed Connector Sales Quantity Share by Application (2024-2029)
- Table 50. Global High Speed Connector Revenue by Application (2018-2023) & (US$ Million)
- Table 51. Global High Speed Connector Revenue by Application (2024-2029) & (US$ Million)
- Table 52. Global High Speed Connector Revenue Share by Application (2018-2023)
- Table 53. Global High Speed Connector Revenue Share by Application (2024-2029)
- Table 54. High Speed Connector Price by Application (2018-2023) & (US$/Unit)
- Table 55. Global High Speed Connector Price Forecast by Application (2024-2029) & (US$/Unit)
- Table 56. North America High Speed Connector Revenue by Company (2018-2023) & (US$ Million)
- Table 57. North America High Speed Connector Revenue Market Share by Company (2018-2023)
- Table 58. North America High Speed Connector Sales Quantity by Company (2018-2023) & (K Units)
- Table 59. North America High Speed Connector Sales Quantity by Type (2018-2023) & (K Units)
- Table 60. North America High Speed Connector Sales Quantity by Type (2024-2029) & (K Units)
- Table 61. North America High Speed Connector Sales Quantity Market Share by Type (2018-2023)
- Table 62. North America High Speed Connector Sales Quantity Market Share by Type (2024-2029)
- Table 63. North America High Speed Connector Revenue by Type (2018-2023) & (US$ Million)
- Table 64. North America High Speed Connector Revenue by Type (2024-2029) & (US$ Million)
- Table 65. North America High Speed Connector Revenue Market Share by Type (2018-2023)
- Table 66. North America High Speed Connector Revenue Market Share by Type (2024-2029)
- Table 67. North America High Speed Connector Sales Quantity by Application (2018-2023) & (K Units)
- Table 68. North America High Speed Connector Sales Quantity by Application (2024-2029) & (K Units)
- Table 69. North America High Speed Connector Sales Quantity Market Share by Application (2018-2023)
- Table 70. North America High Speed Connector Sales Quantity Market Share by Application (2024-2029)
- Table 71. North America High Speed Connector Revenue by Application (2018-2023) & (US$ Million)
- Table 72. North America High Speed Connector Revenue by Application (2024-2029) & (US$ Million)
- Table 73. North America High Speed Connector Revenue Market Share by Application (2018-2023)
- Table 74. North America High Speed Connector Revenue Market Share by Application (2024-2029)
- Table 75. North America High Speed Connector Revenue by Country: 2018 VS 2022 VS 2029 (US$ Million)
- Table 76. North America High Speed Connector Revenue by Country (2018-2023) & (US$ Million)
- Table 77. North America High Speed Connector Revenue by Country (2024-2029) & (US$ Million)
- Table 78. North America High Speed Connector Revenue Share by Country (2018-2023)
- Table 79. North America High Speed Connector Revenue Share by Country (2024-2029)
- Table 80. North America High Speed Connector Sales Quantity by Country (2018-2023) & (K Units)
- Table 81. North America High Speed Connector Sales Quantity by Country (2024-2029) & (K Units)
- Table 82. North America High Speed Connector Sales Quantity Share by Country (2018-2023)
- Table 83. North America High Speed Connector Sales Quantity Share by Country (2024-2029)
- Table 84. Europe High Speed Connector Revenue by Company (2018-2023) & (US$ Million)
- Table 85. Europe High Speed Connector Revenue Market Share by Company (2018-2023)
- Table 86. Europe High Speed Connector Sales Quantity by Company (2018-2023) & (K Units)
- Table 87. Europe High Speed Connector Sales Quantity by Type (2018-2023) & (K Units)
- Table 88. Europe High Speed Connector Sales Quantity by Type (2024-2029) & (K Units)
- Table 89. Europe High Speed Connector Sales Quantity Market Share by Type (2018-2023)
- Table 90. Europe High Speed Connector Sales Quantity Market Share by Type (2024-2029)
- Table 91. Europe High Speed Connector Revenue by Type (2018-2023) & (US$ Million)
- Table 92. Europe High Speed Connector Revenue by Type (2024-2029) & (US$ Million)
- Table 93. Europe High Speed Connector Revenue Market Share by Type (2018-2023)
- Table 94. Europe High Speed Connector Revenue Market Share by Type (2024-2029)
- Table 95. Europe High Speed Connector Sales Quantity by Application (2018-2023) & (K Units)
- Table 96. Europe High Speed Connector Sales Quantity by Application (2024-2029) & (K Units)
- Table 97. Europe High Speed Connector Sales Quantity Market Share by Application (2018-2023)
- Table 98. Europe High Speed Connector Sales Quantity Market Share by Application (2024-2029)
- Table 99. Europe High Speed Connector Revenue by Application (2018-2023) & (US$ Million)
- Table 100. Europe High Speed Connector Revenue by Application (2024-2029) & (US$ Million)
- Table 101. Europe High Speed Connector Revenue Market Share by Application (2018-2023)
- Table 102. Europe High Speed Connector Revenue Market Share by Application (2024-2029)
- Table 103. Europe High Speed Connector Revenue by Country: 2018 VS 2022 VS 2029 (US$ Million)
- Table 104. Europe High Speed Connector Revenue by Country (2018-2023) & (US$ Million)
- Table 105. Europe High Speed Connector Revenue by Country (2024-2029) & (US$ Million)
- Table 106. Europe High Speed Connector Revenue Share by Country (2018-2023)
- Table 107. Europe High Speed Connector Revenue Share by Country (2024-2029)
- Table 108. Europe High Speed Connector Sales Quantity by Country (2018-2023) & (K Units)
- Table 109. Europe High Speed Connector Sales Quantity by Country (2024-2029) & (K Units)
- Table 110. Europe High Speed Connector Sales Quantity Share by Country (2018-2023)
- Table 111. Europe High Speed Connector Sales Quantity Share by Country (2024-2029)
- Table 112. China High Speed Connector Revenue by Company (2018-2023) & (US$ Million)
- Table 113. China High Speed Connector Revenue Market Share by Company (2018-2023)
- Table 114. China High Speed Connector Sales Quantity by Company (2018-2023) & (K Units)
- Table 115. China High Speed Connector Sales Quantity by Type (2018-2023) & (K Units)
- Table 116. China High Speed Connector Sales Quantity by Type (2024-2029) & (K Units)
- Table 117. China High Speed Connector Sales Quantity Market Share by Type (2018-2023)
- Table 118. China High Speed Connector Sales Quantity Market Share by Type (2024-2029)
- Table 119. China High Speed Connector Revenue by Type (2018-2023) & (US$ Million)
- Table 120. China High Speed Connector Revenue by Type (2024-2029) & (US$ Million)
- Table 121. China High Speed Connector Revenue Market Share by Type (2018-2023)
- Table 122. China High Speed Connector Revenue Market Share by Type (2024-2029)
- Table 123. China High Speed Connector Sales Quantity by Application (2018-2023) & (K Units)
- Table 124. China High Speed Connector Sales Quantity by Application (2024-2029) & (K Units)
- Table 125. China High Speed Connector Sales Quantity Market Share by Application (2018-2023)
- Table 126. China High Speed Connector Sales Quantity Market Share by Application (2024-2029)
- Table 127. China High Speed Connector Revenue by Application (2018-2023) & (US$ Million)
- Table 128. China High Speed Connector Revenue by Application (2024-2029) & (US$ Million)
- Table 129. China High Speed Connector Revenue Market Share by Application (2018-2023)
- Table 130. China High Speed Connector Revenue Market Share by Application (2024-2029)
- Table 131. APAC High Speed Connector Revenue by Company (2018-2023) & (US$ Million)
- Table 132. APAC High Speed Connector Revenue Market Share by Company (2018-2023)
- Table 133. APAC High Speed Connector Sales Quantity by Company (2018-2023) & (K Units)
- Table 134. APAC High Speed Connector Sales Quantity by Type (2018-2023) & (K Units)
- Table 135. APAC High Speed Connector Sales Quantity by Type (2024-2029) & (K Units)
- Table 136. APAC High Speed Connector Sales Quantity Market Share by Type (2018-2023)
- Table 137. APAC High Speed Connector Sales Quantity Market Share by Type (2024-2029)
- Table 138. APAC High Speed Connector Revenue by Type (2018-2023) & (US$ Million)
- Table 139. APAC High Speed Connector Revenue by Type (2024-2029) & (US$ Million)
- Table 140. APAC High Speed Connector Revenue Market Share by Type (2018-2023)
- Table 141. APAC High Speed Connector Revenue Market Share by Type (2024-2029)
- Table 142. APAC High Speed Connector Sales Quantity by Application (2018-2023) & (K Units)
- Table 143. APAC High Speed Connector Sales Quantity by Application (2024-2029) & (K Units)
- Table 144. APAC High Speed Connector Sales Quantity Market Share by Application (2018-2023)
- Table 145. APAC High Speed Connector Sales Quantity Market Share by Application (2024-2029)
- Table 146. APAC High Speed Connector Revenue by Application (2018-2023) & (US$ Million)
- Table 147. APAC High Speed Connector Revenue by Application (2024-2029) & (US$ Million)
- Table 148. APAC High Speed Connector Revenue Market Share by Application (2018-2023)
- Table 149. APAC High Speed Connector Revenue Market Share by Application (2024-2029)
- Table 150. APAC High Speed Connector Revenue by Region: 2018 VS 2022 VS 2029 (US$ Million)
- Table 151. APAC High Speed Connector Revenue by Region (2018-2023) & (US$ Million)
- Table 152. APAC High Speed Connector Revenue by Region (2024-2029) & (US$ Million)
- Table 153. APAC High Speed Connector Revenue Share by Region (2018-2023)
- Table 154. APAC High Speed Connector Revenue Share by Region (2024-2029)
- Table 155. APAC High Speed Connector Sales Quantity by Region (2018-2023) & (K Units)
- Table 156. APAC High Speed Connector Sales Quantity by Region (2024-2029) & (K Units)
- Table 157. APAC High Speed Connector Sales Quantity Share by Region (2018-2023)
- Table 158. APAC High Speed Connector Sales Quantity Share by Region (2024-2029)
- Table 159. Middle East, Africa and Latin America High Speed Connector Revenue by Company (2018-2023) & (US$ Million)
- Table 160. Middle East, Africa and Latin America High Speed Connector Revenue Market Share by Company (2018-2023)
- Table 161. Middle East, Africa and Latin America High Speed Connector Sales Quantity by Company (2018-2023) & (K Units)
- Table 162. Middle East, Africa and Latin America High Speed Connector Sales Quantity by Type (2018-2023) & (K Units)
- Table 163. Middle East, Africa and Latin America High Speed Connector Sales Quantity by Type (2024-2029) & (K Units)
- Table 164. Middle East, Africa and Latin America High Speed Connector Sales Quantity Market Share by Type (2018-2023)
- Table 165. Middle East, Africa and Latin America High Speed Connector Sales Quantity Market Share by Type (2024-2029)
- Table 166. Middle East, Africa and Latin America High Speed Connector Revenue by Type (2018-2023) & (US$ Million)
- Table 167. Middle East, Africa and Latin America High Speed Connector Revenue by Type (2024-2029) & (US$ Million)
- Table 168. Middle East, Africa and Latin America High Speed Connector Revenue Market Share by Type (2018-2023)
- Table 169. Middle East, Africa and Latin America High Speed Connector Revenue Market Share by Type (2024-2029)
- Table 170. Middle East, Africa and Latin America High Speed Connector Sales Quantity by Application (2018-2023) & (K Units)
- Table 171. Middle East, Africa and Latin America High Speed Connector Sales Quantity by Application (2024-2029) & (K Units)
- Table 172. Middle East, Africa and Latin America High Speed Connector Sales Quantity Market Share by Application (2018-2023)
- Table 173. Middle East, Africa and Latin America High Speed Connector Sales Quantity Market Share by Application (2024-2029)
- Table 174. Middle East, Africa and Latin America High Speed Connector Revenue by Application (2018-2023) & (US$ Million)
- Table 175. Middle East, Africa and Latin America High Speed Connector Revenue by Application (2024-2029) & (US$ Million)
- Table 176. Middle East, Africa and Latin America High Speed Connector Revenue Market Share by Application (2018-2023)
- Table 177. Middle East, Africa and Latin America High Speed Connector Revenue Market Share by Application (2024-2029)
- Table 178. TE Connectivity Company Information
- Table 179. TE Connectivity High Speed Connector Sales Quantity (K Units), Revenue (US$ Million), Average Selling Price (ASP) & (US$/Unit) and Gross Margin (2018-2023)
- Table 180. TE Connectivity High Speed Connector Products and Services
- Table 181. Samtec Company Information
- Table 182. Samtec High Speed Connector Sales Quantity (K Units), Revenue (US$ Million), Average Selling Price (ASP) & (US$/Unit) and Gross Margin (2018-2023)
- Table 183. Samtec High Speed Connector Products and Services
- Table 184. Amphenol Company Information
- Table 185. Amphenol High Speed Connector Sales Quantity (K Units), Revenue (US$ Million), Average Selling Price (ASP) & (US$/Unit) and Gross Margin (2018-2023)
- Table 186. Amphenol High Speed Connector Products and Services
- Table 187. Molex Company Information
- Table 188. Molex High Speed Connector Sales Quantity (K Units), Revenue (US$ Million), Average Selling Price (ASP) & (US$/Unit) and Gross Margin (2018-2023)
- Table 189. Molex High Speed Connector Products and Services
- Table 190. Hirose Company Information
- Table 191. Hirose High Speed Connector Sales Quantity (K Units), Revenue (US$ Million), Average Selling Price (ASP) & (US$/Unit) and Gross Margin (2018-2023)
- Table 192. Hirose High Speed Connector Products and Services
- Table 193. Japan Aviation Electronics Industry Company Information
- Table 194. Japan Aviation Electronics Industry High Speed Connector Sales Quantity (K Units), Revenue (US$ Million), Average Selling Price (ASP) & (US$/Unit) and Gross Margin (2018-2023)
- Table 195. Japan Aviation Electronics Industry High Speed Connector Products and Services
- Table 196. Yamaichi Electronics Company Information
- Table 197. Yamaichi Electronics High Speed Connector Sales Quantity (K Units), Revenue (US$ Million), Average Selling Price (ASP) & (US$/Unit) and Gross Margin (2018-2023)
- Table 198. Yamaichi Electronics High Speed Connector Products and Services
- Table 199. Kyocera Company Information
- Table 200. Kyocera High Speed Connector Sales Quantity (K Units), Revenue (US$ Million), Average Selling Price (ASP) & (US$/Unit) and Gross Margin (2018-2023)
- Table 201. Kyocera High Speed Connector Products and Services
- Table 202. IMS Connector Systems Company Information
- Table 203. IMS Connector Systems High Speed Connector Sales Quantity (K Units), Revenue (US$ Million), Average Selling Price (ASP) & (US$/Unit) and Gross Margin (2018-2023)
- Table 204. IMS Connector Systems High Speed Connector Products and Services
- Table 205. Omron Company Information
- Table 206. Omron High Speed Connector Sales Quantity (K Units), Revenue (US$ Million), Average Selling Price (ASP) & (US$/Unit) and Gross Margin (2018-2023)
- Table 207. Omron High Speed Connector Products and Services
- Table 208. Smiths Interconnect Company Information
- Table 209. Smiths Interconnect High Speed Connector Sales Quantity (K Units), Revenue (US$ Million), Average Selling Price (ASP) & (US$/Unit) and Gross Margin (2018-2023)
- Table 210. Smiths Interconnect High Speed Connector Products and Services
- Table 211. IRISO Electronics Company Information
- Table 212. IRISO Electronics High Speed Connector Sales Quantity (K Units), Revenue (US$ Million), Average Selling Price (ASP) & (US$/Unit) and Gross Margin (2018-2023)
- Table 213. IRISO Electronics High Speed Connector Products and Services
- Table 214. Key Raw Materials Lists
- Table 215. Raw Materials Key Suppliers Lists
- Table 216. High Speed Connector Distributors List
- Table 217. High Speed Connector Customers List
- Table 218. High Speed Connector Market Trends
- Table 219. High Speed Connector Market Drivers
- Table 220. High Speed Connector Market Challenges
- Table 221. Research Programs/Design for This Report
- Table 222. Key Data Information from Secondary Sources
- Table 223. Key Data Information from Primary Sources
- Table 224. QYR Business Unit and Senior & Team Lead Analysts
List of Figures
- Figure 1. High Speed Connector Product Picture
- Figure 2. Global High Speed Connector Market Size by Type, 2018 VS 2022 VS 2029 (US$ Million)
- Figure 3. Global High Speed Connector Market Share by Type in 2022 & 2029
- Figure 4. Board-to-Board Connectors Product Picture
- Figure 5. Major Manufacturers of Board-to-Board Connectors
- Figure 6. Wire-to-Board Connectors Product Picture
- Figure 7. Global High Speed Connector Market Size Growth Rate by Application, 2018 VS 2022 VS 2029 (US$ Million)
- Figure 8. Global High Speed Connector Market Share by Application in 2022 & 2029
- Figure 9. Communication & IT
- Figure 10. Transportation
- Figure 11. Industrial
- Figure 12. Aerospace & Military
- Figure 13. High Speed Connector Report Years Considered
- Figure 14. Global High Speed Connector Revenue, (US$ Million), 2018 VS 2023 VS 2029
- Figure 15. Global High Speed Connector Revenue 2018-2029 (US$ Million)
- Figure 16. Global High Speed Connector Revenue Market Share by Region in Percentage: 2022 Versus 2029
- Figure 17. Global High Speed Connector Sales Quantity 2018-2029 (K Units)
- Figure 18. North America High Speed Connector Sales Quantity YoY (2018-2029) & (K Units)
- Figure 19. North America High Speed Connector Revenue YoY (2018-2029) & (US$ Million)
- Figure 20. Europe High Speed Connector Sales Quantity YoY (2018-2029) & (K Units)
- Figure 21. Europe High Speed Connector Revenue YoY (2018-2029) & (US$ Million)
- Figure 22. China High Speed Connector Sales Quantity YoY (2018-2029) & (K Units)
- Figure 23. China High Speed Connector Revenue YoY (2018-2029) & (US$ Million)
- Figure 24. APAC High Speed Connector Sales Quantity YoY (2018-2029) & (K Units)
- Figure 25. APAC High Speed Connector Revenue YoY (2018-2029) & (US$ Million)
- Figure 26. Middle East, Africa and Latin America High Speed Connector Sales Quantity YoY (2018-2029) & (K Units)
- Figure 27. Middle East, Africa and Latin America High Speed Connector Revenue YoY (2018-2029) & (US$ Million)
- Figure 28. Global High Speed Connector Production Value by Region: 2018 VS 2022 VS 2029 (US$ Million)
- Figure 29. Global High Speed Connector Production Value Market Share by Region in Percentage: 2022 Versus 2029
- Figure 30. Global High Speed Connector Production by Region: 2018 VS 2022 VS 2029 (K Units)
- Figure 31. Global High Speed Connector Production Market Share by Region in Percentage: 2022 Versus 2029
- Figure 32. High Speed Connector Production Growth Rate in North America (2018-2029) & (K Units)
- Figure 33. High Speed Connector Production Growth Rate in Europe (2018-2029) & (K Units)
- Figure 34. High Speed Connector Production Growth Rate in China (2018-2029) & (K Units)
- Figure 35. High Speed Connector Production Growth Rate in Japan (2018-2029) & (K Units)
- Figure 36. The Top 10 and Top 5 Players Market Share by High Speed Connector Sales in 2022
- Figure 37. The Top 10 and Top 5 Players Market Share by High Speed Connector Revenue in 2022
- Figure 38. High Speed Connector Market Share by Company Type (Tier 1, Tier 2, and Tier 3): 2018 VS 2022
- Figure 39. North America High Speed Connector Sales Quantity Market Share by Company (2018-2023)
- Figure 40. United States High Speed Connector Revenue (2018-2029) & (US$ Million)
- Figure 41. Canada High Speed Connector Revenue (2018-2029) & (US$ Million)
- Figure 42. Europe High Speed Connector Sales Quantity Market Share by Company (2018-2023)
- Figure 43. Germany High Speed Connector Revenue (2018-2029) & (US$ Million)
- Figure 44. France High Speed Connector Revenue (2018-2029) & (US$ Million)
- Figure 45. U.K. High Speed Connector Revenue (2018-2029) & (US$ Million)
- Figure 46. Italy High Speed Connector Revenue (2018-2029) & (US$ Million)
- Figure 47. China High Speed Connector Sales Quantity Market Share by Company (2018-2023)
- Figure 48. APAC High Speed Connector Sales Quantity Market Share by Company (2018-2023)
- Figure 49. Japan High Speed Connector Revenue (2018-2029) & (US$ Million)
- Figure 50. South Korea High Speed Connector Revenue (2018-2029) & (US$ Million)
- Figure 51. China Taiwan High Speed Connector Revenue (2018-2029) & (US$ Million)
- Figure 52. Southeast Asia High Speed Connector Revenue (2018-2029) & (US$ Million)
- Figure 53. India High Speed Connector Revenue (2018-2029) & (US$ Million)
- Figure 54. Middle East, Africa and Latin America High Speed Connector Sales Quantity Market Share by Company (2018-2023)
- Figure 55. High Speed Connector Value Chain
- Figure 56. High Speed Connector Production Process
- Figure 57. Global Channels of Distribution (Direct Vs Distribution) & (2018-2029)
- Figure 58. Distributors Profiles
- Figure 59. Bottom-up and Top-down Approaches for This Report
- Figure 60. Data Triangulation
- Figure 61. Key Executives Interviewed
The global High Speed Connector market size was US$ 2.33 billion in 2022 and is forecast to a readjusted size of US$ 3.17 billion by 2029 with a CAGR of 6.15% during the forecast period 2023-2029.
The United States market for High Speed Connector is estimated to increase from $ 769.18 million in 2023 to reach $ 1.10 billion by 2029, at a CAGR of 6.99% during the forecast period of 2023 through 2029.
The China market for High Speed Connector is estimated to increase from $ 525.06 million in 2023 to reach $ 721.40 million by 2029, at a CAGR of 6.33% during the forecast period of 2023 through 2029.
The Europe market for High Speed Connector is estimated to increase from $ 567.36 million in 2023 to reach $ 698.27 million by 2029, at a CAGR of 4.51% during the forecast period of 2023 through 2029.
The global key manufacturers of High Speed Connector include TE Connectivity, Samtec, Amphenol, Molex, Hirose, Japan Aviation Electronics Industry, Yamaichi Electronics, Kyocera, and IMS Connector Systems, etc. In 2022, the global top five players hold a share approximately 61.52% in sales volume, and in term of revenue of High Speed Connector, the top five companies hold a share nearly 63.55%.
In terms of production side, this report researches the High Speed Connector capacity, production, growth rate, market share by manufacturers and regional level and country level, from 2018 to 2023, and forecast to 2029.
In terms of sales (consumption) side, this report focuses on the sales of High Speed Connector by regions (Countries), company, by Type and by Application. from 2018 to 2023 and forecast to 2029.
The global High Speed Connector market is thoroughly, accurately, and comprehensively assessed in the report with a large focus on market dynamics, market competition, regional growth, segmental analysis, and key growth strategies. Buyers of the report will have access to verified market figures, including global market size in terms of revenue and volume. As part of production analysis, the authors of the report have provided reliable estimations and calculations for global revenue and volume by Type segment of the global High Speed Connector market. These figures have been provided in terms of both revenue and volume for the period 2018-2029. Additionally, the report provides accurate figures for production by region in terms of revenue as well as volume for the same period. The report also includes production capacity statistics for the same period.
By Company
- TE Connectivity
- Samtec
- Amphenol
- Molex
- Hirose
- Japan Aviation Electronics Industry
- Yamaichi Electronics
- Kyocera
- IMS Connector Systems
- Omron
- Smiths Interconnect
- IRISO Electronics
Segment by Type
- Board-to-Board Connectors
- Wire-to-Board Connectors
- Others
Segment by Application
- Communication & IT
- Transportation
- Industrial
- Aerospace & Military
- Others
Production by Region
- North America
- Europe
- China
- Japan
- South Korea
Sales by Region
- North America
- United States
- Canada
- China
- APAC (excluding China)
- Japan
- South Korea
- China Taiwan
- Southeast Asia
- India
- Europe
- Germany
- France
- U.K.
- Italy
- Middle East & Africa, Latin America
Chapter Outline:
- Chapter 1: Introduces the report scope of the report, executive summary of different market segments (by Type and by Application, etc), including the market size of each market segment, future development potential, and so on. It offers a high-level view of the current state of the market and its likely evolution in the short to mid-term, and long term.
- Chapter 2: Sales (consumption), revenue of High Speed Connector in global, regional level and country level. It provides a quantitative analysis of the market size and development potential of each region and its main countries and introduces the market development, future development prospects, market space of each country in the world.
- Chapter 3: High Speed Connector production/output of global and key producers (regions/countries). It provides a quantitative analysis of the production, and development potential of each producer in the next six years.
- Chapter 4: Detailed analysis of High Speed Connector manufacturers competitive landscape, price, sales, revenue, market share and industry ranking, latest development plan, merger, and acquisition information, etc.
- Chapter 5: Provides the analysis of various market segments by Type, covering the sales, revenue, average price, and development potential of each market segment, to help readers find the blue ocean market in different market segments.
- Chapter 6: Provides the analysis of various market segments by Application, covering the sales, revenue, average price, and development potential of each market segment, to help readers find the blue ocean market in different downstream markets.
- Chapter 7: North America by company, by Type, by Application and by country, sales, and revenue for each segment.
- Chapter 8: Europe by company, by Type, by Application and by country, sales, and revenue for each segment.
- Chapter 9: China by company, by Type, and by Application, sales, and revenue for each segment.
- Chapter 10: APAC (excluding China) by company, by Type, by Application and by country, sales, and revenue for each segment.
- Chapter 11: Middle East, Africa, and Latin America by company, by Type, by Application and by country, sales, and revenue for each segment.
- Chapter 12: Provides profiles of key manufacturers, introducing the basic situation of the main companies in the market in detail, including product descriptions and specifications, High Speed Connector sales, revenue, price, gross margin, etc.
- Chapter 13: Analysis of industrial chain, sales channel, key raw materials, distributors, and customers.
- Chapter 14: Introduces the market dynamics, latest developments of the market, the driving factors and restrictive factors of the market, the challenges and risks faced by manufacturers in the industry, and the analysis of relevant policies in the industry.
- Chapter 15: The main points and conclusions of the report.
Table of Contents
1 Report Overview
- 1.1 High Speed Connector Definition
- 1.2 Market by Type
- 1.2.1 Global High Speed Connector Market Size Growth Rate by Type, 2018 VS 2022 VS 2029
- 1.2.2 Board-to-Board Connectors
- 1.2.3 Wire-to-Board Connectors
- 1.2.4 Others
- 1.3 Market by Application
- 1.3.1 Global High Speed Connector Market Size Growth Rate by Application, 2018 VS 2022 VS 2029
- 1.3.2 Communication & IT
- 1.3.3 Transportation
- 1.3.4 Industrial
- 1.3.5 Aerospace & Military
- 1.3.6 Others
- 1.4 Assumptions and Limitations
- 1.5 Study Objectives
- 1.6 Years Considered
2 Global High Speed Connector Sales
- 2.1 Global High Speed Connector Revenue Estimates and Forecasts 2018-2029
- 2.2 Global High Speed Connector Revenue by Region: 2018 VS 2022 VS 2029
- 2.3 Global High Speed Connector Revenue by Region
- 2.3.1 Global High Speed Connector Revenue by Region (2018-2023)
- 2.3.2 Global High Speed Connector Revenue by Region (2024-2029)
- 2.4 Global High Speed Connector Sales Quantity Estimates and Forecasts 2018-2029
- 2.5 Global High Speed Connector Sales Quantity by Region: 2018 VS 2022 VS 2029
- 2.6 Global High Speed Connector Sales Quantity by Region
- 2.6.1 Global High Speed Connector Sales Quantity by Region (2018-2023)
- 2.6.2 Global High Speed Connector Sales Quantity by Region (2024-2029)
- 2.7 North America
- 2.8 Europe
- 2.9 China
- 2.10 APAC (excluding China)
- 2.11 Middle East, Africa and Latin America
3 Global Production (Based on Production Site)
- 3.1 Global High Speed Connector Production Value by Region: 2018 VS 2022 VS 2029
- 3.2 Global High Speed Connector Production Value by Region
- 3.2.1 Global High Speed Connector Historic Production Value by Region (2018-2023)
- 3.2.2 Global High Speed Connector Forecasted Production Value by Region (2024-2029)
- 3.3 Global High Speed Connector Production by Region: 2018 VS 2022 VS 2029
- 3.4 Global High Speed Connector Production by Region
- 3.4.1 Global High Speed Connector Historic Production by Region (2018-2023)
- 3.4.2 Global High Speed Connector Forecasted Production by Region (2024-2029)
- 3.4.3 North America
- 3.4.4 Europe
- 3.4.5 China
- 3.4.6 Japan
4 Competition by Manufacturers
- 4.1 Global High Speed Connector Sales Quantity by Manufacturers
- 4.1.1 Global High Speed Connector Sales Quantity by Manufacturers (2018-2023)
- 4.1.2 Global High Speed Connector Sales Quantity Share by Manufacturers (2018-2023)
- 4.1.3 Global Top 10 and Top 5 Companies by High Speed Connector Sales in 2022
- 4.2 Global High Speed Connector Revenue by Manufacturers
- 4.2.1 Global High Speed Connector Revenue by Manufacturers (2018-2023)
- 4.2.2 Global High Speed Connector Revenue Share by Manufacturers (2018-2023)
- 4.2.3 Global Top 10 and Top 5 Companies by High Speed Connector Revenue in 2022
- 4.3 Global High Speed Connector Sales Price by Manufacturers
- 4.4 Global Key Players of High Speed Connector, Industry Ranking, 2021 VS 2022
- 4.5 Analysis of Competitive Landscape
- 4.5.1 Manufacturers Market Concentration Ratio (CR5 and HHI)
- 4.5.2 Global High Speed Connector Market Share by Company Type (Tier 1, Tier 2, and Tier 3)
- 4.6 Global Key Manufacturers of High Speed Connector, Manufacturing Base Distribution and Headquarters
- 4.7 Global Key Manufacturers of High Speed Connector, Product Offered
- 4.8 Global Key Manufacturers of High Speed Connector Found Date
- 4.9 Mergers & Acquisitions, Expansion Plans
5 Estimates and Forecasts by Type
- 5.1 Global High Speed Connector Sales Quantity by Type
- 5.1.1 Global High Speed Connector Historical Sales Quantity by Type (2018-2023)
- 5.1.2 Global High Speed Connector Forecasted Sales Quantity by Type (2024-2029)
- 5.1.3 Global High Speed Connector Sales Quantity Market Share by Type (2018-2029)
- 5.2 Global High Speed Connector Revenue by Type
- 5.2.1 Global High Speed Connector Historical Revenue by Type (2018-2023)
- 5.2.2 Global High Speed Connector Forecasted Revenue by Type (2024-2029)
- 5.2.3 Global High Speed Connector Revenue Market Share by Type (2018-2029)
- 5.3 Global High Speed Connector Price by Type
- 5.3.1 Global High Speed Connector Price by Type (2018-2023)
- 5.3.2 Global High Speed Connector Price Forecast by Type (2024-2029)
6 Market Size by Application
- 6.1 Global High Speed Connector Sales Quantity by Application
- 6.1.1 Global High Speed Connector Historical Sales Quantity by Application (2018-2023)
- 6.1.2 Global High Speed Connector Forecasted Sales Quantity by Application (2024-2029)
- 6.1.3 Global High Speed Connector Sales Quantity Market Share by Application (2018-2029)
- 6.2 Global High Speed Connector Revenue by Application
- 6.2.1 Global High Speed Connector Historical Revenue by Application (2018-2023)
- 6.2.2 Global High Speed Connector Forecasted Revenue by Application (2024-2029)
- 6.2.3 Global High Speed Connector Revenue Market Share by Application (2018-2029)
- 6.3 Global High Speed Connector Price by Application
- 6.3.1 Global High Speed Connector Price by Application (2018-2023)
- 6.3.2 Global High Speed Connector Price Forecast by Application (2024-2029)
7 North America
- 7.1 North America High Speed Connector Sales by Company
- 7.1.1 North America High Speed Connector Revenue by Company (2018-2023)
- 7.1.2 North America High Speed Connector Sales Quantity by Company (2018-2023)
- 7.2 North America High Speed Connector Market Size by Type
- 7.2.1 North America High Speed Connector Sales Quantity by Type (2018-2029)
- 7.2.2 North America High Speed Connector Revenue by Type (2018-2029)
- 7.3 North America High Speed Connector Market Size by Application
- 7.3.1 North America High Speed Connector Sales Quantity by Application (2018-2029)
- 7.3.2 North America High Speed Connector Revenue by Application (2018-2029)
- 7.4 North America High Speed Connector Market Size by Country
- 7.4.1 North America High Speed Connector Revenue by Country: 2018 VS 2022 VS 2029
- 7.4.2 North America High Speed Connector Revenue by Country (2018-2029)
- 7.4.3 North America High Speed Connector Sales Quantity by Country (2018-2029)
- 7.4.4 United States
- 7.4.5 Canada
8 Europe
- 8.1 Europe High Speed Connector Sales by Company
- 8.1.1 Europe High Speed Connector Revenue by Company (2018-2023)
- 8.1.2 Europe High Speed Connector Sales Quantity by Company (2018-2023)
- 8.2 Europe High Speed Connector Market Size by Type
- 8.2.1 Europe High Speed Connector Sales Quantity by Type (2018-2029)
- 8.2.2 Europe High Speed Connector Revenue by Type (2018-2029)
- 8.3 Europe High Speed Connector Market Size by Application
- 8.3.1 Europe High Speed Connector Sales Quantity by Application (2018-2029)
- 8.3.2 Europe High Speed Connector Revenue by Application (2018-2029)
- 8.4 Europe High Speed Connector Market Size by Country
- 8.4.1 Europe High Speed Connector Revenue by Country: 2018 VS 2022 VS 2029
- 8.4.2 Europe High Speed Connector Revenue by Country (2018-2029)
- 8.4.3 Europe High Speed Connector Sales Quantity by Country (2018-2029)
- 8.4.4 Germany
- 8.4.5 France
- 8.4.6 U.K.
- 8.4.7 Italy
9 China
- 9.1 China High Speed Connector Sales by Company
- 9.1.1 China High Speed Connector Revenue by Company (2018-2023)
- 9.1.2 China High Speed Connector Sales Quantity by Company (2018-2023)
- 9.2 China High Speed Connector Market Size by Type
- 9.2.1 China High Speed Connector Sales Quantity by Type (2018-2029)
- 9.2.2 China High Speed Connector Revenue by Type (2018-2029)
- 9.3 China High Speed Connector Market Size by Application
- 9.3.1 China High Speed Connector Sales Quantity by Application (2018-2029)
- 9.3.2 China High Speed Connector Revenue by Application (2018-2029)
10 APAC (excluding China)
- 10.1 APAC High Speed Connector Sales by Company
- 10.1.1 APAC High Speed Connector Revenue by Company (2018-2023)
- 10.1.2 APAC High Speed Connector Sales Quantity by Company (2018-2023)
- 10.2 APAC High Speed Connector Market Size by Type
- 10.2.1 APAC High Speed Connector Sales Quantity by Type (2018-2029)
- 10.2.2 APAC High Speed Connector Revenue by Type (2018-2029)
- 10.3 APAC High Speed Connector Market Size by Application
- 10.3.1 APAC High Speed Connector Sales Quantity by Application (2018-2029)
- 10.3.2 APAC High Speed Connector Revenue by Application (2018-2029)
- 10.4 APAC High Speed Connector Market Size by Region
- 10.4.1 APAC High Speed Connector Revenue by Region: 2018 VS 2022 VS 2029
- 10.4.2 APAC High Speed Connector Revenue by Region (2018-2029)
- 10.4.3 APAC High Speed Connector Sales Quantity by Region (2018-2029)
- 10.4.4 Japan
- 10.4.5 South Korea
- 10.4.6 China Taiwan
- 10.4.7 Southeast Asia
- 10.4.8 India
11 Middle East, Africa and Latin America
- 11.1 Middle East, Africa and Latin America High Speed Connector Sales by Company
- 11.1.1 Middle East, Africa and Latin America High Speed Connector Revenue by Company (2018-2023)
- 11.1.2 Middle East, Africa and Latin America High Speed Connector Sales Quantity by Company (2018-2023)
- 11.2 Middle East, Africa and Latin America High Speed Connector Market Size by Type
- 11.2.1 Middle East, Africa and Latin America High Speed Connector Sales Quantity by Type (2018-2029)
- 11.2.2 Middle East, Africa and Latin America High Speed Connector Revenue by Type (2018-2029)
- 11.3 Middle East, Africa and Latin America High Speed Connector Market Size by Application
- 11.3.1 Middle East, Africa and Latin America High Speed Connector Sales Quantity by Application (2018-2029)
- 11.3.2 Middle East, Africa and Latin America High Speed Connector Revenue by Application (2018-2029)
12 Company Profiles
- 12.1 TE Connectivity
- 12.1.1 TE Connectivity Company Information
- 12.1.2 TE Connectivity Overview
- 12.1.3 TE Connectivity High Speed Connector Sales Quantity, Revenue, Price and Gross Margin (2018-2023)
- 12.1.4 TE Connectivity High Speed Connector Products and Services
- 12.2 Samtec
- 12.2.1 Samtec Company Information
- 12.2.2 Samtec Overview
- 12.2.3 Samtec High Speed Connector Sales Quantity, Revenue, Price and Gross Margin (2018-2023)
- 12.2.4 Samtec High Speed Connector Products and Services
- 12.3 Amphenol
- 12.3.1 Amphenol Company Information
- 12.3.2 Amphenol Overview
- 12.3.3 Amphenol High Speed Connector Sales Quantity, Revenue, Price and Gross Margin (2018-2023)
- 12.3.4 Amphenol High Speed Connector Products and Services
- 12.4 Molex
- 12.4.1 Molex Company Information
- 12.4.2 Molex Overview
- 12.4.3 Molex High Speed Connector Sales Quantity, Revenue, Price and Gross Margin (2018-2023)
- 12.4.4 Molex High Speed Connector Products and Services
- 12.5 Hirose
- 12.5.1 Hirose Company Information
- 12.5.2 Hirose Overview
- 12.5.3 Hirose High Speed Connector Sales Quantity, Revenue, Price and Gross Margin (2018-2023)
- 12.5.4 Hirose High Speed Connector Products and Services
- 12.6 Japan Aviation Electronics Industry
- 12.6.1 Japan Aviation Electronics Industry Company Information
- 12.6.2 Japan Aviation Electronics Industry Overview
- 12.6.3 Japan Aviation Electronics Industry High Speed Connector Sales Quantity, Revenue, Price and Gross Margin (2018-2023)
- 12.6.4 Japan Aviation Electronics Industry High Speed Connector Products and Services
- 12.7 Yamaichi Electronics
- 12.7.1 Yamaichi Electronics Company Information
- 12.7.2 Yamaichi Electronics Overview
- 12.7.3 Yamaichi Electronics High Speed Connector Sales Quantity, Revenue, Price and Gross Margin (2018-2023)
- 12.7.4 Yamaichi Electronics High Speed Connector Products and Services
- 12.8 Kyocera
- 12.8.1 Kyocera Company Information
- 12.8.2 Kyocera Overview
- 12.8.3 Kyocera High Speed Connector Sales Quantity, Revenue, Price and Gross Margin (2018-2023)
- 12.8.4 Kyocera High Speed Connector Products and Services
- 12.9 IMS Connector Systems
- 12.9.1 IMS Connector Systems Company Information
- 12.9.2 IMS Connector Systems Overview
- 12.9.3 IMS Connector Systems High Speed Connector Sales Quantity, Revenue, Price and Gross Margin (2018-2023)
- 12.9.4 IMS Connector Systems High Speed Connector Products and Services
- 12.10 Omron
- 12.10.1 Omron Company Information
- 12.10.2 Omron Overview
- 12.10.3 Omron High Speed Connector Sales Quantity, Revenue, Price and Gross Margin (2018-2023)
- 12.10.4 Omron High Speed Connector Products and Services
- 12.11 Smiths Interconnect
- 12.11.1 Smiths Interconnect Company Information
- 12.11.2 Smiths Interconnect Overview
- 12.11.3 Smiths Interconnect High Speed Connector Sales Quantity, Revenue, Price and Gross Margin (2018-2023)
- 12.11.4 Smiths Interconnect High Speed Connector Products and Services
- 12.12 IRISO Electronics
- 12.12.1 IRISO Electronics Company Information
- 12.12.2 IRISO Electronics Overview
- 12.12.3 IRISO Electronics High Speed Connector Sales Quantity, Revenue, Price and Gross Margin (2018-2023)
- 12.12.4 IRISO Electronics High Speed Connector Products and Services
13 Value Chain and Sales Channels Analysis
- 13.1 High Speed Connector Value Chain Analysis
- 13.2 High Speed Connector Key Raw Materials
- 13.2.1 Key Raw Materials
- 13.2.2 Raw Materials Key Suppliers
- 13.3 High Speed Connector Production Mode & Process
- 13.4 High Speed Connector Sales and Marketing
- 13.4.1 High Speed Connector Sales Channels
- 13.4.2 High Speed Connector Distributors
- 13.5 High Speed Connector Customers
14 High Speed Connector Market Dynamics
- 14.1 High Speed Connector Industry Trends
- 14.2 High Speed Connector Market Drivers
- 14.3 High Speed Connector Market Challenges
15 Key Findings
16 Appendix
- 16.1 Research Methodology
- 16.1.1 Methodology/Research Approach
- 16.1.2 Data Source
- 16.2 Author Details
- 16.3 Disclaimer