|
|
市場調査レポート
商品コード
1212717
熱収縮ラベルの世界市場:市場規模、メーカー、サプライチェーン、販売チャネル、顧客 (2023年~2029年)Global Heat Shrink Labels Market Size, Manufacturers, Supply Chain, Sales Channel and Clients, 2023-2029 |
||||||
|
|
|||||||
|
● お客様のご希望に応じて、既存データの加工や未掲載情報(例:国別セグメント)の追加などの対応が可能です。 詳細はお問い合わせください。 |
|||||||


| 熱収縮ラベルの世界市場:市場規模、メーカー、サプライチェーン、販売チャネル、顧客 (2023年~2029年) |
|
出版日: 2023年02月07日
発行: QYResearch
ページ情報: 英文 141 Pages
納期: 2~3営業日
|
- 全表示
- 概要
- 図表
- 目次
世界の熱収縮ラベルの市場規模は、2022年の80億4,962万米ドルから、2029年には111億7,287万米ドルに達し、2023年から2029年の間に4.67%のCAGRで成長すると予測されています。
当レポートでは、世界の熱収縮ラベルの市場について分析し、種類別・用途別・地域別 (国別) の市場動向の見通し (2018年~2029年)、主要企業のプロファイルなどについて調査しております。
目次
第1章 調査範囲
- 熱収縮ラベル:製品概略
- 種類別の市場
- 市場規模・成長率:種類別 (2018年・2022年・2029年)
- PVC (ポリ塩化ビニル)
- PETG (グリコール変性PET)
- OPS (配向ポリスチレン)
- PE (ポリエチレン)
- PP (ポリプロピレン)
- COC (環状オレフィンコポリマー) フィルム
- 用途別の市場
- 市場規模・成長率:用途別 (2018年・2022年・2029年)
- 食品・飲料
- 医薬品
- パーソナルケア
- 分析対象
- 分析期間
第2章 エグゼクティブサマリー
- 世界の熱収縮ラベルの市場規模、推定・予測
- 世界の熱収縮ラベルの収益 (2018年~2029年)
- 世界の熱収縮ラベルの販売 (2018年~2029年)
- 熱収縮ラベルの市場規模:地域別 (2022年・2029年)
- 熱収縮ラベルの販売:地域別 (2018年~2029年)
- 世界の熱収縮ラベルの販売:地域別 (2018年~2023年)
- 世界の熱収縮ラベルの販売予測:地域別 (2024年~2029年)
- 世界の熱収縮ラベルの販売・市場シェア:地域別 (2018年~2029年)
- 熱収縮ラベル市場の推計・予測:地域別 (2024年~2029年)
- 世界の熱収縮ラベルの収益:地域別 (2018年~2023年)
- 世界の熱収縮ラベルの収益予測:地域別 (2024年~2029年)
- 世界の熱収縮ラベルの収益・市場シェア:地域別 (2018年~2029年)
第3章 世界の熱収縮ラベル:メーカー別
- 世界の熱収縮ラベルの大手メーカーの販売 (2018年~2023年)
- 世界の熱収縮ラベルの大手メーカーの収益 (2018年~2023年)
- 世界の熱収縮ラベルの価格:メーカー別 (2018年~2023年)
- 競合情勢
- 世界の熱収縮ラベルメーカーの製造拠点
- メーカーの企業合併・買収 (M&A)、拡張計画
第4章 企業プロファイル
- Fuji Seal
- CCL Industries
- Multi-Color
- Klockner Pentaplast
- Huhtamaki
- Clondalkin Group
- Brook &Whittle
- WestRock
- Fort Dearborn Company
- Yinjinda
- Jinghong
- Chengxin
- Zijiang
第5章 種類別の内訳データ
- 世界の熱収縮ラベルの販売:種類別 (2018年~2029年)
- 世界の熱収縮ラベルの収益予測:種類別 (2018年~2029年)
- 世界の熱収縮ラベルの平均販売価格 (ASP):種類別 (2018年~2029年)
第6章 用途別の内訳データ
- 世界の熱収縮ラベルの生産:用途別 (2018年~2029年)
- 世界の熱収縮ラベルの収益予測:用途別 (2018年~2029年)
- 世界の熱収縮ラベルの平均販売価格 (ASP):用途別 (2018年~2029年)
第7章 北米
- 熱収縮ラベルの市場規模・対前年成長率 (YoY) (2018年~2029年)
- 熱収縮ラベル市場:国別の詳細データ
- 熱収縮ラベルの販売:国別 (2018年~2029年)
- 熱収縮ラベルの収益:国別 (2018年~2029年)
- 熱収縮ラベルの販売:種類別 (2018年~2023年)
- 熱収縮ラベルの販売:用途別 (2018年~2023年)
第8章 アジア太平洋
第9章 欧州
第10章 ラテンアメリカ
第11章 中東・アフリカ
第12章 サプライチェーン・販売チャネルの分析
- 熱収縮ラベルのサプライチェーン分析
- 熱収縮ラベルの主要な原材料と上流工程のサプライヤー
- 熱収縮ラベルの製造工程の分析
- 熱収縮ラベルのクライアント分析
- 熱収縮ラベルの販売チャネルと販売モデルの分析
- 熱収縮ラベルの流通チャネルの分析:間接販売 vs 直接販売
- 熱収縮ラベルの流通業者
第13章 熱収縮ラベルの市場力学
- 熱収縮ラベル産業の動向
- 熱収縮ラベル市場の促進要因
- 熱収縮ラベル市場の課題
- 熱収縮ラベル市場の抑制要因
第14章 調査結果と結論
第15章 付録
List of Tables
- Table 1. Global Heat Shrink Labels Market Size Growth Rate by Type (US$ Million): 2018 VS 2022 VS 2029
- Table 2. Global Heat Shrink Labels Market Size Growth by Application (US$ Million): 2018 VS 2022 VS 2029
- Table 3. Global Heat Shrink Labels Market Size by Region (US$ Million): 2022 VS 2029
- Table 4. Global Heat Shrink Labels Sales by Region (2018-2023) & (Million Sq.m)
- Table 5. Global Heat Shrink Labels Sales Forecast by Region (2024-2029) & (Million Sq.m)
- Table 6. Global Heat Shrink Labels Revenue by Region (2018-2023) & (US$ Million)
- Table 7. Global Heat Shrink Labels Revenue Forecast by Region (2024-2029) & (US$ Million)
- Table 8. Global Heat Shrink Labels Sales by Manufacturer (2018-2023) & (Million Sq.m)
- Table 9. Global Heat Shrink Labels Sales Share by Manufacturer (2018-2023)
- Table 10. Heat Shrink Labels Revenue by Manufacturer (2018-2023) & (US$ Million)
- Table 11. Heat Shrink Labels Revenue Share by Manufacturer (2018-2023)
- Table 12. Key Manufacturers Heat Shrink Labels Price (2018-2023) & (USD/K Sq.m)
- Table 13. Ranking of Global Top Heat Shrink Labels Manufacturers by Revenue (US$ Million) in 2022
- Table 14. Global Heat Shrink Labels Manufacturers Market Concentration Ratio (CR5 and HHI) & (2018-2023)
- Table 15. Global Heat Shrink Labels by Company Type (Tier 1, Tier 2, and Tier 3) & (based on the Revenue in Heat Shrink Labels as of 2022)
- Table 16. Heat Shrink Labels Manufacturers Manufacturing Base Distribution and Headquarters
- Table 17. Date of International Manufacturers Enter into Heat Shrink Labels Market
- Table 18. Manufacturers Mergers & Acquisitions, Expansion Plans
- Table 19. Fuji Seal Company Information
- Table 20. Fuji Seal Description and Business Overview
- Table 21. Fuji Seal Heat Shrink Labels Sales (Million Sq.m), Revenue (US$ Million), Price (USD/K Sq.m) and Gross Margin (2018-2023)
- Table 22. Fuji Seal Sales Proportion of Heat Shrink Labels by Product in 2022
- Table 23. Fuji Seal Sales Proportion of Heat Shrink Labels by Application in 2022
- Table 24. Fuji Seal Sales Proportion of Heat Shrink Labels by Geographic Area in 2022
- Table 25. CCL Industries Company Information
- Table 26. CCL Industries Description and Business Overview
- Table 27. CCL Industries Heat Shrink Labels Sales (Million Sq.m), Revenue (US$ Million), Price (USD/K Sq.m) and Gross Margin (2018-2023)
- Table 28. CCL Industries Sales Proportion of Heat Shrink Labels by Product in 2022
- Table 29. CCL Industries Sales Proportion of Heat Shrink Labels by Application in 2022
- Table 30. CCL Industries Sales Proportion of Heat Shrink Labels by Geographic Area in 2022
- Table 31. CCL Industries Recent Developments
- Table 32. Multi-Color Company Information
- Table 33. Multi-Color Description and Business Overview
- Table 34. Multi-Color Heat Shrink Labels Sales (Million Sq.m), Revenue (US$ Million), Price (USD/K Sq.m) and Gross Margin (2018-2023)
- Table 35. Multi-Color Sales Proportion of Heat Shrink Labels by Product in 2022
- Table 36. Multi-Color Sales Proportion of Heat Shrink Labels by Application in 2022
- Table 37. Multi-Color Sales Proportion of Heat Shrink Labels by Geographic Area in 2022
- Table 38. Multi-Color Recent Developments
- Table 39. Klockner Pentaplast Company Information
- Table 40. Klockner Pentaplast Description and Business Overview
- Table 41. Klockner Pentaplast Heat Shrink Labels Sales (Million Sq.m), Revenue (US$ Million), Price (USD/K Sq.m) and Gross Margin (2018-2023)
- Table 42. Klockner Pentaplast Sales Proportion of Heat Shrink Labels by Product in 2022
- Table 43. Klockner Pentaplast Sales Proportion of Heat Shrink Labels by Application in 2022
- Table 44. Klockner Pentaplast Sales Proportion of Heat Shrink Labels by Geographic Area in 2022
- Table 45. Huhtamaki Company Information
- Table 46. Huhtamaki Description and Business Overview
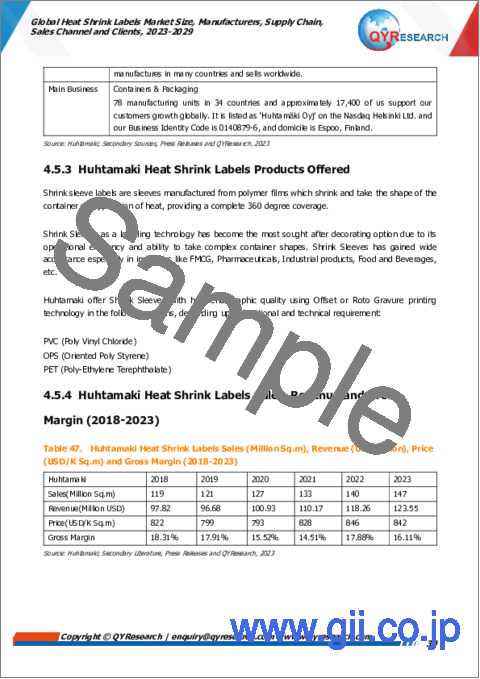
- Table 47. Huhtamaki Heat Shrink Labels Sales (Million Sq.m), Revenue (US$ Million), Price (USD/K Sq.m) and Gross Margin (2018-2023)
- Table 48. Huhtamaki Sales Proportion of Heat Shrink Labels by Product in 2022
- Table 49. Huhtamaki Sales Proportion of Heat Shrink Labels by Application in 2022
- Table 50. Huhtamaki Sales Proportion of Heat Shrink Labels by Geographic Area in 2022
- Table 51. Clondalkin Group Company Information
- Table 52. Clondalkin Group Description and Business Overview
- Table 53. Clondalkin Group Heat Shrink Labels Sales (Million Sq.m), Revenue (US$ Million), Price (USD/K Sq.m) and Gross Margin (2018-2023)
- Table 54. Clondalkin Group Sales Proportion of Heat Shrink Labels by Product in 2022
- Table 55. Clondalkin Group Sales Proportion of Heat Shrink Labels by Application in 2022
- Table 56. Clondalkin Group Sales Proportion of Heat Shrink Labels by Geographic Area in 2022
- Table 57. Brook & Whittle Company Information
- Table 58. Brook & Whittle Description and Business Overview
- Table 59. Brook & Whittle Heat Shrink Labels Sales (Million Sq.m), Revenue (US$ Million), Price (USD/K Sq.m) and Gross Margin (2018-2023)
- Table 60. Brook & Whittle Sales Proportion of Heat Shrink Labels by Product in 2022
- Table 61. Brook & Whittle Sales Proportion of Heat Shrink Labels by Application in 2022
- Table 62. Brook & Whittle Sales Proportion of Heat Shrink Labels by Geographic Area in 2022
- Table 63. Brook & Whittle Recent Developments
- Table 64. WestRock Company Information
- Table 65. WestRock Description and Business Overview
- Table 66. WestRock Heat Shrink Labels Sales (Million Sq.m), Revenue (US$ Million), Price (USD/K Sq.m) and Gross Margin (2018-2023)
- Table 67. WestRock Sales Proportion of Heat Shrink Labels by Product in 2022
- Table 68. WestRock Sales Proportion of Heat Shrink Labels by Application in 2022
- Table 69. WestRock Sales Proportion of Heat Shrink Labels by Geographic Area in 2022
- Table 70. WestRock Recent Developments
- Table 71. Fort Dearborn Company Company Information
- Table 72. Fort Dearborn Company Description and Business Overview
- Table 73. Fort Dearborn Company Heat Shrink Labels Sales (Million Sq.m), Revenue (US$ Million), Price (USD/K Sq.m) and Gross Margin (2018-2023)
- Table 74. Fort Dearborn Company Sales Proportion of Heat Shrink Labels by Product in 2022
- Table 75. Fort Dearborn Company Sales Proportion of Heat Shrink Labels by Application in 2022
- Table 76. Fort Dearborn Company Sales Proportion of Heat Shrink Labels by Geographic Area in 2022
- Table 77. Fort Dearborn Company Recent Developments
- Table 78. Yinjinda Company Information
- Table 79. Yinjinda Description and Business Overview
- Table 80. Yinjinda Heat Shrink Labels Sales (Million Sq.m), Revenue (US$ Million), Price (USD/K Sq.m) and Gross Margin (2018-2023)
- Table 81. Yinjinda Sales Proportion of Heat Shrink Labels by Product in 2022
- Table 82. Yinjinda Sales Proportion of Heat Shrink Labels by Application in 2022
- Table 83. Yinjinda Sales Proportion of Heat Shrink Labels by Geographic Area in 2022
- Table 84. Jinghong Company Information
- Table 85. Jinghong Description and Business Overview
- Table 86. Jinghong Heat Shrink Labels Sales (Million Sq.m), Revenue (US$ Million), Price (USD/K Sq.m) and Gross Margin (2018-2023)
- Table 87. Jinghong Sales Proportion of Heat Shrink Labels by Product in 2022
- Table 88. Jinghong Sales Proportion of Heat Shrink Labels by Application in 2022
- Table 89. Jinghong Sales Proportion of Heat Shrink Labels by Geographic Area in 2022
- Table 90. Chengxin Company Information
- Table 91. Chengxin Description and Business Overview
- Table 92. Chengxin Heat Shrink Labels Product
- Table 93. Chengxin Heat Shrink Labels Sales (Million Sq.m), Revenue (US$ Million), Price (USD/K Sq.m) and Gross Margin (2018-2023)
- Table 94. Chengxin Sales Proportion of Heat Shrink Labels by Product in 2022
- Table 95. Chengxin Sales Proportion of Heat Shrink Labels by Application in 2022
- Table 96. Chengxin Sales Proportion of Heat Shrink Labels by Geographic Area in 2022
- Table 97. Zijiang Company Information
- Table 98. Zijiang Description and Business Overview
- Table 99. Zijiang Heat Shrink Labels Sales (Million Sq.m), Revenue (US$ Million), Price (USD/K Sq.m) and Gross Margin (2018-2023)
- Table 100. Zijiang Sales Proportion of Heat Shrink Labels by Product in 2022
- Table 101. Zijiang Sales Proportion of Heat Shrink Labels by Application in 2022
- Table 102. Zijiang Sales Proportion of Heat Shrink Labels by Geographic Area in 2022
- Table 103. Global Heat Shrink Labels Sales by Type (2018-2023) & (Million Sq.m)
- Table 104. Global Heat Shrink Labels Sales Forecast by Type (2024-2029) & (Million Sq.m)
- Table 105. Global Heat Shrink Labels Revenue by Type (2018-2023) & (US$ Million)
- Table 106. Global Heat Shrink Labels Revenue Forecast by Type (2024-2029) & (US$ Million)
- Table 107. Heat Shrink Labels Average Selling Price (ASP) by Type (2018-2023) & (USD/K Sq.m)
- Table 108. Heat Shrink Labels Average Selling Price (ASP) by Type (2024-2029) & (USD/K Sq.m)
- Table 109. Global Heat Shrink Labels Sales by Application (2018-2023) & (Million Sq.m)
- Table 110. Global Heat Shrink Labels Sales Forecast by Application (2024-2029) & (Million Sq.m)
- Table 111. Global Heat Shrink Labels Revenue by Application (2018-2023) & (US$ Million)
- Table 112. Global Heat Shrink Labels Revenue Forecast by Application (2024-2029) & (US$ Million)
- Table 113. Heat Shrink Labels Average Selling Price (ASP) by Application (2018-2023) & (USD/K Sq.m)
- Table 114. Heat Shrink Labels Average Selling Price (ASP) by Application (2024-2029) & (USD/K Sq.m)
- Table 115. North America Heat Shrink Labels Sales by Country (2018-2023) & (Million Sq.m)
- Table 116. North America Heat Shrink Labels Sales by Country (2024-2029) & (Million Sq.m)
- Table 117. North America Heat Shrink Labels Revenue by Country (2018-2023) & (US$ Million)
- Table 118. North America Heat Shrink Labels Revenue by Country (2024-2029) & (US$ Million)
- Table 119. North America Heat Shrink Labels Sales by Type (2018-2023) & (Million Sq.m)
- Table 120. North America Heat Shrink Labels Sales by Application (2018-2023) & (Million Sq.m)
- Table 121. Asia-Pacific Heat Shrink Labels Sales by Region (2018-2023) & (Million Sq.m)
- Table 122. Asia-Pacific Heat Shrink Labels Sales by Region (2024-2029) & (Million Sq.m)
- Table 123. Asia-Pacific Heat Shrink Labels Revenue by Region (2018-2023) & (US$ Million)
- Table 124. Asia-Pacific Heat Shrink Labels Revenue by Region (2024-2029) & (US$ Million)
- Table 125. Asia-Pacific Heat Shrink Labels Sales by Type (2018-2023) & (Million Sq.m)
- Table 126. Asia-Pacific Heat Shrink Labels Sales by Application (2018-2023) & (Million Sq.m)
- Table 127. Europe Heat Shrink Labels Sales by Country (2018-2023) & (Million Sq.m)
- Table 128. Europe Heat Shrink Labels Sales by Country (2024-2029) & (Million Sq.m)
- Table 129. Europe Heat Shrink Labels Revenue by Country (2018-2023) & (US$ Million)
- Table 130. Europe Heat Shrink Labels Revenue by Country (2024-2029) & (US$ Million)
- Table 131. Europe Heat Shrink Labels Sales by Type (2018-2023) & (Million Sq.m)
- Table 132. Europe Heat Shrink Labels Sales by Application (2018-2023) & (Million Sq.m)
- Table 133. Latin America Heat Shrink Labels Sales by Country (2018-2023) & (Million Sq.m)
- Table 134. Latin America Heat Shrink Labels Sales by Country (2024-2029) & (Million Sq.m)
- Table 135. Latin America Heat Shrink Labels Revenue by Country (2018-2023) & (US$ Million)
- Table 136. Latin America Heat Shrink Labels Revenue by Country (2024-2029) & (US$ Million)
- Table 137. Latin America Heat Shrink Labels Sales by Type (2018-2023) & (Million Sq.m)
- Table 138. Latin America Heat Shrink Labels Sales by Application (2018-2023) & (Million Sq.m)
- Table 139. Middle East and Africa Heat Shrink Labels Sales by Country (2018-2023) & (Million Sq.m)
- Table 140. Middle East and Africa Heat Shrink Labels Sales by Country (2024-2029) & (Million Sq.m)
- Table 141. Middle East and Africa Heat Shrink Labels Revenue by Country (2018-2023) & (US$ Million)
- Table 142. Middle East and Africa Heat Shrink Labels Revenue by Country (2024-2029) & (US$ Million)
- Table 143. Middle East and Africa Heat Shrink Labels Sales by Type (2018-2023) & (Million Sq.m)
- Table 144. Middle East and Africa Heat Shrink Labels Sales by Application (2018-2023) & (Million Sq.m)
- Table 145. Key Raw Materials Lists
- Table 146. Raw Materials Key Suppliers Lists
- Table 147. Heat Shrink Labels Typical Clients
- Table 148. Heat Shrink Labels Distributors
- Table 149. Heat Shrink Labels Market Trends
- Table 150. Heat Shrink Labels Market Drivers
- Table 151. Heat Shrink Labels Market Challenges
- Table 152. Heat Shrink Labels Market Restraints
- Table 153. Research Programs/Design for This Report
- Table 154. Key Data Information from Secondary Sources
- Table 155. Key Data Information from Primary Sources
- Table 156. QYR Business Unit and Senior & Team Lead Analysts
List of Figures
- Figure 1. Heat Shrink Labels Product Picture
- Figure 2. Global Heat Shrink Labels Market Size by Type (US$ Million): 2018 VS 2022 VS 2029
- Figure 3. Global Heat Shrink Labels Sales Market Share by Type in 2022 & 2029
- Figure 4. PVC Product Picture
- Figure 5. PETG Product Picture
- Figure 6. OPS Product Picture
- Figure 7. COC Films Product Picture
- Figure 8. Global Heat Shrink Labels Market Size by Application (US$ Million): 2018 VS 2022 VS 2029
- Figure 9. Global Heat Shrink Labels Sales Market Share by Application in 2022 & 2029
- Figure 10. Food & Beverage
- Figure 11. Pharmaceuticals
- Figure 12. Personal Care
- Figure 13. Heat Shrink Labels Report Years Considered
- Figure 14. Global Heat Shrink Labels Revenue, (US$ Million), 2018 VS 2022 VS 2029
- Figure 15. Global Heat Shrink Labels Market Size 2018-2029 (US$ Million)
- Figure 16. Global Heat Shrink Labels Sales 2018-2029 (Million Sq.m)
- Figure 17. Global Heat Shrink Labels Sales Market Share Forecast by Region (2018-2029)
- Figure 18. Global Heat Shrink Labels Revenue Market Share by Region (2018-2029)
- Figure 19. Global Heat Shrink Labels Sales Share by Manufacturer in 2022
- Figure 20. Fuji Seal Heat Shrink Labels Product
- Figure 21. Multi-Color Heat Shrink Labels Product
- Figure 22. Clondalkin Group Heat Shrink Labels Product
- Figure 23. Brook & Whittle Heat Shrink Labels Product
- Figure 24. WestRock Heat Shrink Labels Product
- Figure 25. Fort Dearborn Company Heat Shrink Labels Product
- Figure 26. Yinjinda Heat Shrink Labels Product
- Figure 27. Jinghong Heat Shrink Labels Product
- Figure 28. Zijiang Heat Shrink Labels Product
- Figure 29. Global Heat Shrink Labels Sales Market Share Forecast by Type (2018-2029)
- Figure 30. Global Heat Shrink Labels Revenue Market Share Forecast by Type (2018-2029)
- Figure 31. Global Heat Shrink Labels Sales Market Share Forecast by Application (2018-2029)
- Figure 32. Global Heat Shrink Labels Revenue Market Share Forecast by Application (2018-2029)
- Figure 33. North America Heat Shrink Labels Revenue 2018-2029 (US$ Million)
- Figure 34. North America Heat Shrink Labels Sales Market Share by Type (2018-2023)
- Figure 35. North America Heat Shrink Labels Sales Market Share by Application (2018-2023)
- Figure 36. Asia-Pacific Heat Shrink Labels Revenue 2018-2029 (US$ Million)
- Figure 37. Asia-Pacific Heat Shrink Labels Sales Market Share by Region (2018-2029)
- Figure 38. Asia-Pacific Heat Shrink Labels Revenue Market Share by Region (2018-2029)
- Figure 39. Asia-Pacific Heat Shrink Labels Sales Market Share by Type (2018-2023)
- Figure 40. Asia-Pacific Heat Shrink Labels Sales Market Share by Application (2018-2023)
- Figure 41. Europe Heat Shrink Labels Revenue Growth Rate 2018-2029 (US$ Million)
- Figure 42. Europe Heat Shrink Labels Sales Market Share by Country (2018-2029)
- Figure 43. Europe Heat Shrink Labels Revenue Market Share by Country (2018-2029)
- Figure 44. Europe Heat Shrink Labels Sales Market Share by Type (2018-2023)
- Figure 45. Europe Heat Shrink Labels Sales Market Share by Application (2018-2023)
- Figure 46. Latin America Heat Shrink Labels Revenue Growth Rate 2018-2029 (US$ Million)
- Figure 47. Latin America Heat Shrink Labels Sales Market Share by Country (2018-2029)
- Figure 48. Latin America Heat Shrink Labels Revenue Market Share by Country (2018-2023)
- Figure 49. Latin America Heat Shrink Labels Sales Market Share by Type (2018-2023)
- Figure 50. Latin America Heat Shrink Labels Sales Market Share by Application (2018-2023)
- Figure 51. Middle East and Africa Heat Shrink Labels Revenue Growth Rate 2018-2029 (US$ Million)
- Figure 52. Middle East and Africa Heat Shrink Labels Sales Market Share by Country (2018-2029)
- Figure 53. Middle East and Africa Heat Shrink Labels Revenue Market Share by Country (2018-2029)
- Figure 54. Middle East and Africa Heat Shrink Labels Sales Market Share by Type (2018-2023)
- Figure 55. Middle East and Africa Heat Shrink Labels Sales Market Share by Application (2018-2023)
- Figure 56. Heat Shrink Labels Supply Chain (Upstream and Downstream Market)
- Figure 57. Key Raw Materials PVC Resin Price Trend (RMB/MT)
- Figure 58. Manufacturing Process Analysis of Shrink Film for Beverage Multipacks
- Figure 59. Manufacturing Process Analysis of Heat Shrink Labels
- Figure 60. Heat Shrink Labels Distribution Channels
- Figure 61. Global Heat Shrink Labels Percentage 2022: Indirect Sales VS Direct Sales
- Figure 62. Bottom-up and Top-down Approaches for This Report
- Figure 63. Data Triangulation
- Figure 64. Key Executives Interviewed
In 2022, the global Heat Shrink Labels market size was increased to US$ 8,049.62 million, and it will reach US$ 11,172.87 million in 2029, growing at CAGR of 4.67% between 2023 and 2029.
Report Scope
This report aims to provide a comprehensive presentation of the global market for Heat Shrink Labels, with both quantitative and qualitative analysis, to help readers develop business/growth strategies, assess the market competitive situation, analyze their position in the current marketplace, and make informed business decisions regarding Heat Shrink Labels.
The Heat Shrink Labels market size, estimations, and forecasts are provided in terms of sales volume (Million Sq.m) and revenue ($ millions), considering 2022 as the base year, with history and forecast data for the period from 2018 to 2029. This report segments the global Heat Shrink Labels market comprehensively. Regional market sizes, concerning products by Type, by Application, and by players, are also provided. The influence of COVID-19 and the Russia-Ukraine War were considered while estimating market sizes.
For a more in-depth understanding of the market, the report provides profiles of the competitive landscape, key competitors, and their respective market ranks. The report also discusses technological trends and new product developments.
The report will help the Heat Shrink Labels manufacturers, new entrants, and industry chain related companies in this market with information on the revenues, sales volume, and average price for the overall market and the sub-segments across the different segments, by company, by Type, by Application, and regions.
By Company
- Fuji Seal
- CCL Industries
- Multi-Color
- Klockner Pentaplast
- Huhtamaki
- Clondalkin Group
- Brook & Whittle
- WestRock
- Fort Dearborn Company
- Yinjinda
- Jinghong
- Chengxin
Segment by Type
- PVC
- PETG
- OPS
- PE
- PP
- COC Films
- Others
Segment by Application
- Food & Beverage
- Pharmaceuticals
- Personal Care
- Others
By Region
- North America
- United States
- Canada
- Asia-Pacific
- China
- Japan
- Korea
- India
- Southeast Asia
- Australia
- Rest of Asia-Pacific
- Europe
- Germany
- France
- U.K.
- Italy
- Russia
- Rest of Europe
- Latin America
- Mexico
- Brazil
- Rest of Latin America
- Middle East & Africa
Table of Contents
1 Study Coverage
- 1.1 Heat Shrink Labels Product Introduction
- 1.2 Market by Type
- 1.2.1 Global Heat Shrink Labels Market Size Growth Rate by Type (2018 VS 2022 VS 2029)
- 1.2.2 PVC
- 1.2.3 PETG
- 1.2.4 OPS
- 1.2.5 PE
- 1.2.6 PP
- 1.2.7 COC Films
- 1.3 Market by Application
- 1.3.1 Global Heat Shrink Labels Market Size Growth Rate by Application (2018 VS 2022 VS 2029)
- 1.3.2 Food & Beverage
- 1.3.3 Pharmaceuticals
- 1.3.4 Personal Care
- 1.4 Study Objectives
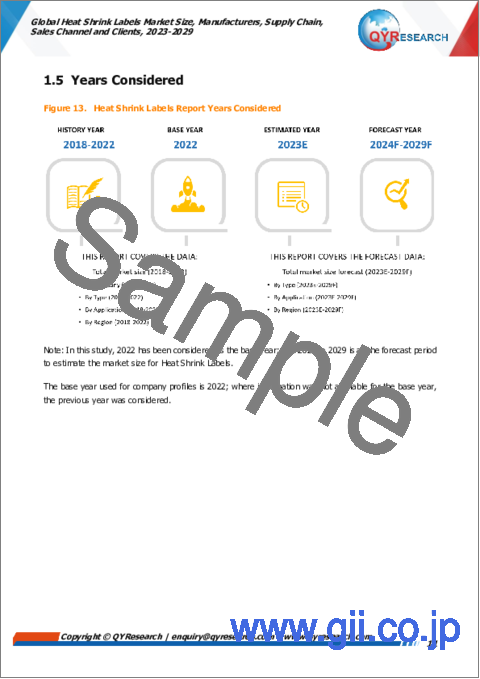
- 1.5 Years Considered
2 Executive Summary
- 2.1 Global Heat Shrink Labels Market Size Estimates and Forecasts
- 2.1.1 Global Heat Shrink Labels Revenue 2018-2029
- 2.1.2 Global Heat Shrink Labels Sales 2018-2029
- 2.2 Heat Shrink Labels Market Size by Region: 2022 Versus 2029
- 2.3 Heat Shrink Labels Sales by Region (2018-2029)
- 2.3.1 Global Heat Shrink Labels Sales by Region: 2018-2023
- 2.3.2 Global Heat Shrink Labels Sales Forecast by Region (2024-2029)
- 2.3.3 Global Heat Shrink Labels Sales Market Share by Region (2018-2029)
- 2.4 Heat Shrink Labels Market Estimates and Projections by Region (2024-2029)
- 2.4.1 Global Heat Shrink Labels Revenue by Region: 2018-2023
- 2.4.2 Global Heat Shrink Labels Revenue Forecast by Region (2024-2029)
- 2.4.3 Global Heat Shrink Labels Revenue Market Share by Region (2018-2029)
3 Global Heat Shrink Labels by Manufacturers
- 3.1 Global Top Heat Shrink Labels Manufacturers by Sales (2018-2023)
- 3.1.1 Global Heat Shrink Labels Sales by Manufacturer (2018-2023)
- 3.1.2 Global Heat Shrink Labels Sales Market Share by Manufacturer (2018-2023)
- 3.2 Global Top Heat Shrink Labels Manufacturers by Revenue (2018-2023)
- 3.2.1 Global Heat Shrink Labels Revenue by Manufacturer (2018-2023)
- 3.2.2 Global Heat Shrink Labels Revenue Share by Manufacturer (2018-2023)
- 3.3 Global Heat Shrink Labels Price by Manufacturer (2018-2023)
- 3.4 Competitive Landscape
- 3.4.1 Key Heat Shrink Labels Manufacturers Covered: Ranking by Revenue
- 3.4.2 Global Heat Shrink Labels Market Concentration Ratio (CR5 and HHI) & (2018-2023)
- 3.4.3 Global Heat Shrink Labels Market Share by Company Type (Tier 1, Tier 2, and Tier 3)
- 3.5 Global Heat Shrink Labels Manufacturing Base Distribution
- 3.5.1 Heat Shrink Labels Manufacturers Manufacturing Base Distribution
- 3.5.2 Date of International Manufacturers Enter into Heat Shrink Labels Market
- 3.6 Manufacturers Mergers & Acquisitions, Expansion Plans
4 Company Profiles
- 4.1 Fuji Seal
- 4.1.1 Fuji Seal Company Information
- 4.1.2 Fuji Seal Description, Business Overview
- 4.1.3 Fuji Seal Heat Shrink Labels Products Offered
- 4.1.4 Fuji Seal Heat Shrink Labels Sales, Revenue and Gross Margin (2018-2023)
- 4.1.5 Fuji Seal Heat Shrink Labels Sales by Product in 2022
- 4.1.6 Fuji Seal Heat Shrink Labels Sales by Application in 2022
- 4.1.7 Fuji Seal Heat Shrink Labels Sales by Geographic Area in 2022
- 4.2 CCL Industries
- 4.2.1 CCL Industries Company Information
- 4.2.2 CCL Industries Description, Business Overview
- 4.2.3 CCL Industries Heat Shrink Labels Products Offered
- 4.2.4 CCL Industries Heat Shrink Labels Sales, Revenue and Gross Margin (2018-2023)
- 4.2.5 CCL Industries Heat Shrink Labels Sales by Product in 2022
- 4.2.6 CCL Industries Heat Shrink Labels Sales by Application in 2022
- 4.2.7 CCL Industries Heat Shrink Labels Sales by Geographic Area in 2022
- 4.2.8 CCL Industries Recent Developments
- 4.3 Multi-Color
- 4.3.1 Multi-Color Company Information
- 4.3.2 Multi-Color Description, Business Overview
- 4.3.3 Multi-Color Heat Shrink Labels Products Offered
- 4.3.4 Multi-Color Heat Shrink Labels Sales, Revenue and Gross Margin (2018-2023)
- 4.3.5 Multi-Color Heat Shrink Labels Sales by Product in 2022
- 4.3.6 Multi-Color Heat Shrink Labels Sales by Application in 2022
- 4.3.7 Multi-Color Heat Shrink Labels Sales by Geographic Area in 2022
- 4.3.8 Multi-Color Recent Developments
- 4.4 Klockner Pentaplast
- 4.4.1 Klockner Pentaplast Company Information
- 4.4.2 Klockner Pentaplast Description, Business Overview
- 4.4.3 Klockner Pentaplast Heat Shrink Labels Products Offered
- 4.4.4 Klockner Pentaplast Heat Shrink Labels Sales, Revenue and Gross Margin (2018-2023)
- 4.4.5 Klockner Pentaplast Heat Shrink Labels Sales by Product in 2022
- 4.4.6 Klockner Pentaplast Heat Shrink Labels Sales by Application in 2022
- 4.4.7 Klockner Pentaplast Heat Shrink Labels Sales by Geographic Area in 2022
- 4.5 Huhtamaki
- 4.5.1 Huhtamaki Company Information
- 4.5.2 Huhtamaki Description, Business Overview
- 4.5.3 Huhtamaki Heat Shrink Labels Products Offered
- 4.5.4 Huhtamaki Heat Shrink Labels Sales, Revenue and Gross Margin (2018-2023)
- 4.5.5 Huhtamaki Heat Shrink Labels Sales by Product in 2022
- 4.5.6 Huhtamaki Heat Shrink Labels Sales by Application in 2022
- 4.5.7 Huhtamaki Heat Shrink Labels Sales by Geographic Area in 2022
- 4.6 Clondalkin Group
- 4.6.1 Clondalkin Group Company Information
- 4.6.2 Clondalkin Group Description, Business Overview
- 4.6.3 Clondalkin Group Heat Shrink Labels Products Offered
- 4.6.4 Clondalkin Group Heat Shrink Labels Sales, Revenue and Gross Margin (2018-2023)
- 4.6.5 Clondalkin Group Heat Shrink Labels Sales by Product in 2022
- 4.6.6 Clondalkin Group Heat Shrink Labels Sales by Application in 2022
- 4.6.7 Clondalkin Group Heat Shrink Labels Sales by Geographic Area in 2022
- 4.7 Brook & Whittle
- 4.7.1 Brook & Whittle Company Information
- 4.7.2 Brook & Whittle Description, Business Overview
- 4.7.3 Brook & Whittle Heat Shrink Labels Products Offered
- 4.7.4 Brook & Whittle Heat Shrink Labels Sales, Revenue and Gross Margin (2018-2023)
- 4.7.5 Brook & Whittle Heat Shrink Labels Sales by Product in 2022
- 4.7.6 Brook & Whittle Heat Shrink Labels Sales by Application in 2022
- 4.7.7 Brook & Whittle Heat Shrink Labels Sales by Geographic Area in 2022
- 4.7.8 Brook & Whittle Recent Developments
- 4.8 WestRock
- 4.8.1 WestRock Company Information
- 4.8.2 WestRock Description, Business Overview
- 4.8.3 WestRock Heat Shrink Labels Products Offered
- 4.8.4 WestRock Heat Shrink Labels Sales, Revenue and Gross Margin (2018-2023)
- 4.8.5 WestRock Heat Shrink Labels Sales by Product in 2022
- 4.8.6 WestRock Heat Shrink Labels Sales by Application in 2022
- 4.8.7 WestRock Heat Shrink Labels Sales by Geographic Area in 2022
- 4.8.8 WestRock Recent Developments
- 4.9 Fort Dearborn Company
- 4.9.1 Fort Dearborn Company Company Information
- 4.9.2 Fort Dearborn Company Description, Business Overview
- 4.9.3 Fort Dearborn Company Heat Shrink Labels Products Offered
- 4.9.4 Fort Dearborn Company Heat Shrink Labels Sales, Revenue and Gross Margin (2018-2023)
- 4.9.5 Fort Dearborn Company Heat Shrink Labels Sales by Product in 2022
- 4.9.6 Fort Dearborn Company Heat Shrink Labels Sales by Application in 2022
- 4.9.7 Fort Dearborn Company Heat Shrink Labels Sales by Geographic Area in 2022
- 4.9.8 Fort Dearborn Company Recent Developments
- 4.10 Yinjinda
- 4.10.1 Yinjinda Company Information
- 4.10.2 Yinjinda Description, Business Overview
- 4.10.3 Yinjinda Heat Shrink Labels Products Offered
- 4.10.4 Yinjinda Heat Shrink Labels Sales, Revenue and Gross Margin (2018-2023)
- 4.10.5 Yinjinda Heat Shrink Labels Sales by Product in 2022
- 4.10.6 Yinjinda Heat Shrink Labels Sales by Application in 2022
- 4.10.7 Yinjinda Heat Shrink Labels Sales by Geographic Area in 2022
- 4.11 Jinghong
- 4.11.1 Jinghong Company Information
- 4.11.2 Jinghong Description, Business Overview
- 4.11.3 Jinghong Heat Shrink Labels Products Offered
- 4.11.4 Jinghong Heat Shrink Labels Sales, Revenue and Gross Margin (2018-2023)
- 4.11.5 Jinghong Heat Shrink Labels Sales by Product in 2022
- 4.11.6 Jinghong Heat Shrink Labels Sales by Application in 2022
- 4.11.7 Jinghong Heat Shrink Labels Sales by Geographic Area in 2022
- 4.12 Chengxin
- 4.12.1 Chengxin Company Information
- 4.12.2 Chengxin Description, Business Overview
- 4.12.3 Chengxin Heat Shrink Labels Products Offered
- 4.12.4 Chengxin Heat Shrink Labels Sales, Revenue and Gross Margin (2018-2023)
- 4.12.5 Chengxin Heat Shrink Labels Sales by Product in 2022
- 4.12.6 Chengxin Heat Shrink Labels Sales by Application in 2022
- 4.12.7 Chengxin Heat Shrink Labels Sales by Geographic Area in 2022
- 4.13 Zijiang
- 4.13.1 Zijiang Company Information
- 4.13.2 Zijiang Description, Business Overview
- 4.13.3 Zijiang Heat Shrink Labels Products Offered
- 4.13.4 Zijiang Heat Shrink Labels Sales, Revenue and Gross Margin (2018-2023)
- 4.13.5 Zijiang Heat Shrink Labels Sales by Product in 2022
- 4.13.6 Zijiang Heat Shrink Labels Sales by Application in 2022
- 4.13.7 Zijiang Heat Shrink Labels Sales by Geographic Area in 2022
5 Breakdown Data by Type
- 5.1 Global Heat Shrink Labels Sales by Type (2018-2029)
- 5.1.1 Global Heat Shrink Labels Sales by Type (2018-2023)
- 5.1.2 Global Heat Shrink Labels Sales Forecast by Type (2024-2029)
- 5.1.3 Global Heat Shrink Labels Sales Market Share by Type (2018-2029)
- 5.2 Global Heat Shrink Labels Revenue Forecast by Type (2018-2029)
- 5.2.1 Global Heat Shrink Labels Revenue by Type (2018-2023)
- 5.2.2 Global Heat Shrink Labels Revenue Forecast by Type (2024-2029)
- 5.2.3 Global Heat Shrink Labels Revenue Market Share by Type (2018-2029)
- 5.3 Heat Shrink Labels Average Selling Price (ASP) by Type (2018-2029)
6 Breakdown Data by Application
- 6.1 Global Heat Shrink Labels Sales by Application (2018-2029)
- 6.1.1 Global Heat Shrink Labels Sales by Application (2018-2023)
- 6.1.2 Global Heat Shrink Labels Sales Forecast by Application (2024-2029)
- 6.1.3 Global Heat Shrink Labels Sales Market Share by Application (2018-2029)
- 6.2 Global Heat Shrink Labels Revenue Forecast by Application (2018-2029)
- 6.2.1 Global Heat Shrink Labels Revenue by Application (2018-2023)
- 6.2.2 Global Heat Shrink Labels Revenue Forecast by Application (2024-2029)
- 6.2.3 Global Heat Shrink Labels Revenue Market Share by Application (2018-2029)
- 6.3 Heat Shrink Labels Average Selling Price (ASP) by Application (2018-2029)
7 North America
- 7.1 North America Heat Shrink Labels Market Size YoY Growth 2018-2029
- 7.2 North America Heat Shrink Labels Market Facts & Figures by Country
- 7.2.1 North America Heat Shrink Labels Sales by Country (2018-2029)
- 7.2.2 North America Heat Shrink Labels Revenue by Country (2018-2029)
- 7.3 North America Heat Shrink Labels Sales by Type (2018-2023)
- 7.4 North America Heat Shrink Labels Sales by Application (2018-2023)
8 Asia-Pacific
- 8.1 Asia-Pacific Heat Shrink Labels Market Size YoY Growth 2018-2029
- 8.2 Asia-Pacific Heat Shrink Labels Market Facts & Figures by Region
- 8.2.1 Asia-Pacific Heat Shrink Labels Sales by Region (2018-2029)
- 8.2.2 Asia-Pacific Heat Shrink Labels Revenue by Region (2018-2029)
- 8.3 Asia-Pacific Heat Shrink Labels Sales by Type (2018-2023)
- 8.4 Asia-Pacific Heat Shrink Labels Sales by Application (2018-2023)
9 Europe
- 9.1 Europe Heat Shrink Labels Market Size YoY Growth 2018-2029
- 9.2 Europe Heat Shrink Labels Market Facts & Figures by Country
- 9.2.1 Europe Heat Shrink Labels Sales by Country (2018-2029)
- 9.2.2 Europe Heat Shrink Labels Revenue by Country (2018-2029)
- 9.3 Europe Heat Shrink Labels Sales by Type (2018-2023)
- 9.4 Europe Heat Shrink Labels Sales by Application (2018-2023)
10 Latin America
- 10.1 Latin America Heat Shrink Labels Market Size YoY Growth 2018-2029
- 10.2 Latin America Heat Shrink Labels Market Facts & Figures by Country
- 10.2.1 Latin America Heat Shrink Labels Sales by Country (2018-2029)
- 10.2.2 Latin America Heat Shrink Labels Revenue by Country (2018-2029)
- 10.3 Latin America Heat Shrink Labels Sales by Type (2018-2023)
- 10.4 Latin America Heat Shrink Labels Sales by Application (2018-2023)
11 Middle East and Africa
- 11.1 Middle East and Africa Heat Shrink Labels Market Size YoY Growth 2018-2029
- 11.2 Middle East and Africa Heat Shrink Labels Market Facts & Figures by Country
- 11.2.1 Middle East and Africa Heat Shrink Labels Sales by Country (2018-2029)
- 11.2.2 Middle East and Africa Heat Shrink Labels Revenue by Country (2018-2029)
- 11.3 Middle East and Africa Heat Shrink Labels Sales by Type (2018-2023)
- 11.4 Middle East and Africa Heat Shrink Labels Sales by Application (2018-2023)
12 Supply Chain and Sales Channel analysis
- 12.1 Heat Shrink Labels Supply Chain Analysis
- 12.2 Heat Shrink Labels Key Raw Materials and Upstream Suppliers
- 12.2.1 Key Raw Materials Price
- 12.2.2 Raw Materials Key Suppliers
- 12.3 Manufacturing Process Analysis of Heat Shrink Labels
- 12.4 Heat Shrink Labels Clients Analysis
- 12.5 Heat Shrink Labels Sales Channel and Sales Model Analysis
- 12.5.1 Heat Shrink Labels Distribution Channel Analysis: Indirect Sales VS Direct Sales
- 12.5.2 Heat Shrink Labels Distributors
13 Heat Shrink Labels Market Dynamics
- 13.1 Heat Shrink Labels Industry Trends
- 13.2 Heat Shrink Labels Market Drivers
- 13.3 Heat Shrink Labels Market Challenges
- 13.4 Heat Shrink Labels Market Restraints
14 Research Findings and Conclusion
15 Appendix
- 15.1 Research Methodology
- 15.1.1 Methodology/Research Approach
- 15.1.2 Data Source
- 15.2 Author Details
- 15.3 Disclaimer