|
|
市場調査レポート
商品コード
1206282
皮膚画像診断システムの世界市場の分析 (2023年)Global Skin Imaging Systems Market Research Report 2023 |
||||||
|
|
|||||||
|
● お客様のご希望に応じて、既存データの加工や未掲載情報(例:国別セグメント)の追加などの対応が可能です。 詳細はお問い合わせください。 |
|||||||


| 皮膚画像診断システムの世界市場の分析 (2023年) |
|
出版日: 2023年01月30日
発行: QYResearch
ページ情報: 英文 131 Pages
納期: 2~3営業日
|
- 全表示
- 概要
- 図表
- 目次
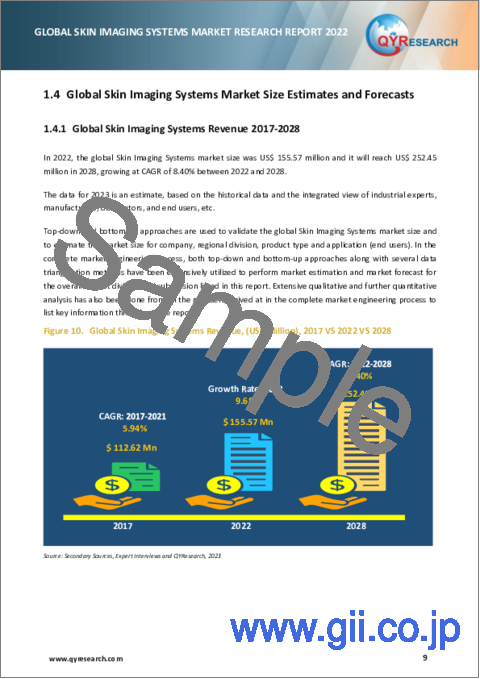
世界の皮膚画像診断システムの市場規模は、COVID-19の大流行により、2022年に1億5,557万米ドル、2028年には2億5,245万米ドルに再調整され、予測期間中 (2022年~2028年) に8.40%のCAGRで成長する、と予測されています。
この健康危機による経済変化を十分に考慮すると、2022年に世界市場の91.53%を占めた3Dは、2028年までに2億3,464万米ドルの規模に達し、2022年から2028年までの間に改訂8.68%のCAGRで成長する、と予測されています。一方、皮膚治療センター部門は、この予測期間を通して9.20%のCAGRに変更されています。
当レポートでは、世界の皮膚画像診断システムの市場について分析し、種類別・用途別・地域別 (国別) の市場動向の見通し (2017年~2028年)、主要企業のプロファイルなどについて調査しております。
目次
第1章 皮膚画像診断システム:市場概要
- 皮膚画像診断システム:製品の概要と範囲
- 種類別のセグメント
- 販売成長率の比較:種類別 (2022年~2028年)
- 3D
- 2D
- 用途別のセグメント
- 販売の比較:用途別 (2022年~2028年)
- 病院
- 美容サロン
- 皮膚治療センター
- その他
- 世界の皮膚画像診断システムの市場規模:推定・予測
- 収益:推定・予測 (2017年~2028年)
- 販売:推定・予測 (2017年~2028年)
- 市場規模:地域別 (2017年・2022年・2028年)
第2章 皮膚画像診断システム:メーカー別の市場競争
- 販売・市場シェア:メーカー別 (2017年~2022年)
- 収益・市場シェア:メーカー別 (2017年~2022年)
- 平均価格:メーカー別 (2017年~2022年)
- 皮膚画像診断システムメーカーの製造拠点・提供エリア・製品種類
- 皮膚画像診断システム市場の競争状況と動向
- メーカーの企業合併・買収 (M&A)、拡張計画
第3章 皮膚画像診断システム市場:地域別の遡及的シナリオ
- 販売の遡及的シナリオ:地域別 (2017年~2022年)
- 収益の遡及的シナリオ:地域別 (2017年~2022年)
- 北米の皮膚画像診断システム市場:国別の詳細分析
- 米国
- カナダ
- 欧州の皮膚画像診断システム市場:国別の詳細分析
- ドイツ
- フランス
- 英国
- イタリア
- ロシア
- アジア太平洋の皮膚画像診断システム市場:国別の詳細分析
- 中国
- 日本
- 韓国
- 東南アジア
- インド
- オーストラリア
- ラテンアメリカの皮膚画像診断システム市場:国別の詳細分析
- メキシコ
- ブラジル
- 中東・アフリカの皮膚画像診断システム市場:国別の詳細分析
- 中東
- アフリカ
第4章 皮膚画像診断システム:過去の市場分析、種類別
- 販売・市場シェア:種類別 (2017年~2022年)
- 収益・市場シェア:種類別 (2017年~2022年)
- 価格:種類別 (2017年~2022年)
第5章 皮膚画像診断システム:過去の市場分析、用途別
- 販売・市場シェア:用途別 (2017年~2022年)
- 収益・市場シェア:用途別 (2017年~2022年)
- 価格:用途別 (2017年~2022年)
第6章 主要企業のプロファイル
- CANFIELD SCIENTIFIC, INC
- 企業情報
- 企業概略・事業概要
- 販売・収益・粗利益 (2017年~2022年)
- 製品ポートフォリオ
- 昨今の動向
- FOTOFINDER SYSTEMS GMBH
- PIE CO.,LTD
- QUANTIFICARE
- SHANGHAI MAY SKIN INFORMATION TECHNOLOGY CO
- DERMAQUIP
- COURAGE+KHAZAKA ELECTRONIC GMBH
- SYLTON (INNOFAITH BEAUTY SCIENCES)
- EMAGE MEDICAL
- PSI PLUS CO., LTD.
- CALLEGARI
- BOMTECH ELECTRONICS
- MIRAVEX
- DEMETRA
- SPECTRUM SCIENCE & BEAUTY
- METAOPTIMA
- BEIJING ADSS DEVELOPMENT CO
- PIXIENCE
第7章 皮膚画像診断システムの製造コストの分析
- 皮膚画像診断システムの主要原材料の分析
- 製造コストの構造比率
- 皮膚画像診断システムの産業チェーンの分析
第8章 マーケティングチャネル・流通業者・顧客
- マーケティングチャネル
- 皮膚画像診断システムの流通業者の一覧
- 皮膚画像診断システムの顧客
第9章 皮膚画像診断システム市場:市場力学
- 皮膚画像診断システム業界の動向
- 皮膚画像診断システム市場の促進要因
- 皮膚画像診断システム市場の課題
- 皮膚画像診断システム市場の抑制要因
第10章 世界市場の予測
- 皮膚画像診断システム市場:種類別の推計・予測
- 販売予測:種類別 (2023年~2028年)
- 収益予測:種類別 (2023年~2028年)
- 皮膚画像診断システム市場:用途別の推計・予測
- 販売予測:用途別 (2023年~2028年)
- 収益予測:用途別 (2023年~2028年)
- 皮膚画像診断システム市場:地域別の推計・予測
- 販売予測:地域別 (2023年~2028年)
- 収益予測:地域別 (2023年~2028年)
第11章 調査結果と結論
第12章 調査手法とデータソース
List of Tables
- Table 1. Global Skin Imaging Systems Sales Growth Rate Comparison by Type (2022-2028) & (Units) & (US$ Million)
- Table 2. Global Skin Imaging Systems Sales Growth Rate Comparison by Application (2022-2028) & (Units) & (US$ Million)
- Table 3. Global Skin Imaging Systems Market Size by Region (US$ Million): 2017 VS 2022 VS 2028
- Table 4. Global Skin Imaging Systems Market Competitive Situation by Manufacturers in 2022
- Table 5. Global Skin Imaging Systems Sales (Units) of Key Manufacturers (2017-2022)
- Table 6. Global Skin Imaging Systems Sales Market Share by Manufacturers (2017-2022)
- Table 7. Global Skin Imaging Systems Revenue (US$ Million) by Manufacturers (2017-2022)
- Table 8. Global Skin Imaging Systems Revenue Share by Manufacturers (2017-2022)
- Table 9. Global Market Skin Imaging Systems Average Price (US$/Unit) of Key Manufacturers (2017-2022)
- Table 10. Manufacturers Skin Imaging Systems Manufacturing Sites and Area Served
- Table 11. Manufacturers Skin Imaging Systems Product Type
- Table 12. Global Manufacturers Market Concentration Ratio (CR5 and HHI)
- Table 13. Global Skin Imaging Systems by Company Type (Tier 1, Tier 2, and Tier 3) & (based on the Revenue in Skin Imaging Systems as of 2022)
- Table 14. Manufacturers Mergers & Acquisitions, Expansion Plans
- Table 15. Global Skin Imaging Systems Sales by Region (2017-2022) & (Units)
- Table 16. Global Skin Imaging Systems Sales Market Share by Region (2017-2022)
- Table 17. Global Skin Imaging Systems Revenue by Region (2017-2022) & (US$ Million)
- Table 18. Global Skin Imaging Systems Revenue Market Share by Region (2017-2022)
- Table 19. North America Skin Imaging Systems Sales by Country (2017-2022) & (Units)
- Table 20. North America Skin Imaging Systems Sales Market Share by Country (2017-2022)
- Table 21. North America Skin Imaging Systems Revenue by Country (2017-2022) & (US$ Million)
- Table 22. North America Skin Imaging Systems Revenue Market Share by Country (2017-2022)
- Table 23. Europe Skin Imaging Systems Sales by Country (2017-2022) & (Units)
- Table 24. Europe Skin Imaging Systems Sales Market Share by Country (2017-2022)
- Table 25. Europe Skin Imaging Systems Revenue by Country (2017-2022) & (US$ Million)
- Table 26. Europe Skin Imaging Systems Revenue Market Share by Country (2017-2022)
- Table 27. Asia Pacific Skin Imaging Systems Sales by Region (2017-2022) & (Units)
- Table 28. Asia Pacific Skin Imaging Systems Sales Market Share by Region (2017-2022)
- Table 29. Asia Pacific Skin Imaging Systems Revenue by Region (2017-2022) & (US$ Million)
- Table 30. Asia Pacific Skin Imaging Systems Revenue Market Share by Region (2017-2022)
- Table 31. Latin America Skin Imaging Systems Sales by Country (2017-2022) & (Units)
- Table 32. Latin America Skin Imaging Systems Sales Market Share by Country (2017-2022)
- Table 33. Latin America Skin Imaging Systems Revenue by Country (2017-2022) & (US$ Million)
- Table 34. Latin America Skin Imaging Systems Revenue Market Share by Country (2017-2022)
- Table 35. Middle East and Africa Skin Imaging Systems Sales by Country (2017-2022) & (Units)
- Table 36. Middle East and Africa Skin Imaging Systems Sales Market Share by Country (2017-2022)
- Table 37. Middle East and Africa Skin Imaging Systems Revenue by Country (2017-2022) & (US$ Million)
- Table 38. Middle East and Africa Skin Imaging Systems Revenue Market Share by Country (2017-2022)
- Table 39. Global Skin Imaging Systems Sales by Type (2017-2022) & (Units)
- Table 40. Global Skin Imaging Systems Sales Market Share by Type (2017-2022)
- Table 41. Global Skin Imaging Systems Revenue by Type (2017-2022) & (US$ Million)
- Table 42. Global Skin Imaging Systems Revenue Share by Type (2017-2022)
- Table 43. Global Skin Imaging Systems Price by Type (2017-2022) & (US$/Unit)
- Table 44. Global Skin Imaging Systems Sales (Units) by Application (2017-2022)
- Table 45. Global Skin Imaging Systems Sales Market Share by Application (2017-2022)
- Table 46. Global Skin Imaging Systems Revenue by Application (2017-2022) & (US$ Million)
- Table 47. Global Skin Imaging Systems Revenue Share by Application (2017-2022)
- Table 48. Global Skin Imaging Systems Price by Application (2017-2022) & (US$/Unit)
- Table 49. Canfield Scientific, Inc Corporation Information
- Table 50. Canfield Scientific, Inc Description and Business Overview
- Table 51. Canfield Scientific, Inc Skin Imaging Systems Sales (Units), Revenue (US$ Million), Price (US$/Unit) and Gross Margin (2017-2022)
- Table 52. Canfield Scientific, Inc Skin Imaging Systems Product
- Table 53. Canfield Scientific, Inc Recent Developments/Updates
- Table 54. FotoFinder Systems GmbH Corporation Information
- Table 55. FotoFinder Systems GmbH Description and Business Overview
- Table 56. FotoFinder Systems GmbH Skin Imaging Systems Sales (Units), Revenue (US$ Million), Price (US$/Unit) and Gross Margin (2017-2022)
- Table 57. FotoFinder Systems GmbH Skin Imaging Systems Product
- Table 58. PIE Co.,Ltd Corporation Information
- Table 59. PIE Co.,Ltd Description and Business Overview
- Table 60. PIE Co.,Ltd Skin Imaging Systems Sales (Units), Revenue (US$ Million), Price (US$/Unit) and Gross Margin (2017-2022)
- Table 61. PIE Co.,Ltd Skin Imaging Systems Product
- Table 62. QuantifiCare Corporation Information
- Table 63. QuantifiCare Description and Business Overview
- Table 64. QuantifiCare Skin Imaging Systems Sales (Units), Revenue (US$ Million), Price (US$/Unit) and Gross Margin (2017-2022)
- Table 65. QuantifiCare Skin Imaging Systems Product
- Table 66. QuantifiCare Recent Developments/Updates
- Table 67. Shanghai May Skin Information Technology Co Corporation Information
- Table 68. Shanghai May Skin Information Technology Co Description and Business Overview
- Table 69. Shanghai May Skin Information Technology Co Skin Imaging Systems Sales (Units), Revenue (US$ Million), Price (US$/Unit) and Gross Margin (2017-2022)
- Table 70. Shanghai May Skin Information Technology Co Skin Imaging Systems Product
- Table 71. DermaQuip Corporation Information
- Table 72. DermaQuip Description and Business Overview
- Table 73. DermaQuip Skin Imaging Systems Sales (Units), Revenue (US$ Million), Price (US$/Unit) and Gross Margin (2017-2022)
- Table 74. DermaQuip Skin Imaging Systems Product
- Table 75. DermaQuip Recent Developments/Updates
- Table 76. Courage+Khazaka electronic GmbH Corporation Information
- Table 77. Courage+Khazaka electronic GmbH Description and Business Overview
- Table 78. Courage+Khazaka electronic GmbH Skin Imaging Systems Sales (Units), Revenue (US$ Million), Price (US$/Unit) and Gross Margin (2017-2022)
- Table 79. Courage+Khazaka electronic GmbH Skin Imaging Systems Product
- Table 80. Sylton (InnoFaith Beauty Sciences) Corporation Information
- Table 81. Sylton (InnoFaith Beauty Sciences) Description and Business Overview
- Table 82. Sylton (InnoFaith Beauty Sciences) Skin Imaging Systems Sales (Units), Revenue (US$ Million), Price (US$/Unit) and Gross Margin (2017-2022)
- Table 83. Sylton (InnoFaith Beauty Sciences) Skin Imaging Systems Product
- Table 84. Emage Medical Corporation Information
- Table 85. Emage Medical Description and Business Overview
- Table 86. Emage Medical Skin Imaging Systems Sales (Units), Revenue (US$ Million), Price (US$/Unit) and Gross Margin (2017-2022)
- Table 87. Emage Medical Skin Imaging Systems Product
- Table 88. PSI Plus Co., Ltd. Corporation Information
- Table 89. PSI Plus Co., Ltd. Description and Business Overview
- Table 90. PSI Plus Co., Ltd. Skin Imaging Systems Sales (Units), Revenue (US$ Million), Price (US$/Unit) and Gross Margin (2017-2022)
- Table 91. PSI Plus Co., Ltd. Skin Imaging Systems Product
- Table 92. Callegari Corporation Information
- Table 93. Callegari Description and Business Overview
- Table 94. Callegari Skin Imaging Systems Sales (Units), Revenue (US$ Million), Price (US$/Unit) and Gross Margin (2017-2022)
- Table 95. Callegari Skin Imaging Systems Product
- Table 96. Bomtech Electronics Corporation Information
- Table 97. Bomtech Electronics Description and Business Overview
- Table 98. Bomtech Electronics Skin Imaging Systems Sales (Units), Revenue (US$ Million), Price (US$/Unit) and Gross Margin (2017-2022)
- Table 99. Bomtech Electronics Skin Imaging Systems Product
- Table 100. Miravex Corporation Information
- Table 101. Miravex Description and Business Overview
- Table 102. Miravex Skin Imaging Systems Sales (Units), Revenue (US$ Million), Price (US$/Unit) and Gross Margin (2017-2022)
- Table 103. Miravex Skin Imaging Systems Product
- Table 104. Demetra Corporation Information
- Table 105. Demetra Description and Business Overview
- Table 106. Demetra Skin Imaging Systems Sales (Units), Revenue (US$ Million), Price (US$/Unit) and Gross Margin (2017-2022)
- Table 107. Demetra Skin Imaging Systems Product
- Table 108. Demetra Recent Developments/Updates
- Table 109. Spectrum Science & Beauty Corporation Information
- Table 110. Spectrum Science & Beauty Description and Business Overview
- Table 111. Spectrum Science & Beauty Skin Imaging Systems Sales (Units), Revenue (US$ Million), Price (US$/Unit) and Gross Margin (2017-2022)
- Table 112. Spectrum Science & Beauty Skin Imaging Systems Product
- Table 113. MetaOptima Corporation Information
- Table 114. MetaOptima Description and Business Overview
- Table 115. MetaOptima Skin Imaging Systems Sales (Units), Revenue (US$ Million), Price (US$/Unit) and Gross Margin (2017-2022)
- Table 116. MetaOptima Skin Imaging Systems Product
- Table 117. Beijing ADSS Development Co Corporation Information
- Table 118. Beijing ADSS Development Co Description and Business Overview
- Table 119. Beijing ADSS Development Co Skin Imaging Systems Sales (Units), Revenue (US$ Million), Price (US$/Unit) and Gross Margin (2017-2022)
- Table 120. Beijing ADSS Development Co Skin Imaging Systems Product
- Table 121. Pixience Corporation Information
- Table 122. Pixience Description and Business Overview
- Table 123. Pixience Skin Imaging Systems Sales (Units), Revenue (US$ Million), Price (US$/Unit) and Gross Margin (2017-2022)
- Table 124. Pixience Skin Imaging Systems Product
- Table 125. Production Base and Market Concentration Rate of Raw Material
- Table 126. Key Suppliers of Raw Materials
- Table 127. Skin Imaging Systems Distributors List
- Table 128. Skin Imaging Systems Customers List
- Table 129. Skin Imaging Systems Market Trends
- Table 130. Skin Imaging Systems Market Drivers
- Table 131. Skin Imaging Systems Market Challenges
- Table 132. Skin Imaging Systems Market Restraints
- Table 133. Global Skin Imaging Systems Sales Forecast by Type (2023-2028) & (Units)
- Table 134. Global Skin Imaging Systems Sales Market Share Forecast by Type (2023-2028)
- Table 135. Global Skin Imaging Systems Revenue Forecast by Type (2023-2028) & (US$ Million)
- Table 136. Global Skin Imaging Systems Revenue Market Share Forecast by Type (2023-2028)
- Table 137. Global Skin Imaging Systems Sales Forecast by Application (2023-2028) & (Units)
- Table 138. Global Skin Imaging Systems Sales Market Share Forecast by Application (2023-2028)
- Table 139. Global Skin Imaging Systems Revenue Forecast by Application (2023-2028) & (US$ Million)
- Table 140. Global Skin Imaging Systems Revenue Market Share Forecast by Application (2023-2028)
- Table 141. Global Skin Imaging Systems Sales Forecast by Region (2023-2028) & (Units)
- Table 142. Global Skin Imaging Systems Sales Market Share Forecast by Region (2023-2028)
- Table 143. Global Skin Imaging Systems Revenue Forecast by Region (2023-2028) & (US$ Million)
- Table 144. Global Skin Imaging Systems Revenue Market Share Forecast by Region (2023-2028)
- Table 145. Research Programs/Design for This Report
- Table 146. Key Data Information from Secondary Sources
- Table 147. Key Data Information from Primary Sources
List of Figures
- Figure 1. Product Picture of Skin Imaging Systems
- Figure 2. Global Skin Imaging Systems Market Share by Type: 2022 & 2028
- Figure 3. 3D Product Picture
- Figure 4. 2D Product Picture
- Figure 5. Global Skin Imaging Systems Market Share by Application: 2022 & 2028
- Figure 6. Hospital
- Figure 7. Beauty Salon
- Figure 8. Skin Care Centre
- Figure 9. Others
- Figure 10. Global Skin Imaging Systems Revenue, (US$ Million), 2017 VS 2022 VS 2028
- Figure 11. Global Skin Imaging Systems Market Size (2017-2028) & (US$ Million)
- Figure 12. Global Skin Imaging Systems Sales (2017-2028) & (Units)
- Figure 13. Skin Imaging Systems Sales Share by Manufacturers in 2022
- Figure 14. Global Skin Imaging Systems Revenue Share by Manufacturers in 2022
- Figure 15. Global 5 and 10 Largest Skin Imaging Systems Players: Market Share by Revenue in Skin Imaging Systems in 2021
- Figure 16. Skin Imaging Systems Market Share by Company Type (Tier 1, Tier 2, and Tier 3): 2017 VS 2022
- Figure 17. North America Skin Imaging Systems Sales Market Share by Country in 2022
- Figure 18. United States Skin Imaging Systems Revenue Growth Rate (2017-2022) & (US$ Million)
- Figure 19. Canada Skin Imaging Systems Revenue Growth Rate (2017-2022) & (US$ Million)
- Figure 20. Germany Skin Imaging Systems Revenue Growth Rate (2017-2022) & (US$ Million)
- Figure 21. France Skin Imaging Systems Revenue Growth Rate (2017-2022) & (US$ Million)
- Figure 22. U.K. Skin Imaging Systems Revenue Growth Rate (2017-2022) & (US$ Million)
- Figure 23. Italy Skin Imaging Systems Revenue Growth Rate (2017-2022) & (US$ Million)
- Figure 24. Russia Skin Imaging Systems Revenue Growth Rate (2017-2022) & (US$ Million)
- Figure 25. China Skin Imaging Systems Revenue Growth Rate (2017-2022) & (US$ Million)
- Figure 26. Japan Skin Imaging Systems Revenue Growth Rate (2017-2022) & (US$ Million)
- Figure 27. South Korea Skin Imaging Systems Revenue Growth Rate (2017-2022) & (US$ Million)
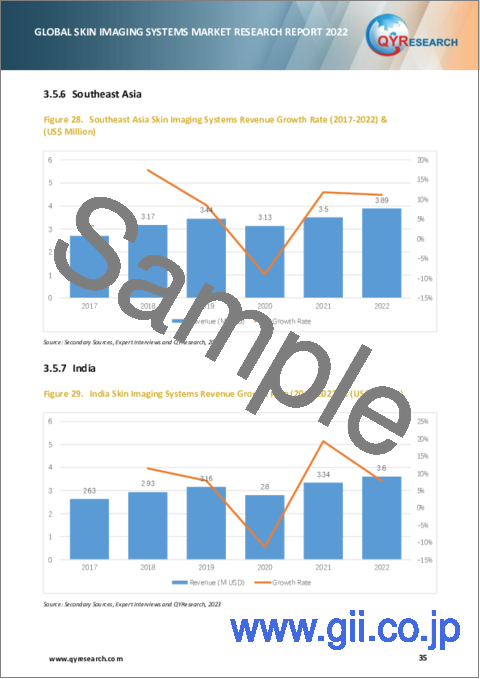
- Figure 28. Southeast Asia Skin Imaging Systems Revenue Growth Rate (2017-2022) & (US$ Million)
- Figure 29. India Skin Imaging Systems Revenue Growth Rate (2017-2022) & (US$ Million)
- Figure 30. Australia Skin Imaging Systems Revenue Growth Rate (2017-2022) & (US$ Million)
- Figure 31. Mexico Skin Imaging Systems Revenue Growth Rate (2017-2022) & (US$ Million)
- Figure 32. Brazil Skin Imaging Systems Revenue Growth Rate (2017-2022) & (US$ Million)
- Figure 33. Middle East Skin Imaging Systems Revenue Growth Rate (2017-2022) & (US$ Million)
- Figure 34. Africa Skin Imaging Systems Revenue Growth Rate (2017-2022) & (US$ Million)
- Figure 35. Sales Market Share of Skin Imaging Systems by Type (2017-2022)
- Figure 36. Manufacturing Cost Structure of Skin Imaging Systems
- Figure 37. Skin Imaging Systems Industrial Chain Analysis
- Figure 38. Channels of Distribution
- Figure 39. Distributors Profiles
- Figure 40. Bottom-up and Top-down Approaches for This Report
- Figure 41. Data Triangulation
- Figure 42. Key Executives Interviewed
Due to the COVID-19 pandemic, the global Skin Imaging Systems market size is US$ 155.57 million in 2022 and is forecast to a readjusted size of US$ 252.45 million by 2028 with a CAGR of 8.40% during the forecast period 2022-2028. Fully considering the economic change by this health crisis, 3D accounting for 91.53% of the Skin Imaging Systems global market in 2022, is projected to value US$ 234.64 million by 2028, growing at a revised 8.68% CAGR from 2022 to 2028. While Skin Care Centre segment is altered to an 9.20% CAGR throughout this forecast period.
The representative players in global Skin Imaging Systems market are Canfield Scientific, Inc, FotoFinder Systems GmbH, PIE Co.,Ltd, QuantifiCare, Shanghai May Skin Information Technology Co, accounting for 47.44% market share in terms of revenues in 2022.
This report focuses on Skin Imaging Systems volume and value at the global level, regional level, and company level. From a global perspective, this report represents overall Skin Imaging Systems market size by analysing historical data and future prospect. Regionally, this report focuses on several key regions: North America, Europe, China, Japan, etc.
Segment Analysis:
The research report includes specific segments by region (country), by company, by Type and by Application. This study provides information about the sales and revenue during the historic and forecasted period of 2017 to 2028. Understanding the segments helps in identifying the importance of different factors that aid the market growth.
Segment Analysis:
The research report includes specific segments by region (country), by manufacturers, by Type and by Application. Each type provides information about the production during the forecast period of 2017 to 2028. by Application segment also provides consumption during the forecast period of 2017 to 2028. Understanding the segments helps in identifying the importance of different factors that aid the market growth.
By Company
- Canfield Scientific, Inc
- FotoFinder Systems GmbH
- PIE Co.,Ltd
- QuantifiCare
- Shanghai May Skin Information Technology Co
- DermaQuip
- Courage+Khazaka electronic GmbH
- Sylton (InnoFaith Beauty Sciences)
- Emage Medical
- PSI Plus Co., Ltd.
- Callegari
- Bomtech Electronics
- Miravex
- Demetra
- Spectrum Science & Beauty
- MetaOptima
- Beijing ADSS Development Co
- Pixience
Segment by Type
- 3D
- 2D
Segment by Application
- Hospital
- Beauty Salon
- Skin Care Centre
- Others
Consumption by Region
- North America
- U.S.
- Canada
- Asia-Pacific
- China
- Japan
- South Korea
- India
- Southeast Asia
- Australia
- Europe
- Germany
- France
- U.K.
- Italy
- Russia
- Rest of Europe
- South America
- Mexico
- Brazil
- Rest of South America
- Middle East & Africa
- Middle East
- Africa
TABLE OF CONTENTS
1 SKIN IMAGING SYSTEMS MARKET OVERVIEW
- 1.1 PRODUCT OVERVIEW AND SCOPE OF SKIN IMAGING SYSTEMS
- 1.2 SKIN IMAGING SYSTEMS SEGMENT BY TYPE
- 1.2.1 GLOBAL SKIN IMAGING SYSTEMS SALES GROWTH RATE COMPARISON BY TYPE (2022-2028)
- 1.2.2 3D
- 1.2.3 2D
- 1.3 SKIN IMAGING SYSTEMS SEGMENT BY APPLICATION
- 1.3.1 GLOBAL SKIN IMAGING SYSTEMS SALES COMPARISON BY APPLICATION (2022-2028)
- 1.3.2 HOSPITAL
- 1.3.3 BEAUTY SALON
- 1.3.4 SKIN CARE CENTRE
- 1.3.5 OTHERS
- 1.4 GLOBAL SKIN IMAGING SYSTEMS MARKET SIZE ESTIMATES AND FORECASTS
- 1.4.1 GLOBAL SKIN IMAGING SYSTEMS REVENUE 2017-2028
- 1.4.2 GLOBAL SKIN IMAGING SYSTEMS SALES 2017-2028
- 1.4.3 SKIN IMAGING SYSTEMS MARKET SIZE BY REGION: 2017 VERSUS 2022 VERSUS 2028
2 SKIN IMAGING SYSTEMS MARKET COMPETITION BY MANUFACTURERS
- 2.1 GLOBAL SKIN IMAGING SYSTEMS SALES MARKET SHARE BY MANUFACTURERS (2017-2022)
- 2.2 GLOBAL SKIN IMAGING SYSTEMS REVENUE MARKET SHARE BY MANUFACTURERS (2017-2022)
- 2.3 GLOBAL SKIN IMAGING SYSTEMS AVERAGE PRICE BY MANUFACTURERS (2017-2022)
- 2.4 MANUFACTURERS SKIN IMAGING SYSTEMS MANUFACTURING SITES, AREA SERVED, PRODUCT TYPE
- 2.5 SKIN IMAGING SYSTEMS MARKET COMPETITIVE SITUATION AND TRENDS
- 2.5.1 SKIN IMAGING SYSTEMS MARKET CONCENTRATION RATE
- 2.5.2 THE GLOBAL 5 AND 10 LARGEST SKIN IMAGING SYSTEMS PLAYERS MARKET SHARE BY REVENUE
- 2.5.3 GLOBAL SKIN IMAGING SYSTEMS MARKET SHARE BY COMPANY TYPE (TIER 1, TIER 2, AND TIER 3)
- 2.6 MANUFACTURERS MERGERS & ACQUISITIONS, EXPANSION PLANS
3 SKIN IMAGING SYSTEMS RETROSPECTIVE MARKET SCENARIO BY REGION
- 3.1 GLOBAL SKIN IMAGING SYSTEMS RETROSPECTIVE MARKET SCENARIO IN SALES BY REGION: 2017-2022
- 3.2 GLOBAL SKIN IMAGING SYSTEMS RETROSPECTIVE MARKET SCENARIO IN REVENUE BY REGION: 2017-2022
- 3.3 NORTH AMERICA SKIN IMAGING SYSTEMS MARKET FACTS & FIGURES BY COUNTRY
- 3.3.1 NORTH AMERICA SKIN IMAGING SYSTEMS SALES BY COUNTRY
- 3.3.2 NORTH AMERICA SKIN IMAGING SYSTEMS REVENUE BY COUNTRY
- 3.3.3 UNITED STATES
- 3.3.4 CANADA
- 3.4 EUROPE SKIN IMAGING SYSTEMS MARKET FACTS & FIGURES BY COUNTRY
- 3.4.1 EUROPE SKIN IMAGING SYSTEMS SALES BY COUNTRY
- 3.4.2 EUROPE SKIN IMAGING SYSTEMS REVENUE BY COUNTRY
- 3.4.3 GERMANY
- 3.4.4 FRANCE
- 3.4.5 U.K.
- 3.4.6 ITALY
- 3.4.7 RUSSIA
- 3.5 ASIA PACIFIC SKIN IMAGING SYSTEMS MARKET FACTS & FIGURES BY REGION
- 3.5.1 ASIA PACIFIC SKIN IMAGING SYSTEMS SALES BY REGION
- 3.5.2 ASIA PACIFIC SKIN IMAGING SYSTEMS REVENUE BY REGION
- 3.5.3 CHINA
- 3.5.4 JAPAN
- 3.5.5 SOUTH KOREA
- 3.5.6 SOUTHEAST ASIA
- 3.5.7 INDIA
- 3.5.8 AUSTRALIA
- 3.6 LATIN AMERICA SKIN IMAGING SYSTEMS MARKET FACTS & FIGURES BY COUNTRY
- 3.6.1 LATIN AMERICA SKIN IMAGING SYSTEMS SALES BY COUNTRY
- 3.6.2 LATIN AMERICA SKIN IMAGING SYSTEMS REVENUE BY COUNTRY
- 3.6.3 MEXICO
- 3.6.4 BRAZIL
- 3.7 MIDDLE EAST AND AFRICA SKIN IMAGING SYSTEMS MARKET FACTS & FIGURES BY COUNTRY
- 3.7.1 MIDDLE EAST AND AFRICA SKIN IMAGING SYSTEMS SALES BY COUNTRY
- 3.7.2 MIDDLE EAST AND AFRICA SKIN IMAGING SYSTEMS REVENUE BY COUNTRY
- 3.7.3 MIDDLE EAST
- 3.7.4 AFRICA
4 SKIN IMAGING SYSTEMS HISTORIC MARKET ANALYSIS BY TYPE
- 4.1 GLOBAL SKIN IMAGING SYSTEMS SALES MARKET SHARE BY TYPE (2017-2022)
- 4.2 GLOBAL SKIN IMAGING SYSTEMS REVENUE MARKET SHARE BY TYPE (2017-2022)
- 4.3 GLOBAL SKIN IMAGING SYSTEMS PRICE BY TYPE (2017-2022)
5 SKIN IMAGING SYSTEMS HISTORIC MARKET ANALYSIS BY APPLICATION
- 5.1 GLOBAL SKIN IMAGING SYSTEMS SALES MARKET SHARE BY APPLICATION (2017-2022)
- 5.2 GLOBAL SKIN IMAGING SYSTEMS REVENUE MARKET SHARE BY APPLICATION (2017-2022)
- 5.3 GLOBAL SKIN IMAGING SYSTEMS PRICE BY APPLICATION (2017-2022)
6 KEY COMPANIES PROFILED
- 6.1 CANFIELD SCIENTIFIC, INC
- 6.1.1 CANFIELD SCIENTIFIC, INC CORPORATION INFORMATION
- 6.1.2 CANFIELD SCIENTIFIC, INC DESCRIPTION AND BUSINESS OVERVIEW
- 6.1.3 CANFIELD SCIENTIFIC, INC SKIN IMAGING SYSTEMS SALES, REVENUE AND GROSS MARGIN (2017-2022)
- 6.1.4 CANFIELD SCIENTIFIC, INC SKIN IMAGING SYSTEMS PRODUCT PORTFOLIO
- 6.1.5 CANFIELD SCIENTIFIC, INC RECENT DEVELOPMENTS/UPDATES
- 6.2 FOTOFINDER SYSTEMS GMBH
- 6.2.1 FOTOFINDER SYSTEMS GMBH CORPORATION INFORMATION
- 6.2.2 FOTOFINDER SYSTEMS GMBH DESCRIPTION AND BUSINESS OVERVIEW
- 6.2.3 FOTOFINDER SYSTEMS GMBH SKIN IMAGING SYSTEMS SALES, REVENUE AND GROSS MARGIN (2017-2022)
- 6.2.4 FOTOFINDER SYSTEMS GMBH SKIN IMAGING SYSTEMS PRODUCT PORTFOLIO
- 6.3 PIE CO.,LTD
- 6.3.1 PIE CO.,LTD CORPORATION INFORMATION
- 6.3.2 PIE CO.,LTD DESCRIPTION AND BUSINESS OVERVIEW
- 6.3.3 PIE CO.,LTD SKIN IMAGING SYSTEMS SALES, REVENUE AND GROSS MARGIN (2017-2022)
- 6.3.4 PIE CO.,LTD SKIN IMAGING SYSTEMS PRODUCT PORTFOLIO
- 6.4 QUANTIFICARE
- 6.4.1 QUANTIFICARE CORPORATION INFORMATION
- 6.4.2 QUANTIFICARE DESCRIPTION AND BUSINESS OVERVIEW
- 6.4.3 QUANTIFICARE SKIN IMAGING SYSTEMS SALES, REVENUE AND GROSS MARGIN (2017-2022)
- 6.4.4 QUANTIFICARE SKIN IMAGING SYSTEMS PRODUCT PORTFOLIO
- 6.4.5 QUANTIFICARE RECENT DEVELOPMENTS/UPDATES
- 6.5 SHANGHAI MAY SKIN INFORMATION TECHNOLOGY CO
- 6.5.1 SHANGHAI MAY SKIN INFORMATION TECHNOLOGY CO CORPORATION INFORMATION
- 6.5.2 SHANGHAI MAY SKIN INFORMATION TECHNOLOGY CO DESCRIPTION AND BUSINESS OVERVIEW
- 6.5.3 SHANGHAI MAY SKIN INFORMATION TECHNOLOGY CO SKIN IMAGING SYSTEMS SALES, REVENUE AND GROSS MARGIN (2017-2022)
- 6.5.4 SHANGHAI MAY SKIN INFORMATION TECHNOLOGY CO SKIN IMAGING SYSTEMS PRODUCT PORTFOLIO
- 6.6 DERMAQUIP
- 6.6.1 DERMAQUIP CORPORATION INFORMATION
- 6.6.2 DERMAQUIP DESCRIPTION AND BUSINESS OVERVIEW
- 6.6.3 DERMAQUIP SKIN IMAGING SYSTEMS SALES, REVENUE AND GROSS MARGIN (2017-2022)
- 6.6.4 DERMAQUIP SKIN IMAGING SYSTEMS PRODUCT PORTFOLIO
- 6.6.5 DERMAQUIP RECENT DEVELOPMENTS/UPDATES
- 6.7 COURAGE+KHAZAKA ELECTRONIC GMBH
- 6.7.1 COURAGE+KHAZAKA ELECTRONIC GMBH CORPORATION INFORMATION
- 6.7.2 COURAGE+KHAZAKA ELECTRONIC GMBH DESCRIPTION AND BUSINESS OVERVIEW
- 6.7.3 COURAGE+KHAZAKA ELECTRONIC GMBH SKIN IMAGING SYSTEMS SALES, REVENUE AND GROSS MARGIN (2017-2022)
- 6.7.4 COURAGE+KHAZAKA ELECTRONIC GMBH SKIN IMAGING SYSTEMS PRODUCT PORTFOLIO
- 6.8 SYLTON (INNOFAITH BEAUTY SCIENCES)
- 6.8.1 SYLTON (INNOFAITH BEAUTY SCIENCES) CORPORATION INFORMATION
- 6.8.2 SYLTON (INNOFAITH BEAUTY SCIENCES) DESCRIPTION AND BUSINESS OVERVIEW
- 6.8.3 SYLTON (INNOFAITH BEAUTY SCIENCES) SKIN IMAGING SYSTEMS SALES, REVENUE AND GROSS MARGIN (2017-2022)
- 6.8.4 SYLTON (INNOFAITH BEAUTY SCIENCES) SKIN IMAGING SYSTEMS PRODUCT PORTFOLIO
- 6.9 EMAGE MEDICAL
- 6.9.1 EMAGE MEDICAL CORPORATION INFORMATION
- 6.9.2 EMAGE MEDICAL DESCRIPTION AND BUSINESS OVERVIEW
- 6.9.3 EMAGE MEDICAL SKIN IMAGING SYSTEMS SALES, REVENUE AND GROSS MARGIN (2017-2022)
- 6.9.4 EMAGE MEDICAL SKIN IMAGING SYSTEMS PRODUCT PORTFOLIO
- 6.10 PSI PLUS CO., LTD.
- 6.10.1 PSI PLUS CO., LTD. CORPORATION INFORMATION
- 6.10.2 PSI PLUS CO., LTD. DESCRIPTION AND BUSINESS OVERVIEW
- 6.10.3 PSI PLUS CO., LTD. SKIN IMAGING SYSTEMS SALES, REVENUE AND GROSS MARGIN (2017-2022)
- 6.10.4 PSI PLUS CO., LTD. SKIN IMAGING SYSTEMS PRODUCT PORTFOLIO
- 6.11 CALLEGARI
- 6.11.1 CALLEGARI CORPORATION INFORMATION
- 6.11.2 CALLEGARI DESCRIPTION AND BUSINESS OVERVIEW
- 6.11.3 CALLEGARI SKIN IMAGING SYSTEMS SALES, REVENUE AND GROSS MARGIN (2017-2022)
- 6.11.4 CALLEGARI SKIN IMAGING SYSTEMS PRODUCT PORTFOLIO
- 6.12 BOMTECH ELECTRONICS
- 6.12.1 BOMTECH ELECTRONICS CORPORATION INFORMATION
- 6.12.2 BOMTECH ELECTRONICS DESCRIPTION AND BUSINESS OVERVIEW
- 6.12.3 BOMTECH ELECTRONICS SKIN IMAGING SYSTEMS SALES, REVENUE AND GROSS MARGIN (2017-2022)
- 6.12.4 BOMTECH ELECTRONICS SKIN IMAGING SYSTEMS PRODUCT PORTFOLIO
- 6.13 MIRAVEX
- 6.13.1 MIRAVEX CORPORATION INFORMATION
- 6.13.2 MIRAVEX DESCRIPTION AND BUSINESS OVERVIEW
- 6.13.3 MIRAVEX SKIN IMAGING SYSTEMS SALES, REVENUE AND GROSS MARGIN (2017-2022)
- 6.13.4 MIRAVEX SKIN IMAGING SYSTEMS PRODUCT PORTFOLIO
- 6.14 DEMETRA
- 6.14.1 DEMETRA CORPORATION INFORMATION
- 6.14.2 DEMETRA DESCRIPTION AND BUSINESS OVERVIEW
- 6.14.3 DEMETRA SKIN IMAGING SYSTEMS SALES, REVENUE AND GROSS MARGIN (2017-2022)
- 6.14.4 DEMETRA SKIN IMAGING SYSTEMS PRODUCT PORTFOLIO
- 6.14.5 DEMETRA RECENT DEVELOPMENTS/UPDATES
- 6.15 SPECTRUM SCIENCE & BEAUTY
- 6.15.1 SPECTRUM SCIENCE & BEAUTY CORPORATION INFORMATION
- 6.15.2 SPECTRUM SCIENCE & BEAUTY DESCRIPTION AND BUSINESS OVERVIEW
- 6.15.3 SPECTRUM SCIENCE & BEAUTY SKIN IMAGING SYSTEMS SALES, REVENUE AND GROSS MARGIN (2017-2022)
- 6.15.4 SPECTRUM SCIENCE & BEAUTY SKIN IMAGING SYSTEMS PRODUCT PORTFOLIO
- 6.16 METAOPTIMA
- 6.16.1 METAOPTIMA CORPORATION INFORMATION
- 6.16.2 METAOPTIMA DESCRIPTION AND BUSINESS OVERVIEW
- 6.16.3 METAOPTIMA SKIN IMAGING SYSTEMS SALES, REVENUE AND GROSS MARGIN (2017-2022)
- 6.16.4 METAOPTIMA SKIN IMAGING SYSTEMS PRODUCT PORTFOLIO
- 6.17 BEIJING ADSS DEVELOPMENT CO
- 6.17.1 BEIJING ADSS DEVELOPMENT CO CORPORATION INFORMATION
- 6.17.2 BEIJING ADSS DEVELOPMENT CO DESCRIPTION AND BUSINESS OVERVIEW
- 6.17.3 BEIJING ADSS DEVELOPMENT CO SKIN IMAGING SYSTEMS SALES, REVENUE AND GROSS MARGIN (2017-2022)
- 6.17.4 BEIJING ADSS DEVELOPMENT CO SKIN IMAGING SYSTEMS PRODUCT PORTFOLIO
- 6.18 PIXIENCE
- 6.18.1 PIXIENCE CORPORATION INFORMATION
- 6.18.2 PIXIENCE DESCRIPTION AND BUSINESS OVERVIEW
- 6.18.3 PIXIENCE SKIN IMAGING SYSTEMS SALES, REVENUE AND GROSS MARGIN (2017-2022)
- 6.18.4 PIXIENCE SKIN IMAGING SYSTEMS PRODUCT PORTFOLIO
7 SKIN IMAGING SYSTEMS MANUFACTURING COST ANALYSIS
- 7.1 SKIN IMAGING SYSTEMS KEY RAW MATERIALS ANALYSIS
- 7.1.1 KEY RAW MATERIALS
- 7.1.2 KEY SUPPLIERS OF RAW MATERIALS
- 7.2 PROPORTION OF MANUFACTURING COST STRUCTURE
- 7.3 SKIN IMAGING SYSTEMS INDUSTRIAL CHAIN ANALYSIS
8 MARKETING CHANNEL, DISTRIBUTORS AND CUSTOMERS
- 8.1 MARKETING CHANNEL
- 8.2 SKIN IMAGING SYSTEMS DISTRIBUTORS LIST
- 8.3 SKIN IMAGING SYSTEMS CUSTOMERS
9 SKIN IMAGING SYSTEMS MARKET DYNAMICS
- 9.1 SKIN IMAGING SYSTEMS INDUSTRY TRENDS
- 9.2 SKIN IMAGING SYSTEMS MARKET DRIVERS
- 9.3 SKIN IMAGING SYSTEMS MARKET CHALLENGES
- 9.4 SKIN IMAGING SYSTEMS MARKET RESTRAINTS
10 GLOBAL MARKET FORECAST
- 10.1 SKIN IMAGING SYSTEMS MARKET ESTIMATES AND PROJECTIONS BY TYPE
- 10.1.1 GLOBAL FORECASTED SALES OF SKIN IMAGING SYSTEMS BY TYPE (2023-2028)
- 10.1.2 GLOBAL FORECASTED REVENUE OF SKIN IMAGING SYSTEMS BY TYPE (2023-2028)
- 10.2 SKIN IMAGING SYSTEMS MARKET ESTIMATES AND PROJECTIONS BY APPLICATION
- 10.2.1 GLOBAL FORECASTED SALES OF SKIN IMAGING SYSTEMS BY APPLICATION (2023-2028)
- 10.2.2 GLOBAL FORECASTED REVENUE OF SKIN IMAGING SYSTEMS BY APPLICATION (2023-2028)
- 10.3 SKIN IMAGING SYSTEMS MARKET ESTIMATES AND PROJECTIONS BY REGION
- 10.3.1 GLOBAL FORECASTED SALES OF SKIN IMAGING SYSTEMS BY REGION (2023-2028)
- 10.3.2 GLOBAL FORECASTED REVENUE OF SKIN IMAGING SYSTEMS BY REGION (2023-2028)
11 RESEARCH FINDINGS AND CONCLUSION
12 METHODOLOGY AND DATA SOURCE
- 12.1 METHODOLOGY/RESEARCH APPROACH
- 12.1.1 RESEARCH PROGRAMS/DESIGN
- 12.1.2 MARKET SIZE ESTIMATION
- 12.1.3 MARKET BREAKDOWN AND DATA TRIANGULATION
- 12.2 DATA SOURCE
- 12.2.1 SECONDARY SOURCES
- 12.2.2 PRIMARY SOURCES
- 12.3 AUTHOR LIST
- 12.4 DISCLAIMER