|
|
市場調査レポート
商品コード
1171343
VOCローターの世界市場:市場規模、メーカー、サプライチェーン、販売チャネル、顧客 (2022年~2028年)Global VOC's Rotor Market Size, Manufacturers, Supply Chain, Sales Channel and Clients, 2022-2028 |
||||||
|
|
|||||||
|
● お客様のご希望に応じて、既存データの加工や未掲載情報(例:国別セグメント)の追加などの対応が可能です。 詳細はお問い合わせください。 |
|||||||


| VOCローターの世界市場:市場規模、メーカー、サプライチェーン、販売チャネル、顧客 (2022年~2028年) |
|
出版日: 2022年12月14日
発行: QYResearch
ページ情報: 英文 108 Pages
納期: 2~3営業日
|
- 全表示
- 概要
- 図表
- 目次
世界のVOC (揮発性有機化合物) ローターの市場規模は、2022年に7,984万米ドルと推定され、2028年には1億1,368万米ドルに再調整され、予測期間中 (2022年~2028年) に6.07%のCAGRで成長すると予測されています。
当レポートでは、世界のVOCローターの市場について分析し、種類別・用途別・地域別 (国別) の市場動向の見通し (2017年~2028年)、主要企業のプロファイルなどについて調査しております。
目次
第1章 調査範囲
- VOCローター:製品概略
- 種類別の市場
- 市場規模・成長率:種類別 (2017年・2021年・2028年)
- ゼオライト
- 活性炭
- 用途別の市場
- 市場規模・成長率:用途別 (2017年・2021年・2028年)
- 輸送機械
- 工業生産
- 半導体
- その他
- 分析対象
- 分析期間
第2章 エグゼクティブサマリー
- 世界のVOCローターの市場規模、推定・予測
- 世界のVOCローターの収益 (2017年~2028年)
- 世界のVOCローターの販売 (2017年~2028年)
- VOCローターの市場規模:地域別 (2021年・2028年)
- VOCローターの販売:地域別 (2017年~2028年)
- 世界のVOCローターの販売:地域別 (2017年~2022年)
- 世界のVOCローターの販売予測:地域別 (2023年~2028年)
- 世界のVOCローターの販売・市場シェア:地域別 (2021年)
- VOCローター市場の推計・予測:地域別 (2023年~2028年)
- 世界のVOCローターの収益:地域別 (2017年~2022年)
- 世界のVOCローターの収益予測:地域別 (2023年~2028年)
- 世界のVOCローターの収益・市場シェア:地域別 (2021年)
第3章 世界のVOCローター:メーカー別
- 世界のVOCローターの大手メーカーの販売 (2017年~2022年)
- 世界のVOCローターの大手メーカーの収益 (2017年~2022年)
- 世界のVOCローターの価格:メーカー別 (2017年~2022年)
- 競合情勢
- 世界のVOCローターメーカーの製造拠点
第4章 企業プロファイル
- Seibu Giken
- Nichias
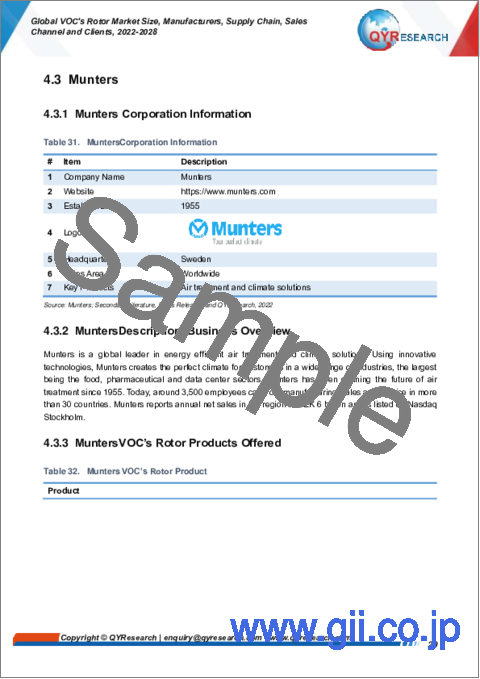
- Munters
- Taikisha
- HSJ Environment Protection
- ProFlute
第5章 種類別の内訳データ
- 世界のVOCローターの販売:種類別 (2017年~2028年)
- 世界のVOCローターの収益予測:種類別 (2017年~2028年)
- 世界のVOCローターの平均販売価格 (ASP):種類別 (2017年~2028年)
第6章 用途別の内訳データ
- 世界のVOCローターの生産:用途別 (2017年~2028年)
- 世界のVOCローターの収益予測:用途別 (2017年~2028年)
- 世界のVOCローターの平均販売価格 (ASP):用途別 (2017年~2028年)
第7章 北米
- VOCローターの市場規模・対前年成長率 (YoY) (2017年~2028年)
- VOCローター市場:国別の詳細データ
- VOCローターの販売:国別 (2017年~2028年)
- VOCローターの収益:国別 (2017年~2028年)
- VOCローターの販売:種類別 (2017年~2022年)
- VOCローターの販売:用途別 (2017年~2022年)
第8章 アジア太平洋
第9章 欧州
第10章 ラテンアメリカ
第11章 中東・アフリカ
第12章 サプライチェーン・販売チャネルの分析
- VOCローターのサプライチェーンの分析
- VOCローターの主要な原材料と上流工程のサプライヤー
- VOCローターのクライアントの分析
- VOCローターの流通業者の分析
第13章 VOCローターの市場力学
- VOCローター産業の動向
- VOCローター市場の促進要因
- VOCローター市場の課題
- VOCローター市場の抑制要因
- ポーターのファイブフォース分析
第14章 調査結果と結論
第15章 付録
LIST OF TABLES
- Table 1. Global VOC's Rotor Market Size Growth Rate by Type (US$ Million): 2017 VS2021 VS 2028
- Table 2. Global VOC's Rotor Market Size Growth by Application (US$ Million): 2017 VS 2021 VS 2028
- Table 3. Global VOC's Rotor Market Size by Region (US$ Million): 2021 VS 2028
- Table 4. Global VOC's Rotor Sales by Region (2017-2022) & (Units)
- Table 5. Global VOC's Rotor Sales Forecast by Region (2023-2028) & (Units)
- Table 6. Global VOC's Rotor Revenue by Region (2017-2022) & (US$ Million)
- Table 7. Global VOC's Rotor Revenue Forecast by Region (2023-2028) & (US$ Million)
- Table 8. Global VOC's Rotor Sales by Manufacturer (2017-2022) & (Units)
- Table 9. Global VOC's Rotor Sales Share by Manufacturer (2017-2022)
- Table 10. VOC's Rotor Revenue by Manufacturer (2017-2022) & (US$ Million)
- Table 11. VOC's Rotor Revenue Share by Manufacturer (2017-2022)
- Table 12. KeyManufacturersVOC's Rotor Price (2017-2022) & (K USD/Unit)
- Table 13. Ranking of Global Top VOC's Rotor Manufacturersby Revenue (US$ Million) in 2021
- Table 14. GlobalVOC's Rotor Manufacturers Market Concentration Ratio (CR5 and HHI) & (2017-2022)
- Table 15. Global VOC's Rotor by Company Type (Tier 1, Tier 2, and Tier 3) & (based on the Revenue in VOC's Rotor as of 2021)
- Table 16. VOC's Rotor Manufacturers Headquarters
- Table 17. Manufacturers VOC's Rotor Product Type
- Table 18. Establishment Date of VOC's Rotor Manufacturers
- Table 19. Seibu GikenCorporation Information
- Table 20. Seibu Giken VOC's Rotor Product
- Table 21. Seibu GikenVOC's Rotor Sales (Units), Revenue (US$ Million), Price (K USD/Unit) and Gross Margin (2017-2022)
- Table 22. Seibu Giken Sales Proportion of VOC's Rotor by Product in 2021
- Table 23. Seibu Giken Sales Proportion of VOC's Rotor by Application in 2021
- Table 24. Seibu Giken Sales Proportion of VOC's Rotor by Geographic Area in 2021
- Table 25. NichiasCorporation Information
- Table 26. Nichias VOC's Rotor Product
- Table 27. Nichias VOC's Rotor Sales (Units), Revenue (US$ Million), Price (K USD/Unit) and Gross Margin (2017-2022)
- Table 28. Nichias Sales Proportion of VOC's Rotor by Product in 2021
- Table 29. Nichias Sales Proportion of VOC's Rotor by Application in 2021
- Table 30. Nichias Sales Proportion of VOC's Rotor by Geographic Area in 2021
- Table 31. MuntersCorporation Information
- Table 32. Munters VOC's Rotor Product
- Table 33. MuntersVOC's Rotor Sales (Units), Revenue (US$ Million), Price (K USD/Unit) and Gross Margin (2017-2022)
- Table 34. Munters Sales Proportion of VOC's Rotor by Product in 2021
- Table 35. Munters Sales Proportion of VOC's Rotor by Application in 2021
- Table 36. Munters Sales Proportion of VOC's Rotor by Geographic Area in 2021
- Table 37. TaikishaCorporation Information
- Table 38. Taikisha VOC's Rotor Product
- Table 39. TaikishaVOC's Rotor Sales (Units), Revenue (US$ Million), Price (K USD/Unit) and Gross Margin (2017-2022)
- Table 40. Taikisha Sales Proportion of VOC's Rotor by Product in 2021
- Table 41. Taikisha Sales Proportion of VOC's Rotor by Application in 2021
- Table 42. Taikisha Sales Proportion of VOC's Rotor by Geographic Area in 2021
- Table 43. HSJ Environment ProtectionCorporation Information
- Table 44. HSJ Environment Protection VOC's Rotor Product
- Table 45. HSJ Environment ProtectionVOC's Rotor Sales (Units), Revenue (US$ Million), Price (K USD/Unit) and Gross Margin (2017-2022)
- Table 46. HSJ Environment Protection Sales Proportion of VOC's Rotor by Product in 2021
- Table 47. HSJ Environment Protection Sales Proportion of VOC's Rotor by Application in 2021
- Table 48. HSJ Environment Protection Sales Proportion of VOC's Rotor by Geographic Area in 2021
- Table 49. ProFluteCorporation Information
- Table 50. ProFlute VOC's Rotor Product
- Table 51. ProFluteVOC's Rotor Sales (Units), Revenue (US$ Million), Price (K USD/Unit) and Gross Margin (2017-2022)
- Table 52. ProFlute Sales Proportion of VOC's Rotor by Product in 2021
- Table 53. ProFlute Sales Proportion of VOC's Rotor by Application in 2021
- Table 54. ProFlute Sales Proportion of VOC's Rotor by Geographic Area in 2021
- Table 55. Global VOC's Rotor Sales by Type (2017-2022) & (Units)
- Table 56. Global VOC's Rotor Sales Forecast by Type (2023-2028) & (Units)
- Table 57. Global VOC's Rotor Revenue by Type (2017-2022) & (US$ Million)
- Table 58. Global VOC's Rotor Revenue Forecast by Type (2023-2028) & (US$ Million)
- Table 59. Global VOC's Rotor Price by Type (2017-2022) & (K USD/Unit)
- Table 60. Global VOC's Rotor Price Forecast by Type (2023-2028) & (K USD/Unit)
- Table 61. Global VOC's Rotor Sales by Application (2017-2022) & (Units)
- Table 62. Global VOC's Rotor Sales Forecast by Application (2023-2028) & (Units)
- Table 63. Global VOC's Rotor Revenue by Application (2017-2022) & (US$ Million)
- Table 64. Global VOC's Rotor Revenue Forecast by Application (2023-2028) & (US$ Million)
- Table 65. Global VOC's Rotor Price by Application (2017-2022) & (K USD/Unit)
- Table 66. Global VOC's Rotor Price Forecast by Application (2023-2028) & (K USD/Unit)
- Table 67. North America VOC's Rotor Sales by Country (2017-2022) & (Units)
- Table 68. North America VOC's Rotor Sales by Country (2023-2028) & (Units)
- Table 69. North America VOC's Rotor Revenue by Country (2017-2022) & (US$ Million)
- Table 70. North America VOC's Rotor Revenue by Country (2023-2028) & (US$ Million)
- Table 71. North America VOC's Rotor Sales by Type (2017-2022) & (Units)
- Table 72. North America VOC's Rotor Sales by Application (2017-2022) & (Units)
- Table 73. Asia-Pacific VOC's Rotor Sales by Region(2017-2022) & (Units)
- Table 74. Asia-Pacific VOC's Rotor Sales by Region (2023-2028) & (Units)
- Table 75. Asia-Pacific VOC's Rotor Revenue by Region(2017-2022) & (US$ Million)
- Table 76. Asia-Pacific VOC's Rotor Revenue by Region (2023-2028) & (US$ Million)
- Table 77. Asia-Pacific VOC's Rotor Sales by Type (2017-2022) & (Units)
- Table 78. Asia-Pacific VOC's Rotor Sales by Application (2017-2022) & (Units)
- Table 79. Europe VOC's Rotor Sales by Country (2017-2022) & (Units)
- Table 80. Europe VOC's Rotor Sales by Country (2023-2028) & (Units)
- Table 81. Europe VOC's Rotor Revenue by Country (2017-2022) & (US$ Million)
- Table 82. Europe VOC's Rotor Revenue by Country (2023-2028) & (US$ Million)
- Table 83. Europe VOC's Rotor Sales by Type (2017-2022) & (Units)
- Table 84. Europe VOC's Rotor Sales by Application (2017-2022) & (Units)
- Table 85. Latin America VOC's Rotor Sales by Country (2017-2022) & (Units)
- Table 86. Latin America VOC's Rotor Sales by Country (2023-2028) & (Units)
- Table 87. Latin AmericaVOC's Rotor Revenue by Country (2017-2022) & (US$ Million)
- Table 88. Latin America VOC's Rotor Revenue by Country (2023-2028) & (US$ Million)
- Table 89. Latin America VOC's Rotor Sales by Type (2017-2022) & (Units)
- Table 90. Latin America VOC's Rotor Sales by Application (2017-2022) & (Units)
- Table 91. Middle East and Africa VOC's Rotor Sales by Country (2017-2022) & (Units)
- Table 92. Middle East and Africa VOC's Rotor Sales by Country (2023-2028) & (Units)
- Table 93. Middle East and Africa VOC's Rotor Revenue by Country (2017-2022) & (US$ Million)
- Table 94. Middle East and Africa VOC's Rotor Revenue by Country (2023-2028) & (US$ Million)
- Table 95. Middle East and Africa VOC's Rotor Sales by Type (2017-2022) & (Units)
- Table 96. Middle East and Africa VOC's Rotor Sales by Application (2017-2022) & (Units)
- Table 97. VOC's Rotor Key Raw Materials and Upstream Suppliers
- Table 98. VOC's Rotor Clients
- Table 99. VOC's Rotor Distributors
- Table 100. VOC's Rotor Market Trends
- Table 101. VOC's Rotor Market Drivers
- Table 102. VOC's Rotor Market Challenges
- Table 103. Research Programs/Design for This Report
- Table 104. Key Data Information from Secondary Sources
- Table 105. Key Data Information from Primary Sources
List of Figures
- Figure 1. VOC's Rotor Product Picture
- Figure 2. Global VOC's Rotor Revenue Market Share by Type in 2021
- Figure 3. Zeolite Product Picture
- Figure 4. Activated Carbon Product Picture
- Figure 5. Global VOC's Rotor Revenue Market Share by Application in 2021
- Figure 6. Transportation
- Figure 7. Industrial Manufacturing
- Figure 8. Semi-conductor
- Figure 9. VOC's Rotor Report Years Considered
- Figure 10. Global VOC's Rotor Market Size2017-2028 (US$ Million)
- Figure 11. Global VOC's Rotor Sales 2017-2028 (Units)
- Figure 12. Global VOC's Rotor Sales Market Share Forecast by Region (2021)
- Figure 13. Global VOC's Rotor Revenue Market Share by Region (2021)
- Figure 14. Global VOC's Rotor Sales Share by Manufacturer in 2021
- Figure 15. Global VOC's Rotor Sales Market Share Forecast by Type (2021)
- Figure 16. Global VOC's Rotor Revenue Market Share Forecast by Type (2021)
- Figure 17. Global VOC's Rotor Sales Market Share Forecast by Application (2021)
- Figure 18. Global VOC's Rotor Revenue Market Share Forecast by Application (2021)
- Figure 19. North America VOC's Rotor Revenue 2017-2028 (US$ Million)
- Figure 20. North America VOC's Rotor Sales Market Share by Country (2021)
- Figure 21. North America VOC's Rotor Revenue Market Share by Country (2021)
- Figure 22. North America VOC's Rotor Sales Market Share by Type (2021)
- Figure 23. North America VOC's Rotor Sales Market Share by Application (2021)
- Figure 24. Asia-Pacific VOC's Rotor Revenue 2017-2028 (US$ Million)
- Figure 25. Asia-Pacific VOC's Rotor Sales Market Share by Country (2021)
- Figure 26. Asia-Pacific VOC's Rotor Revenue Market Share by Country (2021)
- Figure 27. Asia-Pacific VOC's Rotor Sales Market Share by Type (2021)
- Figure 28. Asia-Pacific VOC's Rotor Sales Market Share by Application (2021)
- Figure 29. Europe VOC's Rotor Revenue Growth Rate 2017-2028 (US$ Million)
- Figure 30. Europe VOC's Rotor Sales Market Share by Country (2021)
- Figure 31. Europe VOC's Rotor Revenue Market Share by Country (2021)
- Figure 32. Europe VOC's Rotor Sales Market Share by Type (2021)
- Figure 33. Europe VOC's Rotor Sales Market Share by Application (2021)
- Figure 34. Latin America VOC's Rotor Revenue Growth Rate 2017-2028 (US$ Million)
- Figure 35. Latin America VOC's Rotor Sales Market Share by Country (2021)
- Figure 36. Latin America VOC's Rotor Revenue Market Share by Country (2021)
- Figure 37. Latin America VOC's Rotor Sales Market Share by Type (2021)
- Figure 38. Latin America VOC's Rotor Sales Market Share by Application (2021)
- Figure 39. Middle East and Africa VOC's Rotor Revenue Growth Rate 2017-2028 (US$ Million)
- Figure 40. Middle East and Africa VOC's Rotor Sales Market Share by Country (2021)
- Figure 41. Middle East and Africa VOC's Rotor Revenue Market Share by Country (2021)
- Figure 42. Middle East and Africa VOC's Rotor Sales Market Share by Type (2021)
- Figure 43. Middle East and Africa VOC's Rotor Sales Market Share by Application (2021)
- Figure 44. VOC's Rotor Supply Chain (Upstream and Downstream Market)
- Figure 45. VOC's Rotor Porter's Five Forces Analysis
- Figure 46. Bottom-up and Top-down Approaches for This Report
- Figure 47. Data Triangulation
- Figure 48. KeyExecutivesInterviewed
Market Analysis and Insights:
The global market for VOC's Rotor is estimated to be worth US$ 79.84 million in 2022 and is forecast to a readjusted size of US$ 113.68 million by 2028 with a CAGR of 6.07% during the forecast period 2022-2028.
Scope and Market Size:
VOC's Rotor market is segmented by region, by country, by company, by Type, and by Application. Players, stakeholders, and other participants in the global VOC's Rotor market will be able to gain the upper hand as they use the report as a powerful resource. The segmental analysis focuses on sales, revenue and forecast by region, by country, company, type, application and by sales channels for the period 2017-2028.
Segment by Type
- Zeolite
- Activated Carbon
Segment by Application
- Transportation
- Industrial Manufacturing
- Semi-conductor
- Other
By Company
- Seibu Giken
- Nichias
- Munters
- Taikisha
- HSJ Environment Protection
- ProFlute
By Region
- North America
- United States
- Canada
- Asia-Pacific
- China
- Japan
- South Korea
- Taiwan
- Southeast Asia
- Rest of Asia-Pacific
- Europe
- Germany
- France
- U.K.
- Italy
- Russia
- Rest of Europe
- Latin America
- Mexico
- Brazil
- Rest of Latin America
- Middle East & Africa
TABLE OF CONTENTS
1 Study Coverage
- 1.1 VOC's Rotor Product Introduction
- 1.2 Market by Type
- 1.2.1 Global VOC's Rotor Market Size Growth Rate by Type (2017 VS 2021 VS 2028)
- 1.2.2 Zeolite
- 1.2.3 Activated Carbon
- 1.3 Market by Application
- 1.3.1 Global VOC's Rotor Market Size Growth Rate by Application (2017 VS 2021 VS 2028)
- 1.3.2 Transportation
- 1.3.3 Industrial Manufacturing
- 1.3.4 Semi-conductor
- 1.3.5 Other
- 1.4 Study Objectives
- 1.5 Years Considered
2 Executive Summary
- 2.1 Global VOC's Rotor Market Size Estimates and Forecasts
- 2.1.1 Global VOC's Rotor Revenue2017-2028
- 2.1.2 Global VOC's Rotor Sales 2017-2028
- 2.2 VOC's Rotor Market Size by Region: 2021Versus 2028
- 2.3 VOC's Rotor Sales by Region (2017-2028)
- 2.3.1 Global VOC's Rotor Sales by Region: 2017-2022
- 2.3.2 Global VOC's Rotor Sales Forecast by Region (2023-2028)
- 2.3.3 Global VOC's Rotor Sales Market Share by Region (2021)
- 2.4 VOC's Rotor Market Estimates and Projections by Region (2017-2028)
- 2.4.1 Global VOC's Rotor Revenue by Region: 2017-2022
- 2.4.2 Global VOC's Rotor Revenue Forecast by Region (2023-2028)
- 2.4.3 Global VOC's Rotor Revenue Market Share by Region (2021)
3 Global VOC's Rotor by Manufacturers
- 3.1 Global Top VOC's Rotor Manufacturers by Sales(2017-2022)
- 3.1.1 Global VOC's Rotor Sales by Manufacturer (2017-2022)
- 3.1.2 Global VOC's Rotor Sales Market Share by Manufacturer (2017-2022)
- 3.2 Global Top VOC's Rotor Manufacturers by Revenue (2017-2022)
- 3.2.1 Global VOC's Rotor Revenue by Manufacturer (2017-2022)
- 3.2.2 Global VOC's Rotor Revenue Shareby Manufacturer (2017-2022)
- 3.3 Global VOC's Rotor Price by Manufacturer(2017-2022)
- 3.4 Competitive Landscape
- 3.4.1 Key VOC's Rotor Manufacturers Covered: Ranking by Revenue
- 3.4.2 GlobalVOC's Rotor Market Concentration Ratio (CR5 and HHI) & (2017-2022)
- 3.4.3 Global VOC's Rotor Market Share by Company Type (Tier 1, Tier 2, and Tier 3)
- 3.5 Global VOC's Rotor Manufacturers Headquarters
- 3.5.1 VOC's Rotor Manufacturers Headquarters
- 3.5.2 Manufacturers VOC's Rotor Product Type
- 3.5.3 Establishment Date of VOC's Rotor Manufacturers
4 Company Profiles
- 4.1 Seibu Giken
- 4.1.1 Seibu Giken Corporation Information
- 4.1.2 Seibu Giken Description, Business Overview
- 4.1.3 Seibu GikenVOC's Rotor Products Offered
- 4.1.4 Seibu Giken VOC's Rotor Sales, Revenue and Gross Margin (2017-2022)
- 4.1.5 Seibu Giken VOC's Rotor Sales by Product in 2021
- 4.1.6 Seibu Giken VOC's Rotor Sales by Application in 2021
- 4.1.7 Seibu Giken VOC's Rotor Sales by Geographic Area in 2021
- 4.1.8 Seibu Giken Contact Information
- 4.2 Nichias
- 4.2.1 Nichias Corporation Information
- 4.2.2 NichiasDescription, Business Overview
- 4.2.3 Nichias VOC's Rotor Products Offered
- 4.2.4 Nichias VOC's Rotor Sales, Revenue and Gross Margin (2017-2022)
- 4.2.5 Nichias VOC's Rotor Sales by Product in 2021
- 4.2.6 Nichias VOC's Rotor Sales by Application in 2021
- 4.2.7 Nichias VOC's Rotor Sales by Geographic Area in 2021
- 4.2.8 Nichias Contact Information
- 4.3 Munters
- 4.3.1 Munters Corporation Information
- 4.3.2 MuntersDescription, Business Overview
- 4.3.3 MuntersVOC's Rotor Products Offered
- 4.3.4 Munters VOC's Rotor Sales, Revenue and Gross Margin (2017-2022)
- 4.3.5 Munters VOC's Rotor Sales by Product in 2021
- 4.3.6 Munters VOC's Rotor Sales by Application in 2021
- 4.3.7 Munters VOC's Rotor Sales by Geographic Area in 2021
- 4.3.8 Munters Contact Information
- 4.4 Taikisha
- 4.4.1 Taikisha Corporation Information
- 4.4.2 TaikishaDescription, Business Overview
- 4.4.3 TaikishaVOC's Rotor Products Offered
- 4.4.4 Taikisha VOC's Rotor Sales, Revenue and Gross Margin (2017-2022)
- 4.4.5 Taikisha VOC's Rotor Sales by Product in 2021
- 4.4.6 Taikisha VOC's Rotor Sales by Application in 2021
- 4.4.7 Taikisha VOC's Rotor Sales by Geographic Area in 2021
- 4.4.8 Taikisha Contact Information
- 4.5 HSJ Environment Protection
- 4.5.1 HSJ Environment Protection Corporation Information
- 4.5.2 HSJ Environment ProtectionDescription, Business Overview
- 4.5.3 HSJ Environment Protection VOC's Rotor Products Offered
- 4.5.4 HSJ Environment Protection VOC's Rotor Sales, Revenue and Gross Margin (2017-2022)
- 4.5.5 HSJ Environment Protection VOC's Rotor Sales by Product in 2021
- 4.5.6 HSJ Environment Protection VOC's Rotor Sales by Application in 2021
- 4.5.7 HSJ Environment Protection VOC's Rotor Sales by Geographic Area in 2021
- 4.5.8 HSJ Environment Protection Contact Information
- 4.6 ProFlute
- 4.6.1 ProFlute Corporation Information
- 4.6.2 ProFluteDescription, Business Overview
- 4.6.3 ProFluteVOC's Rotor Products Offered
- 4.6.4 ProFlute VOC's Rotor Sales, Revenue and Gross Margin (2017-2022)
- 4.6.5 ProFlute VOC's Rotor Sales by Product in 2021
- 4.6.6 ProFlute VOC's Rotor Sales by Application in 2021
- 4.6.7 ProFlute VOC's Rotor Sales by Geographic Area in 2021
- 4.6.8 ProFlute Contact Information
5 Breakdown Databy Type
- 5.1 Global VOC's Rotor Sales by Type (2017-2028)
- 5.1.1 Global VOC's Rotor Sales by Type (2017-2022)
- 5.1.2 Global VOC's Rotor Sales Forecast by Type (2023-2028)
- 5.1.3 Global VOC's Rotor Sales Market Share by Type (2021)
- 5.2 Global VOC's Rotor Revenue Forecast by Type (2017-2028)
- 5.2.1 Global VOC's Rotor Revenue by Type (2017-2022)
- 5.2.2 Global VOC's Rotor Revenue Forecast by Type (2023-2028)
- 5.2.3 Global VOC's Rotor Revenue Market Share by Type (2021)
- 5.3 VOC's Rotor Average Selling Price (ASP)by Type (2017-2028)
- 5.3.1 Global VOC's Rotor Price by Type (2017-2022)
- 5.3.2 Global VOC's Rotor Price Forecast by Type (2023-2028)
6 Breakdown Databy Application
- 6.1 Global VOC's Rotor Sales by Application (2017-2028)
- 6.1.1 Global VOC's Rotor Sales by Application (2017-2022)
- 6.1.2 Global VOC's Rotor Sales Forecast by Application (2023-2028)
- 6.1.3 Global VOC's Rotor Sales Market Shareby Application (2021)
- 6.2 Global VOC's Rotor Revenue Forecast by Application (2017-2028)
- 6.2.1 Global VOC's Rotor Revenueby Application (2017-2022)
- 6.2.2 Global VOC's Rotor Revenue Forecast by Application (2023-2028)
- 6.2.3 Global VOC's Rotor Revenue Market Share by Application (2021)
- 6.3 VOC's Rotor Average Selling Price (ASP)by Application (2017-2028)
- 6.3.1 Global VOC's Rotor Price by Application (2017-2022)
- 6.3.2 Global VOC's Rotor Price Forecast by Application (2023-2028)
7 North America
- 7.1 North America VOC's Rotor Market Size YoY Growth 2017-2028
- 7.2 North America VOC's Rotor Market Facts & Figures by Country
- 7.2.1 North America VOC's Rotor Sales by Country (2017-2028)
- 7.2.2 North America VOC's Rotor Revenue by Country (2017-2028)
- 7.3 North America VOC's Rotor Sales by Type (2017-2022)
- 7.4 North America VOC's Rotor Sales by Application (2017-2022)
8 Asia-Pacific
- 8.1 Asia-Pacific VOC's Rotor Market Size YoY Growth 2017-2028
- 8.2 Asia-Pacific VOC's Rotor Market Facts & Figures by Region
- 8.2.1 Asia-Pacific VOC's Rotor Sales by Region(2017-2028)
- 8.2.2 Asia-Pacific VOC's Rotor Revenue by Region(2017-2028)
- 8.3 Asia-Pacific VOC's Rotor Sales by Type (2017-2022)
- 8.4 Asia-Pacific VOC's Rotor Sales by Application (2017-2022)
9 Europe
- 9.1 Europe VOC's Rotor Market Size YoY Growth 2017-2028
- 9.2 Europe VOC's Rotor Market Facts & Figures by Country
- 9.2.1 Europe VOC's Rotor Sales by Country (2017-2028)
- 9.2.2 Europe VOC's Rotor Revenue by Country (2017-2028)
- 9.3 Europe VOC's Rotor Sales by Type (2017-2022)
- 9.4 Europe VOC's Rotor Sales by Application (2017-2022)
10 Latin America
- 10.1 Latin America VOC's Rotor Market Size YoY Growth 2017-2028
- 10.2 Latin America VOC's Rotor Market Facts & Figures by Country
- 10.2.1 Latin America VOC's Rotor Sales by Country (2017-2028)
- 10.2.2 Latin AmericaVOC's Rotor Revenue by Country (2017-2028)
- 10.3 Latin America VOC's Rotor Sales by Type (2017-2022)
- 10.4 Latin America VOC's Rotor Sales by Application (2017-2022)
11 Middle East and Africa
- 11.1 Latin America VOC's Rotor Market Size YoY Growth 2017-2028
- 11.2 Middle East and Africa VOC's Rotor Market Facts & Figures by Country
- 11.2.1 Middle East and Africa VOC's Rotor Sales by Country (2017-2028)
- 11.2.2 Middle East and AfricaVOC's Rotor Revenue by Country (2017-2028)
- 11.3 Middle East and Africa VOC's Rotor Sales by Type (2017-2022)
- 11.4 Middle East and Africa VOC's Rotor Sales by Application (2017-2022)
12 Supply Chain and Sales Channel analysis
- 12.1 VOC's Rotor Supply Chain Analysis
- 12.2 VOC's Rotor Key Raw Materials and Upstream Suppliers
- 12.3 VOC's Rotor Clients Analysis
- 12.4 VOC's Rotor Distributors Analysis
13 VOC's Rotor Market Dynamics
- 13.1 VOC's Rotor Industry Trends
- 13.2 VOC's Rotor Market Drivers
- 13.3 VOC's Rotor Market Challenges
- 13.4 VOC's Rotor Porter's Five Forces Analysis
14 Research Findings and Conclusion
15 Appendix
- 15.1 Research Methodology
- 15.1.1 Methodology/Research Approach
- 15.1.2 Data Source
- 15.2 Author Details
- 15.3 Disclaimer