|
|
市場調査レポート
商品コード
1151784
サンドプラント機械の世界市場:2022年Global Sand Plant Machines Market Research Report 2022 |
||||||
|
|
|||||||
|
● お客様のご希望に応じて、既存データの加工や未掲載情報(例:国別セグメント)の追加などの対応が可能です。 詳細はお問い合わせください。 |
|||||||


| サンドプラント機械の世界市場:2022年 |
|
出版日: 2022年11月11日
発行: QYResearch
ページ情報: 英文 127 Pages
納期: 2~3営業日
|
- 全表示
- 概要
- 図表
- 目次
COVID-19の大流行により、世界のサンドプラント機械の市場規模は、2022年に7億4,960万米ドルと推定され、2028年までに10億8,975万米ドルに再調整され、2022年から2028年の予測期間中にCAGRで6.43%の成長が予測されています。
この健康危機による経済変化を十分に考慮すると、2021年にサンドプラント機械の世界市場の92.23%を占める従来型の砂型鋳造は、2028年までに10億2,205万米ドルに達し、2022年から2028年までのCAGRで改訂6.60%の成長が予測されています。クレーサンドセグメントは、この予測期間を通してCAGRで6.87%の成長に変更されています。
北米のサンドプラント機械の市場規模は2021年に1億2,063万米ドル、欧州は1億8,135万米ドルでした。北米の割合は2021年に16.92%、欧州は25.44%で、欧州の市場シェアは2028年には25.57%に達し、分析期間を通じてCAGRで6.50%の成長が予測されています。アジアでは、日本と韓国が注目すべき市場で、今後6年間のCAGRは、それぞれ6.18%と4.20%です。
世界のサンドプラント機械の主要メーカーは、Baoding Well、Eirich、Fondarc、DISA、CDE、Hidea、McLanahan、Qingdao Tianhui、Qingdao Tiangong、Qingdao Wuyangなどです。収益面では、世界の3大企業が、2021年のサンドプラント機械の市場シェアの35.65%を占めています。
目次
第1章 サンドプラント機械市場概要
- サンドプラント機械の製品概要と範囲
- サンドプラント機械のセグメント:タイプ別
- 世界のサンドプラント機械の市場規模の成長率分析:タイプ別(2022年、2028年)
- 従来型の砂型鋳造
- 特殊な鋳造
- サンドプラント機械のセグメント:用途別
- 世界のサンドプラント機械の市場規模の成長率分析:用途別(2022年、2028年)
- クレーサンド
- レジンサンド
- その他
- 世界市場の成長の見通し
- 世界の市場規模:地域別
第2章 市場競合:メーカー別
- 世界のサンドプラント機械の収益の市場シェア:メーカー別(2017年~2022年)
- サンドプラント機械の市場シェア:企業タイプ別(ティア1、ティア2、ティア3)
- サンドプラント機械メーカーの生産拠点、主要な提供エリア、製品タイプ
- サンドプラント機械市場の競合状況と動向
第3章 生産:地域別
- 世界のサンドプラント機械の収益の市場シェア:地域別(2017年~2022年)
- 北米のサンドプラント機械の収益
- 欧州のサンドプラント機械の生産
- 中国のサンドプラント機械の生産(2017年~2022年)
- 日本のサンドプラント機械の生産(2017年~2022年)
第4章 サンドプラント機械の消費:地域別
- 世界のサンドプラント機械の消費:地域別
- 北米
- 欧州
- アジア太平洋地域
- 南米
第5章 セグメント:タイプ別
- 世界のサンドプラント機械の収益の市場シェア:タイプ別(2017年~2022年)
第6章 セグメント:用途別
- 世界のサンドプラント機械の収益の市場シェア:用途別(2017年~2022年)
第7章 主要企業プロファイル
- BAODING WELL
- EIRICH
- FONDARC
- DISA
- CDE
- HIDEA
- MCLANAHAN
- QINGDAO TIANHUI
- QINGDAO TIANGONG
- QINGDAO WUYANG
- QINGDAO NUOXIN
- LUOYANG LONGZHONG HEAVY MACHINERY
- GANESH QUALITY EQUIPMENTS
- NANDHI ENGINEERING
第8章 サンドプラント機械の製造コスト分析
- サンドプラント機械の主要原材料分析
- 製造コスト構造の割合
- サンドプラント機械の製造プロセス分析
- サンドプラント機械の業界チェーン分析
第9章 マーケティングチャネル・ディストリビューター・顧客
- マーケティングチャネル
- サンドプラント機械のディストリビューターリスト
- サンドプラント機械の顧客
第10章 サンドプラント機械の市場力学
- サンドプラント機械の業界動向
- サンドプラント機械の市場促進要因
- サンドプラント機械の市場課題
- サンドプラント機械の市場抑制要因
第11章 生産・供給予測
- 世界のサンドプラント機械の収益予測:地域別(2023年~2028年)
- 北米のサンドプラント機械の収益予測(2023年~2028年)
- 欧州のサンドプラント機械の収益予測(2023年~2028年)
- 中国のサンドプラント機械の収益予測(2023年~2028年)
- 日本のサンドプラント機械の収益予測(2023年~2028年)
第12章 消費・需要予測
- 世界のサンドプラント機械の需要分析予測
- 北米のサンドプラント機械の消費予測:国別
- 欧州のサンドプラント機械の消費予測:国別
- アジア太平洋地域のサンドプラント機械の消費予測:地域別
- 南米のサンドプラント機械の消費予測:国別
第13章 予測:タイプ別・用途別
- 世界の生産・収益・価格予測:タイプ別(2023年~2028年)
- 世界の生産・収益・価格予測:用途別(2023年~2028年)
第14章 調査結果・結論
第15章 調査手法・データソース
LIST OF TABLES
- Table 1. Global Sand Plant Machines Market Size by Type (US$ Million) & (2022 VS 2028)
- Table 2. Global Sand Plant Machines Market Size by Application (US$ Million) & (2022 VS 2028)
- Table 3. Sand Plant Machines Market Size Comparison by Region: 2017 VS 2022 VS 2028
- Table 4. Global Sand Plant Machines Revenue by Manufacturers (2017-2022) & (US$ Million)
- Table 5. Global Sand Plant Machines Revenue Share by Manufacturers (2017-2022)
- Table 6. Company Type (Tier 1, Tier 2, and Tier 3) & (based on the Revenue in Sand Plant Machines as of 2021)
- Table 7. Manufacturers Sand Plant Machines Production Sites and Main Area Served
- Table 8. Manufacturers Sand Plant Machines Product Type
- Table 9. Global Sand Plant Machines Manufacturers Market Concentration Ratio (CR5)
- Table 10. Mergers & Acquisitions, Expansion Plans
- Table 11. Global Sand Plant Machines Revenue (US$ Million) by Region (2017-2022)
- Table 12. Global Sand Plant Machines Revenue Market Share by Region (2017-2022)
- Table 13. North America Sand Plant Machines Revenue (US$ Million) and Gross Margin (2017-2022)
- Table 14. Europe Sand Plant Machines Revenue (US$ Million) and Gross Margin (2017-2022)
- Table 15. China Sand Plant Machines Revenue (US$ Million) and Gross Margin (2017-2022)
- Table 16. Japan Sand Plant Machines Revenue (US$ Million) and Gross Margin (2017-2022)
- Table 17. Global Sand Plant Machines Consumption by Region (2017-2022) & (US$ Million)
- Table 18. Global Sand Plant Machines Consumption Market Share by Region (2017-2022)
- Table 19. North America Sand Plant Machines Consumption by Country (2017-2022) & (US$ Million)
- Table 20. Europe Sand Plant Machines Consumption by Country (2017-2022) & (US$ Million)
- Table 21. Asia Pacific Sand Plant Machines Consumption by Region (2017-2022) & (US$ Million)
- Table 22. South America Sand Plant Machines Consumption by Country (2017-2022) & (US$ Million)
- Table 23. Global Sand Plant Machines Revenue (US$ Million) by Type (2017-2022)
- Table 24. Global Sand Plant Machines Revenue Share by Type (2017-2022)
- Table 25. Global Sand Plant Machines Revenue (US$ Million) by Application (2017-2022)
- Table 26. Global Sand Plant Machines Revenue Share by Application (2017-2022)
- Table 27. Baoding Well Sand Plant Machines Corporation Information
- Table 28. Baoding Well Sand Plant Machines Specification and Application
- Table 29. Baoding Well Sand Plant Machines Revenue (US$ Million), Gross Margin (2017-2022)
- Table 30. Eirich Sand Plant Machines Corporation Information
- Table 31. Eirich Sand Plant Machines Specification and Application
- Table 32. Eirich Sand Plant Machines Revenue (US$ Million), Gross Margin (2017-2022)
- Table 33. Fondarc Sand Plant Machines Corporation Information
- Table 34. Fondarc Sand Plant Machines Specification and Application
- Table 35. Fondarc Sand Plant Machines Revenue (US$ Million), Gross Margin (2017-2022)
- Table 36. DISA Sand Plant Machines Corporation Information
- Table 37. DISA Sand Plant Machines Specification and Application
- Table 38. DISA Sand Plant Machines Revenue (US$ Million), Gross Margin (2017-2022)
- Table 39. CDE Sand Plant Machines Corporation Information
- Table 40. CDE Sand Plant Machines Specification and Application
- Table 41. CDE Sand Plant Machines Revenue (US$ Million), Gross Margin (2017-2022)
- Table 42. Hidea Sand Plant Machines Corporation Information
- Table 43. Hidea Sand Plant Machines Specification and Application
- Table 44. Hidea Sand Plant Machines Revenue (US$ Million), Gross Margin (2017-2022)
- Table 45. McLanahan Sand Plant Machines Corporation Information
- Table 46. McLanahan Sand Plant Machines Specification and Application
- Table 47. McLanahan Sand Plant Machines Revenue (US$ Million), Gross Margin (2017-2022)
- Table 48. Qingdao Tianhui Sand Plant Machines Corporation Information
- Table 49. Qingdao Tianhui Sand Plant Machines Specification and Application
- Table 50. Qingdao Tianhui Sand Plant Machines Revenue (US$ Million), Gross Margin (2017-2022)
- Table 51. Qingdao Tiangong Sand Plant Machines Corporation Information
- Table 52. Qingdao Tiangong Sand Plant Machines Specification and Application
- Table 53. Qingdao Tiangong Sand Plant Machines Revenue (US$ Million), Gross Margin (2017-2022)
- Table 54. Qingdao Wuyang Sand Plant Machines Corporation Information
- Table 55. Qingdao Wuyang Sand Plant Machines Specification and Application
- Table 56. Qingdao Wuyang Sand Plant Machines Revenue (US$ Million), Gross Margin (2017-2022)
- Table 57. Qingdao Nuoxin Sand Plant Machines Corporation Information
- Table 58. Qingdao Nuoxin Sand Plant Machines Specification and Application
- Table 59. Qingdao Nuoxin Sand Plant Machines Revenue (US$ Million), Gross Margin (2017-2022)
- Table 60. Luoyang Longzhong Heavy Machinery Sand Plant Machines Corporation Information
- Table 61. Luoyang Longzhong Heavy Machinery Sand Plant Machines Specification and Application
- Table 62. Luoyang Longzhong Heavy Machinery Sand Plant Machines Revenue (US$ Million), Gross Margin (2017-2022)
- Table 63. Ganesh Quality Equipments Sand Plant Machines Corporation Information
- Table 64. Ganesh Quality Equipments Sand Plant Machines Specification and Application
- Table 65. Ganesh Quality Equipments Sand Plant Machines Revenue (US$ Million), Gross Margin (2017-2022)
- Table 66. Nandhi Engineering Sand Plant Machines Corporation Information
- Table 67. Nandhi Engineering Sand Plant Machines Specification and Application
- Table 68. Nandhi Engineering Sand Plant Machines Revenue (US$ Million), Gross Margin (2017-2022)
- Table 69. Production Base and Market Concentration Rate of Raw Material
- Table 70. Key Suppliers of Raw Materials
- Table 71. Sand Plant Machines Distributors List
- Table 72. Sand Plant Machines Customers List
- Table 73. Sand Plant Machines Market Trends
- Table 74. Sand Plant Machines Market Drivers
- Table 75. Sand Plant Machines Market Challenges
- Table 76. Sand Plant Machines Market Restraints
- Table 77. Global Sand Plant Machines Revenue (US$ Million) Forecast by Region (2023-2028)
- Table 78. North America Sand Plant Machines Consumption Forecast by Country (2023-2028) & (US$ Million)
- Table 79. Europe Sand Plant Machines Consumption Forecast by Country (2023-2028) & (US$ Million)
- Table 80. Asia Pacific Sand Plant Machines Consumption Forecast by Region (2023-2028) & (US$ Million)
- Table 81. South America Sand Plant Machines Consumption Forecast by Country (2023-2028) & (US$ Million)
- Table 82. Global Sand Plant Machines Revenue Forecast by Type (2023-2028) & (US$ Million)
- Table 83. Global Sand Plant Machines Revenue Forecast by Application (2023-2028) & (US$ Million)
- Table 84. Research Programs/Design for This Report
- Table 85. Key Data Information from Secondary Sources
- Table 86. Key Data Information from Primary Sources
List of Figures
- Figure 1. Product Picture of Sand Plant Machines
- Figure 2. Global Sand Plant Machines Market Share by Type: 2022 VS 2028
- Figure 3. Global Sand Plant Machines Market Share by Application: 2022 VS 2028
- Figure 4. Clay Sand
- Figure 5. Resin Sand
- Figure 6. Global Sand Plant Machines Revenue (US$ Million), 2017 VS 2022 VS 2028
- Figure 7. Global Sand Plant Machines Revenue (US$ Million) (2017-2028)
- Figure 8. North America Sand Plant Machines Revenue (US$ Million) Growth Rate (2017-2028)
- Figure 9. Europe Sand Plant Machines Revenue (US$ Million) Growth Rate (2017-2028)
- Figure 10. China Sand Plant Machines Revenue (US$ Million) Growth Rate (2017-2028)
- Figure 11. Japan Sand Plant Machines Revenue (US$ Million) Growth Rate (2017-2028)
- Figure 12. Global Sand Plant Machines Revenue Share by Manufacturers in 2021
- Figure 13. Sand Plant Machines Market Share by Company Type (Tier 1, Tier 2, and Tier 3): 2017 VS 2021
- Figure 14. The Global 5 and 10 Largest Players: Market Share by Sand Plant Machines Revenue in 2021
- Figure 15. North America Sand Plant Machines Revenue (US$ Million) Growth Rate (2017-2022)
- Figure 16. Europe Sand Plant Machines Revenue (US$ Million) Growth Rate (2017-2022)
- Figure 17. China Sand Plant Machines Revenue (US$ Million) Growth Rate (2017-2022)
- Figure 18. Japan Sand Plant Machines Revenue (US$ Million) Growth Rate (2017-2022)
- Figure 19. Global Sand Plant Machines Consumption Market Share by Region (2017-2022)
- Figure 20. North America Sand Plant Machines Consumption and Growth Rate (2017-2022) & (US$ Million)
- Figure 21. North America Sand Plant Machines Consumption Market Share by Country in 2021
- Figure 22. U.S. Sand Plant Machines Consumption and Growth Rate (2017-2022) & (US$ Million)
- Figure 23. Canada Sand Plant Machines Consumption (US$ Million) and Growth Rate (2017-2022)
- Figure 24. Mexico Sand Plant Machines Consumption (US$ Million) and Growth Rate (2017-2022)
- Figure 25. Europe Sand Plant Machines Consumption and Growth Rate (2017-2022) & (US$ Million)
- Figure 26. Europe Sand Plant Machines Consumption Market Share by Country in 2021
- Figure 27. Germany Sand Plant Machines Consumption and Growth Rate (2017-2022) & (US$ Million)
- Figure 28. France Sand Plant Machines Consumption and Growth Rate (2017-2022) & (US$ Million)
- Figure 29. U.K. Sand Plant Machines Consumption and Growth Rate (2017-2022) & (US$ Million)
- Figure 30. Italy Sand Plant Machines Consumption and Growth Rate (2017-2022) & (US$ Million)
- Figure 31. Russia Sand Plant Machines Consumption and Growth Rate (2017-2022) & (US$ Million)
- Figure 32. Asia Pacific Sand Plant Machines Consumption and Growth Rate (2017-2022) & (US$ Million)
- Figure 33. Asia Pacific Sand Plant Machines Consumption Market Share by Region in 2021
- Figure 34. China Sand Plant Machines Consumption and Growth Rate (2017-2022) & (US$ Million)
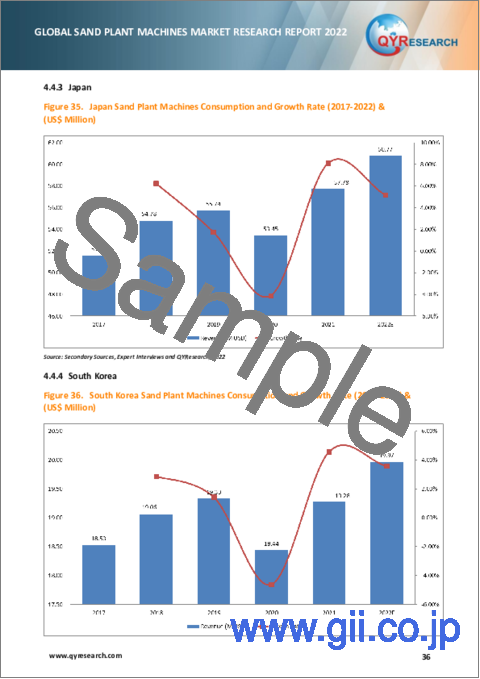
- Figure 35. Japan Sand Plant Machines Consumption and Growth Rate (2017-2022) & (US$ Million)
- Figure 36. South Korea Sand Plant Machines Consumption and Growth Rate (2017-2022) & (US$ Million)
- Figure 37. Southeast Asia Sand Plant Machines Consumption and Growth Rate (2017-2022) & (US$ Million)
- Figure 38. India Sand Plant Machines Consumption and Growth Rate (2017-2022) & (US$ Million)
- Figure 39. South America Sand Plant Machines Consumption and Growth Rate (2017-2022) & (US$ Million)
- Figure 40. South America Sand Plant Machines Consumption Market Share by Country in 2021
- Figure 41. Brazil Sand Plant Machines Consumption and Growth Rate (2017-2022) & (US$ Million)
- Figure 42. Revenue Share of Sand Plant Machines by Type (2017-2022)
- Figure 43. Revenue Market Share of Sand Plant Machines by Type in 2021
- Figure 44. Revenue Share of Sand Plant Machines by Application (2017-2022)
- Figure 45. Revenue Market Share of Sand Plant Machines by Application in 2021
- Figure 46. Manufacturing Process Analysis of Sand Plant Machines
- Figure 47. Sand Plant Machines Industrial Chain Analysis
- Figure 48. Channels of Distribution
- Figure 49. Distributors Profiles
- Figure 50. Global Sand Plant Machines Revenue Market Share Forecast by Region (2023-2028)
- Figure 51. North America Sand Plant Machines Revenue (US$ Million) Growth Rate Forecast (2023-2028)
- Figure 52. Europe Sand Plant Machines Revenue (US$ Million) Growth Rate Forecast (2023-2028)
- Figure 53. China Sand Plant Machines Revenue (US$ Million) Growth Rate Forecast (2023-2028)
- Figure 54. Japan Sand Plant Machines Revenue (US$ Million) Growth Rate Forecast (2023-2028)
- Figure 55. Global Forecasted Demand Analysis of Sand Plant Machines (2017-2028) & (US$ Million)
- Figure 56. Global Sand Plant Machines Revenue Market Share Forecast by Type (2023-2028)
- Figure 57. Global Sand Plant Machines Revenue Market Share Forecast by Application (2023-2028)
- Figure 58. Bottom-up and Top-down Approaches for This Report
- Figure 59. Data Triangulation 108
Market Analysis and Insights:
Due to the COVID-19 pandemic, the global Sand Plant Machines market size is estimated to be worth US$ 749.60 million in 2022 and is forecast to a readjusted size of US$ 1,089.75 million by 2028 with a CAGR of 6.43% during the forecast period 2022-2028. Fully considering the economic change by this health crisis, Conventional Sand Casting accounting for 92.23% of the Sand Plant Machines global market in 2021, is projected to value US$ 1,022.05 million by 2028, growing at a revised 6.60% CAGR from 2022 to 2028. While Clay Sand segment is altered to an 6.87% CAGR throughout this forecast period.
North America Sand Plant Machines market size was US$ 120.63 million in 2021, while Europe was US$ 181.35 million. The proportion of the North America was 16.92% in 2021, while Europe's percentage was 25.44%, and it is predicted that Europe market share will reach 25.57% in 2028, trailing a CAGR of 6.50% through the analysis period. As for the Asia, the notable markets are Japan and South Korea, CAGR is 6.18% and 4.20% respectively for the next 6-year period.
The global major manufacturers of Sand Plant Machines include Baoding Well, Eirich, Fondarc, DISA, CDE, Hidea, McLanahan, Qingdao Tianhui, Qingdao Tiangong, and Qingdao Wuyang, etc. In terms of revenue, the global three largest players hold a 35.65% market share of Sand Plant Machines in 2021.
Drivers and Restrains:
The research report has incorporated the analysis of different factors that augment the market's growth. It constitutes trends, restraints, and drivers that transform the market in either a positive or negative manner. This section also provides the scope of different segments and applications that can potentially influence the market in the future. The detailed information is based on current trends and historic milestones.
A thorough evaluation of the restrains included in the report portrays the contrast to drivers and gives room for strategic planning. Factors that overshadow the market growth are pivotal as they can be understood to devise different bends for getting hold of the lucrative opportunities that are present in the ever-growing market. Additionally, insights into market expert's opinions have been taken to understand the market better.
Segment Analysis:
The research report includes specific segments by region (country), by manufacturers, by Type and by Application. Each type provides information about the revenue during the forecast period of 2017 to 2028. by Application segment also provides consumption during the forecast period of 2017 to 2028. Understanding the segments helps in identifying the importance of different factors that aid the market growth.
By Company
- Baoding Well
- Eirich
- Fondarc
- CDE
- Hidea
- McLanahan
- Qingdao Tianhui
- Qingdao Tiangong
- Qingdao Wuyang
- Qingdao Nuoxin
- Luoyang Longzhong Heavy Machinery
- Ganesh Quality Equipments
- Nandhi Engineering
Segment by Type
- Conventional Sand Casting
- Special Casting
Segment by Application
- Clay Sand
- Resin Sand
- Others
Production by Region
- North America
- Europe
- China
- Japan
Consumption by Region
- North America
- U.S.
- Canada
- Mexico
- Asia-Pacific
- China
- Japan
- South Korea
- Southeast Asia
- India
- Europe
- Germany
- France
- U.K.
- Italy
- Russia
- Rest of Europe
- South America
- Brazil
- Rest of South America
TABLE OF CONTENTS
1 SAND PLANT MACHINES MARKET OVERVIEW
- 1.1 PRODUCT OVERVIEW AND SCOPE OF SAND PLANT MACHINES
- 1.2 SAND PLANT MACHINES SEGMENT BY TYPE
- 1.2.1 GLOBAL SAND PLANT MACHINES MARKET SIZE GROWTH RATE ANALYSIS BY TYPE: 2022 VS 2028
- 1.2.2 CONVENTIONAL SAND CASTING
- 1.2.3 SPECIAL CASTING
- 1.3 SAND PLANT MACHINES SEGMENT BY APPLICATION
- 1.3.1 GLOBAL SAND PLANT MACHINES MARKET SIZE GROWTH RATE ANALYSIS BY APPLICATION: 2022 VS 2028
- 1.3.2 CLAY SAND
- 1.3.3 RESIN SAND
- 1.3.4 OTHERS
- 1.4 GLOBAL MARKET GROWTH PROSPECTS
- 1.4.1 GLOBAL SAND PLANT MACHINES REVENUE ESTIMATES AND FORECASTS (2017-2028)
- 1.5 GLOBAL MARKET SIZE BY REGION
- 1.5.1 GLOBAL SAND PLANT MACHINES MARKET SIZE ESTIMATES AND FORECASTS BY REGION: 2017 VS 2022 VS 2028
- 1.5.2 NORTH AMERICA SAND PLANT MACHINES ESTIMATES AND FORECASTS (2017-2028)
- 1.5.3 EUROPE SAND PLANT MACHINES ESTIMATES AND FORECASTS (2017-2028)
- 1.5.4 CHINA SAND PLANT MACHINES ESTIMATES AND FORECASTS (2017-2028)
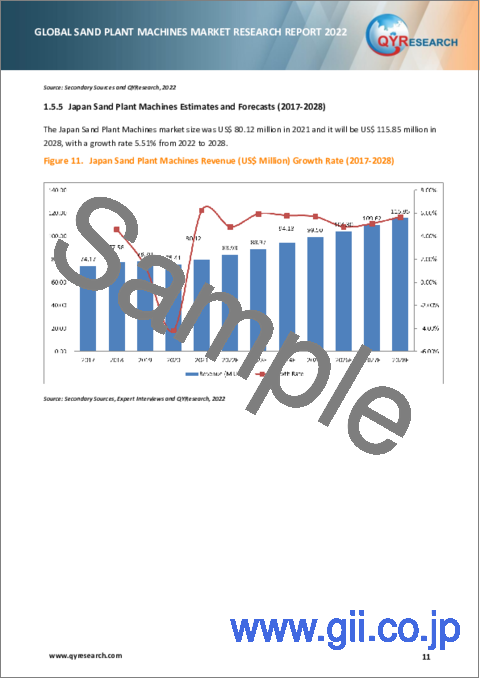
- 1.5.5 JAPAN SAND PLANT MACHINES ESTIMATES AND FORECASTS (2017-2028)
2 MARKET COMPETITION BY MANUFACTURERS
- 2.1 GLOBAL SAND PLANT MACHINES REVENUE MARKET SHARE BY MANUFACTURERS (2017-2022)
- 2.2 SAND PLANT MACHINES MARKET SHARE BY COMPANY TYPE (TIER 1, TIER 2, AND TIER 3)
- 2.3 MANUFACTURERS SAND PLANT MACHINES PRODUCTION SITES, MAIN AREA SERVED, PRODUCT TYPE
- 2.4 SAND PLANT MACHINES MARKET COMPETITIVE SITUATION AND TRENDS
- 2.4.1 SAND PLANT MACHINES MARKET CONCENTRATION RATE
- 2.4.2 GLOBAL 5 AND 10 LARGEST SAND PLANT MACHINES PLAYERS MARKET SHARE BY REVENUE
- 2.4.3 MERGERS & ACQUISITIONS, EXPANSION
3 PRODUCTION BY REGION
- 3.1 GLOBAL SAND PLANT MACHINES REVENUE MARKET SHARE BY REGION (2017-2022)
- 3.2 NORTH AMERICA SAND PLANT MACHINES REVENUE
- 3.2.1 NORTH AMERICA SAND PLANT MACHINES REVENUE GROWTH RATE (2017-2022)
- 3.2.2 NORTH AMERICA SAND PLANT MACHINES REVENUE AND GROSS MARGIN (2017-2022)
- 3.3 EUROPE SAND PLANT MACHINES PRODUCTION
- 3.3.1 EUROPE SAND PLANT MACHINES REVENUE GROWTH RATE (2017-2022)
- 3.3.2 EUROPE SAND PLANT MACHINES REVENUE AND GROSS MARGIN (2017-2022)
- 3.4 CHINA SAND PLANT MACHINES PRODUCTION (2017-2022)
- 3.4.1 CHINA SAND PLANT MACHINES REVENUE GROWTH RATE (2017-2022)
- 3.4.2 CHINA SAND PLANT MACHINES REVENUE AND GROSS MARGIN (2017-2022)
- 3.5 JAPAN SAND PLANT MACHINES PRODUCTION (2017-2022)
- 3.5.1 JAPAN SAND PLANT MACHINES REVENUE GROWTH RATE (2017-2022)
- 3.5.2 JAPAN SAND PLANT MACHINES REVENUE AND GROSS MARGIN (2017-2022)
4 SAND PLANT MACHINES CONSUMPTION BY REGION
- 4.1 GLOBAL SAND PLANT MACHINES CONSUMPTION BY REGION
- 4.1.1 GLOBAL SAND PLANT MACHINES CONSUMPTION BY REGION
- 4.1.2 GLOBAL SAND PLANT MACHINES CONSUMPTION MARKET SHARE BY REGION
- 4.2 NORTH AMERICA
- 4.2.1 NORTH AMERICA SAND PLANT MACHINES CONSUMPTION BY COUNTRY
- 4.2.2 U.S.
- 4.2.3 CANADA
- 4.2.4 MEXICO
- 4.3 EUROPE
- 4.3.1 EUROPE SAND PLANT MACHINES CONSUMPTION BY COUNTRY
- 4.3.2 GERMANY
- 4.3.3 FRANCE
- 4.3.4 U.K.
- 4.3.5 ITALY
- 4.3.6 RUSSIA
- 4.4 ASIA PACIFIC
- 4.4.1 ASIA PACIFIC SAND PLANT MACHINES CONSUMPTION BY REGION
- 4.4.2 CHINA
- 4.4.3 JAPAN
- 4.4.4 SOUTH KOREA
- 4.4.5 SOUTHEAST ASIA
- 4.4.6 INDIA
- 4.5 SOUTH AMERICA
- 4.5.1 SOUTH AMERICA SAND PLANT MACHINES CONSUMPTION BY COUNTRY
- 4.5.2 BRAZIL
5 SEGMENT BY TYPE
- 5.1 GLOBAL SAND PLANT MACHINES REVENUE MARKET SHARE BY TYPE (2017-2022)
6 SEGMENT BY APPLICATION
- 6.1 GLOBAL SAND PLANT MACHINES REVENUE MARKET SHARE BY APPLICATION (2017-2022)
7 KEY COMPANIES PROFILED
- 7.1 BAODING WELL
- 7.1.1 BAODING WELL SAND PLANT MACHINES CORPORATION INFORMATION
- 7.1.2 BAODING WELL SAND PLANT MACHINES PRODUCT PORTFOLIO
- 7.1.3 BAODING WELL SAND PLANT MACHINES REVENUE AND GROSS MARGIN (2017-2022)
- 7.1.4 BAODING WELL MAIN BUSINESS AND MARKETS SERVED
- 7.2 EIRICH
- 7.2.1 EIRICH SAND PLANT MACHINES CORPORATION INFORMATION
- 7.2.2 EIRICH SAND PLANT MACHINES PRODUCT PORTFOLIO
- 7.2.3 EIRICH SAND PLANT MACHINES REVENUE AND GROSS MARGIN (2017-2022)
- 7.2.4 EIRICH MAIN BUSINESS AND MARKETS SERVED
- 7.3 FONDARC
- 7.3.1 FONDARC SAND PLANT MACHINES CORPORATION INFORMATION
- 7.3.2 FONDARC SAND PLANT MACHINES PRODUCT PORTFOLIO
- 7.3.3 FONDARC SAND PLANT MACHINES REVENUE AND GROSS MARGIN (2017-2022)
- 7.3.4 FONDARC MAIN BUSINESS AND MARKETS SERVED
- 7.4 DISA
- 7.4.1 DISA SAND PLANT MACHINES CORPORATION INFORMATION
- 7.4.2 DISA SAND PLANT MACHINES PRODUCT PORTFOLIO
- 7.4.3 DISA SAND PLANT MACHINES REVENUE AND GROSS MARGIN (2017-2022)
- 7.4.4 DISA MAIN BUSINESS AND MARKETS SERVED
- 7.5 CDE
- 7.5.1 CDE SAND PLANT MACHINES CORPORATION INFORMATION
- 7.5.2 CDE SAND PLANT MACHINES PRODUCT PORTFOLIO
- 7.5.3 CDE SAND PLANT MACHINES REVENUE AND GROSS MARGIN (2017-2022)
- 7.5.4 CDE MAIN BUSINESS AND MARKETS SERVED
- 7.6 HIDEA
- 7.6.1 HIDEA SAND PLANT MACHINES CORPORATION INFORMATION
- 7.6.2 HIDEA SAND PLANT MACHINES PRODUCT PORTFOLIO
- 7.6.3 HIDEA SAND PLANT MACHINES REVENUE AND GROSS MARGIN (2017-2022)
- 7.6.4 HIDEA MAIN BUSINESS AND MARKETS SERVED
- 7.7 MCLANAHAN
- 7.7.1 MCLANAHAN SAND PLANT MACHINES CORPORATION INFORMATION
- 7.7.2 MCLANAHAN SAND PLANT MACHINES PRODUCT PORTFOLIO
- 7.7.3 MCLANAHAN SAND PLANT MACHINES REVENUE AND GROSS MARGIN (2017-2022)
- 7.7.4 MCLANAHAN MAIN BUSINESS AND MARKETS SERVED
- 7.8 QINGDAO TIANHUI
- 7.8.1 QINGDAO TIANHUI SAND PLANT MACHINES CORPORATION INFORMATION
- 7.8.2 QINGDAO TIANHUI SAND PLANT MACHINES PRODUCT PORTFOLIO
- 7.8.3 QINGDAO TIANHUI SAND PLANT MACHINES REVENUE AND GROSS MARGIN (2017-2022)
- 7.8.4 QINGDAO TIANHUI MAIN BUSINESS AND MARKETS SERVED
- 7.9 QINGDAO TIANGONG
- 7.9.1 QINGDAO TIANGONG SAND PLANT MACHINES CORPORATION INFORMATION
- 7.9.2 QINGDAO TIANGONG SAND PLANT MACHINES PRODUCT PORTFOLIO
- 7.9.3 QINGDAO TIANGONG SAND PLANT MACHINES REVENUE AND GROSS MARGIN (2017-2022)
- 7.9.4 QINGDAO TIANGONG MAIN BUSINESS AND MARKETS SERVED
- 7.10 QINGDAO WUYANG
- 7.10.1 QINGDAO WUYANG SAND PLANT MACHINES CORPORATION INFORMATION
- 7.10.2 QINGDAO WUYANG SAND PLANT MACHINES PRODUCT PORTFOLIO
- 7.10.3 QINGDAO WUYANG SAND PLANT MACHINES REVENUE AND GROSS MARGIN (2017-2022)
- 7.10.4 QINGDAO WUYANG MAIN BUSINESS AND MARKETS SERVED
- 7.11 QINGDAO NUOXIN
- 7.11.1 QINGDAO NUOXIN SAND PLANT MACHINES CORPORATION INFORMATION
- 7.11.2 QINGDAO NUOXIN SAND PLANT MACHINES PRODUCT PORTFOLIO
- 7.11.3 QINGDAO NUOXIN SAND PLANT MACHINES REVENUE AND GROSS MARGIN (2017-2022)
- 7.11.4 QINGDAO NUOXIN MAIN BUSINESS AND MARKETS SERVED
- 7.12 LUOYANG LONGZHONG HEAVY MACHINERY
- 7.12.1 LUOYANG LONGZHONG HEAVY MACHINERY SAND PLANT MACHINES CORPORATION INFORMATION
- 7.12.2 LUOYANG LONGZHONG HEAVY MACHINERY SAND PLANT MACHINES PRODUCT PORTFOLIO
- 7.12.3 LUOYANG LONGZHONG HEAVY MACHINERY SAND PLANT MACHINES REVENUE AND GROSS MARGIN (2017-2022)
- 7.12.4 LUOYANG LONGZHONG HEAVY MACHINERY MAIN BUSINESS AND MARKETS SERVED
- 7.13 GANESH QUALITY EQUIPMENTS
- 7.13.1 GANESH QUALITY EQUIPMENTS SAND PLANT MACHINES CORPORATION INFORMATION
- 7.13.2 GANESH QUALITY EQUIPMENTS SAND PLANT MACHINES PRODUCT PORTFOLIO
- 7.13.3 GANESH QUALITY EQUIPMENTS SAND PLANT MACHINES REVENUE AND GROSS MARGIN (2017-2022)
- 7.13.4 GANESH QUALITY EQUIPMENTS MAIN BUSINESS AND MARKETS SERVED
- 7.14 NANDHI ENGINEERING
- 7.14.1 NANDHI ENGINEERING SAND PLANT MACHINES CORPORATION INFORMATION
- 7.14.2 NANDHI ENGINEERING SAND PLANT MACHINES PRODUCT PORTFOLIO
- 7.14.3 NANDHI ENGINEERING SAND PLANT MACHINES REVENUE AND GROSS MARGIN (2017-2022)
- 7.14.4 NANDHI ENGINEERING MAIN BUSINESS AND MARKETS SERVED
8 SAND PLANT MACHINES MANUFACTURING COST ANALYSIS
- 8.1 SAND PLANT MACHINES KEY RAW MATERIALS ANALYSIS
- 8.1.1 KEY RAW MATERIALS
- 8.1.2 KEY SUPPLIERS OF RAW MATERIALS
- 8.2 PROPORTION OF MANUFACTURING COST STRUCTURE
- 8.3 MANUFACTURING PROCESS ANALYSIS OF SAND PLANT MACHINES
- 8.4 SAND PLANT MACHINES INDUSTRIAL CHAIN ANALYSIS
9 MARKETING CHANNEL, DISTRIBUTORS AND CUSTOMERS
- 9.1 MARKETING CHANNEL
- 9.2 SAND PLANT MACHINES DISTRIBUTORS LIST
- 9.3 SAND PLANT MACHINES CUSTOMERS
10 AND PLANT MACHINES MARKET DYNAMICS
- 10.1 SAND PLANT MACHINES INDUSTRY TRENDS
- 10.2 SAND PLANT MACHINES MARKET DRIVERS
- 10.3 SAND PLANT MACHINES MARKET CHALLENGES
- 10.4 SAND PLANT MACHINES MARKET RESTRAINTS
11 PRODUCTION AND SUPPLY FORECAST
- 11.1 GLOBAL FORECASTED REVENUE OF SAND PLANT MACHINES BY REGION (2023-2028)
- 11.2 NORTH AMERICA SAND PLANT MACHINES REVENUE FORECAST (2023-2028)
- 11.3 EUROPE SAND PLANT MACHINES REVENUE FORECAST (2023-2028)
- 11.4 CHINA SAND PLANT MACHINES REVENUE FORECAST (2023-2028)
- 11.5 JAPAN SAND PLANT MACHINES REVENUE FORECAST (2023-2028)
12 CONSUMPTION AND DEMAND FORECAST
- 12.1 GLOBAL FORECASTED DEMAND ANALYSIS OF SAND PLANT MACHINES
- 12.2 NORTH AMERICA FORECASTED CONSUMPTION OF SAND PLANT MACHINES BY COUNTRY
- 12.3 EUROPE MARKET FORECASTED CONSUMPTION OF SAND PLANT MACHINES BY COUNTRY
- 12.4 ASIA PACIFIC MARKET FORECASTED CONSUMPTION OF SAND PLANT MACHINES BY REGION
- 12.5 SOUTH AMERICA FORECASTED CONSUMPTION OF SAND PLANT MACHINES BY COUNTRY
13 FORECAST BY TYPE AND BY APPLICATION
- 13.1 GLOBAL FORECASTED REVENUE OF SAND PLANT MACHINES BY TYPE (2023-2028)
- 13.2 GLOBAL FORECASTED REVENUE OF SAND PLANT MACHINES BY APPLICATION (2023-2028)
14 RESEARCH FINDINGS AND CONCLUSION
15 METHODOLOGY AND DATA SOURCE
- 15.1 METHODOLOGY/RESEARCH APPROACH
- 15.1.1 RESEARCH PROGRAMS/DESIGN
- 15.1.2 MARKET SIZE ESTIMATION
- 15.1.3 MARKET BREAKDOWN AND DATA TRIANGULATION
- 15.2 DATA SOURCE
- 15.2.1 SECONDARY SOURCES
- 15.2.2 PRIMARY SOURCES
- 15.3 AUTHOR LIST
- 15.4 DISCLAIMER