|
|
市場調査レポート
商品コード
1142043
薬用アミノ酸の世界市場:分析・沿革・予測 (2017年~2028年)Global Pharmaceutical Amino Acids Market Report, History and Forecast 2017-2028 |
||||||
|
|
|||||||
|
● お客様のご希望に応じて、既存データの加工や未掲載情報(例:国別セグメント)の追加などの対応が可能です。 詳細はお問い合わせください。 |
|||||||


| 薬用アミノ酸の世界市場:分析・沿革・予測 (2017年~2028年) |
|
出版日: 2022年10月24日
発行: QYResearch
ページ情報: 英文 177 Pages
納期: 2~3営業日
|
- 全表示
- 概要
- 図表
- 目次
世界の薬用アミノ酸市場は、2021年に13億2,613万米ドルと評価され、2028年末には15億6,919万米ドルに達し、2022年から2028年の間に2.5%のCAGRで成長すると予測されています。
一方、2022年の市場成長率 (数量ベース) は6.99%を超えると予想されています。
薬用アミノ酸市場は、世界的に需要が拡大しており、今後も着実な成長が予測されます。特にバイオ医薬品を中心とした高品質なアミノ酸の需要が伸びています。また、抗体医薬やバイオシミラーの開発が進んでいることから、バイオ医薬品向け培地市場は今後も高い成長が期待されています。ただし、ウクライナ情勢に起因する流通の遅れや原燃料価格の高騰などの要因に注視する必要があります。
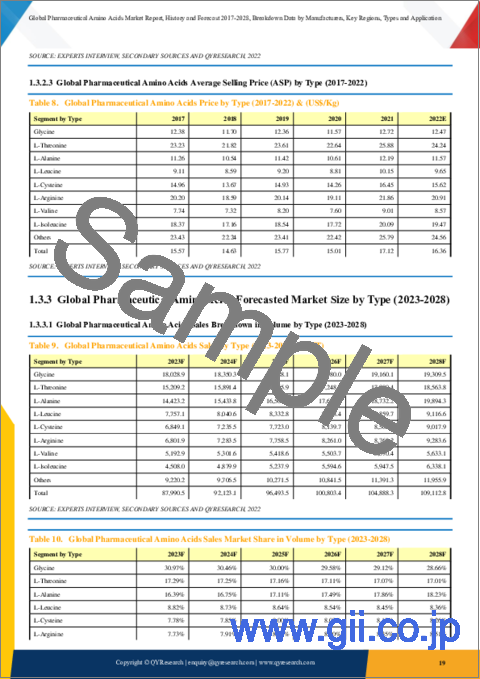
種類別に見ると、グリシンが最も規模が大きく、2021年の販売量は16,650トンとなり、全体の約31.68%を占めています。一方、L-アラニンやL-イソロイシンセグメントは、予測期間中に最も高いCAGRを記録すると予測されます。
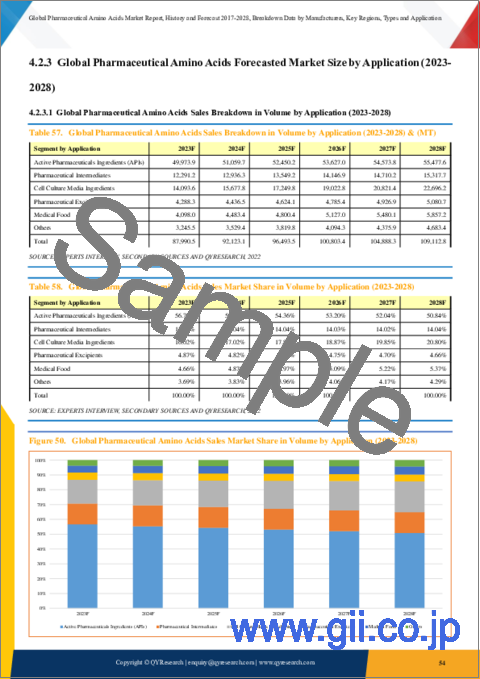
用途別では、医薬品原薬(API)であると推定されます。細胞培養液原料は、今後数年間、医薬品アミノ酸市場で最も速い成長率を示すと予想されます。
地域別では、北米 (USMCA) が予測期間中に最大の市場になると予測されています。一方、中国やインドなどの新興国では薬用アミノ酸の需要が高いです。高い成長とイノベーション、そして業界の統合が、この地域の市場を牽引すると予想されます。
当レポートでは、世界の薬用アミノ酸の市場について分析し、種類別・用途別・地域別 (国別) の市場動向の見通し (2017年~2028年)、主要企業のプロファイルなどについて調査しております。
目次
第1章 薬用アミノ酸:市場概要
- 薬用アミノ酸:製品概要
- 種類別の市場セグメント
- グリシン
- L-トレオニン
- L-アラニン
- L-ロイシン
- L-システイン
- L-アルギニン
- L-バリン
- L-イソロイシン
- その他
- 種類別の市場規模
- 市場規模の概要:種類別 (2017年~2028年)
- 過去の市場規模:種類別 (2017年~2022年)
- 市場規模の予測:種類別 (2023年~2028年)
- 主要地域の市場規模:種類別
- 北米の薬用アミノ酸の販売:種類別 (2017年~2022年)
- 欧州の薬用アミノ酸の販売:種類別 (2017年~2022年)
- アジアの薬用アミノ酸の販売:種類別 (2017年~2022年)
- 中東の薬用アミノ酸の販売:種類別 (2017年~2022年)
- 中南米の薬用アミノ酸の販売:種類別 (2017年~2022年)
- CIS諸国の薬用アミノ酸の販売:種類別 (2017年~2022年)
- アフリカの薬用アミノ酸の販売:種類別 (2017年~2022年)
- オセアニアの薬用アミノ酸の販売:種類別 (2017年~2022年)
第2章 薬用アミノ酸:企業別の市場競争
- 世界の薬用アミノ酸の主要企業の販売 (2017年~2022年)
- 世界の薬用アミノ酸の主要企業の収益 (2017年~2022年)
- 世界の薬用アミノ酸の主要企業の価格 (2017年~2022年)
- 世界の薬用アミノ酸の主要メーカーの製造拠点
- 薬用アミノ酸市場の競争状況と動向
- 世界の主要メーカー:企業の種類別 (ティア1、ティア2、ティア3) (収益別、2021年)
第3章 薬用アミノ酸:地域別の現状と展望
- 世界の薬用アミノ酸の市場規模・CAGR:地域別 (2017年・2021年・2028年)
- 過去の市場規模:地域別
- 市場規模の予測:地域別
第4章 薬用アミノ酸:用途別
- 用途別の市場セグメント
- 医薬品原薬 (API)
- 医薬中間体
- 細胞培地成分
- 医薬品添加剤
- 医療食
- その他
- 用途別の市場規模
- 市場規模の概要:用途別 (2017年~2028年)
- 過去の市場規模:用途別 (2017年~2022年)
- 市場規模の予測:用途別 (2023年~2028年)
- 主要地域の市場規模:用途別
- 北米の薬用アミノ酸の販売:用途別 (2017年~2022年)
- 欧州の薬用アミノ酸の販売:用途別 (2017年~2022年)
- アジアの薬用アミノ酸の販売:用途別 (2017年~2022年)
- 中東の薬用アミノ酸の販売:用途別 (2017年~2022年)
- 中南米の薬用アミノ酸の販売:用途別 (2017年~2022年)
- CIS諸国の薬用アミノ酸の販売:用途別 (2017年~2022年)
- アフリカの薬用アミノ酸の販売:用途別 (2017年~2022年)
- オセアニアの薬用アミノ酸の販売:用途別 (2017年~2022年)
第5章 北米の薬用アミノ酸:地域別
- 過去の販売:地域別
- 販売の予測:地域別
第6章 アジアの薬用アミノ酸:国別
第7章 欧州の薬用アミノ酸:地域別
第8章 中東の薬用アミノ酸:国別
第8章 中南米の薬用アミノ酸:国別
第10章 企業プロファイル:薬用アミノ酸事業の主要指標
- Ajinomoto (日本)
- Evonik(ドイツ)
- Kyowa Hakko (日本)
- AMINO(ドイツ)
- MeiHua Holdings Group (中国)
- Tianjin Tianyao (中国)
- Jingjing (中国)
- Wuxi Jinghai (中国)
- Jiahe Biotech (中国)
- Hubei Bafeng (中国)
- Grand Hoyo (中国)
- Yichang Sanxia Proudin (中国)
- Shine Star (中国)
第11章 上流工程・機会・課題・リスク・影響要因の分析
- 薬用アミノ酸の主要原材料
- 製造コストの構造
- 薬用アミノ酸の産業チェーンの分析
- 薬用アミノ酸の市場力学
第12章 マーケティング戦略分析、流通業者
- 販売チャンネル
- 薬用アミノ酸の流通業者
- 薬用アミノ酸の下流工程の顧客
第13章 調査結果と結論
第14章 付録
LIST OF TABLES
- Table 1. Properties of Common Amino Acids
- Table 2. Global Pharmaceutical Amino Acids Sales Breakdown in Volume, by Type: 2017 VS 2021 VS 2028 (MT)
- Table 3. Global Pharmaceutical Amino Acids Sales in Value by Type: 2017 VS 2021 VS 2028 (US$ Million)
- Table 4. Global Pharmaceutical Amino Acids Sales by Type (2017-2022) & (MT)
- Table 5. Global Pharmaceutical Amino Acids Sales Market Share in Volume by Type (2017-2022)
- Table 6. Global Pharmaceutical Amino Acids Sales in Value by Type (2017-2022) & (US$ Million)
- Table 7. Global Pharmaceutical Amino Acids Sales Market Share in Value by Type (2017-2022)
- Table 8. Global Pharmaceutical Amino Acids Price by Type (2017-2022) & (US$/Kg)
- Table 9. Global Pharmaceutical Amino Acids Sales by Type (2023-2028) & (MT)
- Table 10. Global Pharmaceutical Amino Acids Sales Market Share in Volume by Type (2023-2028)
- Table 11. Global Pharmaceutical Amino Acids Sales by Type (2023-2028) & (US$ Million)
- Table 12. Global Pharmaceutical Amino Acids Sales Market Share in Value by Type (2023-2028)
- Table 13. Global Pharmaceutical Amino Acids Price by Type (2023-2028) & (US$/Kg)
- Table 14. USMCA Pharmaceutical Amino Acids Sales by Type (2017-2022) & (MT)
- Table 15. USMCA Pharmaceutical Amino Acids Sales by Type (2017-2022) & (US$ Million)
- Table 16. Europe Pharmaceutical Amino Acids Sales by Type (2017-2022) & (MT)
- Table 17. Europe Pharmaceutical Amino Acids Sales by Type (2017-2022) & (US$ Million)
- Table 18. Asia Pharmaceutical Amino Acids Sales by Type (2017-2022) & (MT)
- Table 19. Asia Pharmaceutical Amino Acids Sales by Type (2017-2022) & (US$ Million)
- Table 20. Middle East Pharmaceutical Amino Acids Sales by Type (2017-2022) & (MT)
- Table 21. Middle East Pharmaceutical Amino Acids Sales by Type (2017-2022) & (US$ Million)
- Table 22. Central & South America Pharmaceutical Amino Acids Sales by Type (2017-2022) & (MT)
- Table 23. Central & South America Pharmaceutical Amino Acids Sales by Type (2017-2022) & (US$ Million)
- Table 24. CIS Pharmaceutical Amino Acids Sales by Type (2017-2022) & (MT)
- Table 25. CIS Pharmaceutical Amino Acids Sales by Type (2017-2022) & (US$ Million)
- Table 26. Africa Pharmaceutical Amino Acids Sales by Type (2017-2022) & (MT)
- Table 27. Africa Pharmaceutical Amino Acids Sales by Type (2017-2022) & (US$ Million)
- Table 28. Oceania Pharmaceutical Amino Acids Sales by Type (2017-2022) & (MT)
- Table 29. Oceania Pharmaceutical Amino Acids Sales by Type (2017-2022) & (US$ Million)
- Table 30. Global Pharmaceutical Amino Acids Sales by Company (2017-2022) & (MT)
- Table 31. Global Pharmaceutical Amino Acids Sales Share by Company (2017-2022)
- Table 32. Global Pharmaceutical Amino Acids Revenue by Company (2017-2022) & (US$ Million)
- Table 33. Global Pharmaceutical Amino Acids Revenue Share by Company (2017-2022)
- Table 34. Global Market Pharmaceutical Amino Acids Price by Company (2017-2022) & (US$/Kg)
- Table 35. Global Pharmaceutical Amino Acids Top Manufacturers Manufacturing Base and Headquarters
- Table 36. Global Pharmaceutical Amino Acids Manufacturers Market Concentration Ratio
- Table 37. Global Top Manufacturers Market Share by Company Type (Tier 1, Tier 2, and Tier 3) & (based on the Revenue in Pharmaceutical Amino Acids as of 2021)
- Table 38. Global Pharmaceutical Amino Acids Sales Breakdown in Volume, by Region: 2017 VS 2021 VS 2028 (MT)
- Table 39. Global Pharmaceutical Amino Acids Sales in Value by Region: 2017 VS 2021 VS 2028 (US$ Million)
- Table 40. Global Pharmaceutical Amino Acids Sales by Region (2017-2022) & (MT)
- Table 41. Global Pharmaceutical Amino Acids Sales Market Share in Volume by Region (2017-2022)
- Table 42. Global Pharmaceutical Amino Acids Sales by Region (2017-2022) & (US$ Million)
- Table 43. Global Pharmaceutical Amino Acids Sales Market Share in Value by Region (2017-2022)
- Table 44. Global Pharmaceutical Amino Acids Sales (MT), Value (US$ Million), Price (US$/Kg) and Gross Margin (2017-2022)
- Table 45. Global Pharmaceutical Amino Acids Sales by Region (2023-2028) & (MT)
- Table 46. Global Pharmaceutical Amino Acids Sales Market Share in Volume by Region (2023-2028)
- Table 47. Global Pharmaceutical Amino Acids Sales by Region (2023-2028) & (US$ Million)
- Table 48. Global Pharmaceutical Amino Acids Sales Market Share in Value by Region (2023-2028)
- Table 49. Global Pharmaceutical Amino Acids Sales (MT), Value (US$ Million), Price (US$/Kg) and Gross Margin (2023-2028)
- Table 50. Global Pharmaceutical Amino Acids Sales Breakdown in Volume, by Application: 2017 VS 2021 VS 2028 (MT)
- Table 51. Global Pharmaceutical Amino Acids Sales Breakdown in Value, by Application: 2017 VS 2021 VS 2028 (US$ Million)
- Table 52. Global Pharmaceutical Amino Acids Sales Breakdown in Volume, by Application (2017-2022) & (MT)
- Table 53. Global Pharmaceutical Amino Acids Sales Market Share in Volume by Application (2017-2022)
- Table 54. Global Pharmaceutical Amino Acids Sales Breakdown in Value, by Application (2017-2022) & (US$ Million)
- Table 55. Global Pharmaceutical Amino Acids Sales Market Share in Value by Application (2017-2022)
- Table 56. Global Pharmaceutical Amino Acids Average Selling Price by Application (2017-2022) & (US$/Kg)
- Table 57. Global Pharmaceutical Amino Acids Sales Breakdown in Volume by Application (2023-2028) & (MT)
- Table 58. Global Pharmaceutical Amino Acids Sales Market Share in Volume by Application (2023-2028)
- Table 59. Global Pharmaceutical Amino Acids Sales Breakdown in Value by Application (2023-2028) & (US$ Million)
- Table 60. Global Pharmaceutical Amino Acids Sales Market Share in Value by Application (2023-2028)
- Table 61. Global Pharmaceutical Amino Acids Sales Market Share in Value by Application (2023-2028)
- Table 62. Global Pharmaceutical Amino Acids Average Selling Price by Application (2023-2028) & (US$/Kg)
- Table 63. USMCA Pharmaceutical Amino Acids Sales in Volume by Application (2017-2022) & (MT)
- Table 64. USMCA Pharmaceutical Amino Acids Sales in Value by Application (2017-2022) & (US$ Million)
- Table 65. Europe Pharmaceutical Amino Acids Sales in Volume by Application (2017-2022) & (MT)
- Table 66. Europe Pharmaceutical Amino Acids Sales in Value by Application (2017-2022) & (US$ Million)
- Table 67. Asia Pharmaceutical Amino Acids Sales in Volume by Application (2017-2022) & (MT)
- Table 68. Asia Pharmaceutical Amino Acids Sales in Value by Application (2017-2022) & (US$ Million)
- Table 69. Middle East Pharmaceutical Amino Acids Sales in Volume by Application (2017-2022) & (MT)
- Table 70. Middle East Pharmaceutical Amino Acids Sales in Value by Application (2017-2022) & (US$ Million)
- Table 71. Central & South America Pharmaceutical Amino Acids Sales in Volume by Application (2017-2022) & (MT)
- Table 72. Central & South America Pharmaceutical Amino Acids Sales in Value by Application (2017-2022) & (US$ Million)
- Table 73. CIS Pharmaceutical Amino Acids Sales in Volume by Application (2017-2022) & (MT)
- Table 74. CIS Pharmaceutical Amino Acids Sales in Value by Application (2017-2022) & (US$ Million)
- Table 75. Africa Pharmaceutical Amino Acids Sales in Volume by Application (2017-2022) & (MT)
- Table 76. Africa Pharmaceutical Amino Acids Sales in Value by Application (2017-2022) & (US$ Million)
- Table 77. Oceania Pharmaceutical Amino Acids Sales in Volume by Application (2017-2022) & (MT)
- Table 78. Oceania Pharmaceutical Amino Acids Sales in Value by Application (2017-2022) & (US$ Million)
- Table 79. USMCA Pharmaceutical Amino Acids Sales by Region (2017-2022) & (MT)
- Table 80. USMCA Pharmaceutical Amino Acids Sales Market Share in Volumeby Region (2017-2022)
- Table 81. USMCA Pharmaceutical Amino Acids Sales by Region (2017-2022) & (US$ Million)
- Table 82. USMCA Pharmaceutical Amino Acids Sales Market Share in Value by Region (2017-2022)
- Table 83. USMCA Pharmaceutical Amino Acids Sales by Region (2023-2028) & (MT)
- Table 84. USMCA Pharmaceutical Amino Acids Sales Market Share in Volume by Region (2023-2028)
- Table 85. USMCA Pharmaceutical Amino Acids Sales by Region (2023-2028) & (US$ Million)
- Table 86. USMCA Pharmaceutical Amino Acids Sales Market Share in Value by Region (2023-2028)
- Table 87. Asia Pharmaceutical Amino Acids Sales by Region (2017-2022) & (MT)
- Table 88. Asia Pharmaceutical Amino Acids Sales Market Share in Volumeby Region (2017-2022)
- Table 89. Asia Pharmaceutical Amino Acids Sales by Region (2017-2022) & (US$ Million)
- Table 90. Asia Pharmaceutical Amino Acids Sales Market Share in Value by Region (2017-2022)
- Table 91. Asia Pharmaceutical Amino Acids Sales by Region (2023-2028) & (MT)
- Table 92. Asia Pharmaceutical Amino Acids Sales Market Share in Volume by Region (2023-2028)
- Table 93. Asia Pharmaceutical Amino Acids Sales by Region (2023-2028) & (US$ Million)
- Table 94. Asia Pharmaceutical Amino Acids Sales Market Share in Value by Region (2023-2028)
- Table 95. Europe Pharmaceutical Amino Acids Sales by Country (2017-2022) & (MT)
- Table 96. Europe Pharmaceutical Amino Acids Sales Market Share in Volume by Country (2017-2022)
- Table 97. Europe Pharmaceutical Amino Acids Sales by Country (2017-2022) & (US$ Million)
- Table 98. Europe Pharmaceutical Amino Acids Sales Market Share in Value by Country (2017-2022)
- Table 99. Europe Pharmaceutical Amino Acids Sales by Country (2023-2028) & (MT)
- Table 100. Europe Pharmaceutical Amino Acids Sales Market Share in Volume by Country (2023-2028)
- Table 101. Europe Pharmaceutical Amino Acids Sales by Country (2023-2028) & (US$ Million)
- Table 102. Europe Pharmaceutical Amino Acids Sales Market Share in Value by Country (2023-2028)
- Table 103. Middle East Pharmaceutical Amino Acids Sales by Region (2017-2022) & (MT)
- Table 104. Middle East Pharmaceutical Amino Acids Sales Market Share in Volumeby Region (2017-2022)
- Table 105. Middle East Pharmaceutical Amino Acids Sales by Region (2017-2022) & (US$ Million)
- Table 106. Middle East Pharmaceutical Amino Acids Sales Market Share in Value by Region (2017-2022)
- Table 107. Middle East Pharmaceutical Amino Acids Sales by Region (2023-2028) & (MT)
- Table 108. Middle East Pharmaceutical Amino Acids Sales Market Share in Volume by Region (2023-2028)
- Table 109. Middle East Pharmaceutical Amino Acids Sales by Region (2023-2028) & (US$ Million)
- Table 110. Middle East Pharmaceutical Amino Acids Sales Market Share in Value by Region (2023-2028)
- Table 111. Central & South America Pharmaceutical Amino Acids Sales by Region (2017-2022) & (MT)
- Table 112. Central & South America Pharmaceutical Amino Acids Sales Market Share in Volumeby Region (2017-2022)
- Table 113. Central & South America Pharmaceutical Amino Acids Sales by Region (2017-2022) & (US$ Million)
- Table 114. Central & South America Pharmaceutical Amino Acids Sales Market Share in Value by Region (2017-2022)
- Table 115. Central & South America Pharmaceutical Amino Acids Sales by Region (2023-2028) & (MT)
- Table 116. Central & South America Pharmaceutical Amino Acids Sales Market Share in Volume by Region (2023-2028)
- Table 117. Central & South America Pharmaceutical Amino Acids Sales by Region (2023-2028) & (US$ Million)
- Table 118. Central & South America Pharmaceutical Amino Acids Sales Market Share in Value by Region (2023-2028)
- Table 119. Ajinomoto Corporation Information
- Table 120. Ajinomoto Introduction and Business Overview
- Table 121. Ajinomoto Pharmaceutical Amino Acids Sales (MT), Revenue (US$ Million), Price (US$/Kg) and Gross Margin (2017-2022)
- Table 122. Ajinomoto Pharmaceutical Amino Acids Product
- Table 123. Ajinomoto Recent Development
- Table 124. Evonik Corporation Information
- Table 125. Evonik Introduction and Business Overview
- Table 126. Evonik Pharmaceutical Amino Acids Sales (MT), Revenue (US$ Million), Price (US$/Kg) and Gross Margin (2017-2022)
- Table 127. Evonik Pharmaceutical Amino Acids Product
- Table 128. Evonik Recent Development
- Table 129. Kyowa Hakko Corporation Information
- Table 130. Kyowa Hakko Introduction and Business Overview
- Table 131. Kyowa Hakko Pharmaceutical Amino Acids Sales (MT), Revenue (US$ Million), Price (US$/Kg) and Gross Margin (2017-2022)
- Table 132. Kyowa Hakko Pharmaceutical Amino Acids Product
- Table 133. Kyowa Hakko Recent Development
- Table 134. AMINO Corporation Information
- Table 135. AMINO Introduction and Business Overview
- Table 136. AMINO Pharmaceutical Amino Acids Sales (MT), Revenue (US$ Million), Price (US$/Kg) and Gross Margin (2017-2022)
- Table 137. AMINO Pharmaceutical Amino Acids Product
- Table 138. AMINO Recent Development
- Table 139. MeiHua Holdings Group Corporation Information
- Table 140. MeiHua Holdings Group Introduction and Business Overview
- Table 141. MeiHua Holdings Group Pharmaceutical Amino Acids Sales (MT), Revenue (US$ Million), Price (US$/Kg) and Gross Margin (2017-2022)
- Table 142. MeiHua Holdings Group Pharmaceutical Amino Acids Product
- Table 143. MeiHua Holdings Group Recent Development
- Table 144. Tianjin Tianyao Corporation Information
- Table 145. Tianjin Tianyao Introduction and Business Overview
- Table 146. Tianjin Tianyao Pharmaceutical Amino Acids Sales (MT), Revenue (US$ Million), Price (US$/Kg) and Gross Margin (2017-2022)
- Table 147. Tianjin Tianyao Pharmaceutical Amino Acids Product
- Table 148. Jingjing Corporation Information
- Table 149. Jingjing Introduction and Business Overview
- Table 150. Jingjing Pharmaceutical Amino Acids Sales (MT), Revenue (US$ Million), Price (US$/Kg) and Gross Margin (2017-2022)
- Table 151. Jingjing Pharmaceutical Amino Acids Product
- Table 152. Wuxi Jinghai Corporation Information
- Table 153. Wuxi Jinghai Introduction and Business Overview
- Table 154. Wuxi Jinghai Pharmaceutical Amino Acids Sales (MT), Revenue (US$ Million), Price (US$/Kg) and Gross Margin (2017-2022)
- Table 155. Wuxi Jinghai Pharmaceutical Amino Acids Product
- Table 156. Jiahe Biotech Corporation Information
- Table 157. Jiahe Biotech Introduction and Business Overview
- Table 158. Jiahe Biotech Pharmaceutical Amino Acids Sales (MT), Revenue (US$ Million), Price (US$/Kg) and Gross Margin (2017-2022)
- Table 159. Jiahe Biotech Pharmaceutical Amino Acids Product
- Table 160. Hubei Bafeng Corporation Information
- Table 161. Hubei Bafeng Introduction and Business Overview
- Table 162. Hubei Bafeng Pharmaceutical Amino Acids Sales (MT), Revenue (US$ Million), Price (US$/Kg) and Gross Margin (2017-2022)
- Table 163. Hubei Bafeng Pharmaceutical Amino Acids Product
- Table 164. Hubei Bafeng Recent Development
- Table 165. Grand Hoyo Corporation Information
- Table 166. Grand Hoyo Introduction and Business Overview
- Table 167. Grand Hoyo Pharmaceutical Amino Acids Sales (MT), Revenue (US$ Million), Price (US$/Kg) and Gross Margin (2017-2022)
- Table 168. Grand Hoyo Pharmaceutical Amino Acids Product
- Table 169. Grand Hoyo Recent Development
- Table 170. Yichang Sanxia Proudin Corporation Information
- Table 171. Yichang Sanxia Proudin Introduction and Business Overview
- Table 172. Yichang Sanxia Proudin Pharmaceutical Amino Acids Sales (MT), Revenue (US$ Million), Price (US$/Kg) and Gross Margin (2017-2022)
- Table 173. Yichang Sanxia Proudin Pharmaceutical Amino Acids Product
- Table 174. Yichang Sanxia Proudin Recent Development
- Table 175. Shine Star Corporation Information
- Table 176. Shine Star Introduction and Business Overview
- Table 177. Shine Star Pharmaceutical Amino Acids Sales (MT), Revenue (US$ Million), Price (US$/Kg) and Gross Margin (2017-2022)
- Table 178. Shine Star Pharmaceutical Amino Acids Product
- Table 179. World Corn Supply and Demand Balance Sheet
- Table 180. Raw Materials Key Suppliers Lists
- Table 181. Pharmaceutical Amino Acids Market Trends
- Table 182. Pharmaceutical Amino Acids Market Drivers
- Table 183. Pharmaceutical Amino Acids Market Challenges
- Table 184. Pharmaceutical Amino Acids Market Restraints
- Table 185. Pharmaceutical Amino Acids Downstream Customers
- Table 186. Research Programs/Design for This Report
- Table 187. Key Data Information from Secondary Sources
- Table 188. Key Data Information from Primary Sources
List of Figures
- Figure 1. Pharmaceutical Amino Acids Product Picture
- Figure 2. Global Pharmaceutical Amino Acids Market Size, 2017 VS 2021 VS 2028 (US$ Million)
- Figure 3. Global Pharmaceutical Amino Acids Market Size Status and Outlook (2017-2028) & (US$ Million)
- Figure 4. Global Pharmaceutical Amino Acids Sales Status and Outlook (2017-2028) & (MT)
- Figure 5. Product Picture of Glycine
- Figure 6. Global Glycine Sales YoY Growth (2017-2028) & (MT)
- Figure 7. Product Picture of L-Threonine
- Figure 8. Global L-Threonine Sales YoY Growth (2017-2028) & (MT)
- Figure 9. Product Picture of L-Alanine
- Figure 10. Global L-Alanine Sales YoY Growth (2017-2028) & (MT)
- Figure 11. Product Picture of L-Leucine
- Figure 12. Global L-Leucine Sales YoY Growth (2017-2028) & (MT)
- Figure 13. Product Picture of L-Cysteine
- Figure 14. Global L-Cysteine Sales YoY Growth (2017-2028) & (MT)
- Figure 15. Product Picture of L-Arginine
- Figure 16. Global L-Arginine Sales YoY Growth (2017-2028) & (MT)
- Figure 17. Product Picture of L-Valine
- Figure 18. Global L-Valine Sales YoY Growth (2017-2028) & (MT)
- Figure 19. Product Picture of L-Isoleucine
- Figure 20. Global L-Isoleucine Sales YoY Growth (2017-2028) & (MT)
- Figure 21. Global Pharmaceutical Amino Acids Sales Breakdown in Volume, by Type (2017-2028) & (MT)
- Figure 22. Global Pharmaceutical Amino Acids Sales in Value by Type (2017-2028) & (US$ Million)
- Figure 23. Global Pharmaceutical Amino Acids Sales Market Share in Volume by Type (2017-2022)
- Figure 24. Global Pharmaceutical Amino Acids Sales Market Share in Value by Type (2017-2022)
- Figure 25. USMCA Pharmaceutical Amino Acids Sales Market Share in Volume by Type in 2021
- Figure 26. Europe Pharmaceutical Amino Acids Sales Market Share in Volume by Type in 2021
- Figure 27. Asia Pharmaceutical Amino Acids Sales Market Share in Volume by Type in 2021
- Figure 28. Middle East Pharmaceutical Amino Acids Sales Market Share in Volume by Type in 2021
- Figure 29. Central & South America Pharmaceutical Amino Acids Sales Market Share in Volume by Type in 2021
- Figure 30. CIS Pharmaceutical Amino Acids Sales Market Share in Volume by Type in 2021
- Figure 31. Africa Pharmaceutical Amino Acids Sales Market Share in Volume by Type in 2021
- Figure 32. Oceania Pharmaceutical Amino Acids Sales Market Share in Volume by Type in 2021
- Figure 33. The 5 and 10 Largest Manufacturers in the World: Market Share by Pharmaceutical Amino Acids Revenue in 2021
- Figure 34. Global Pharmaceutical Amino Acids Sales Breakdown in Volume, by Region (2017-2028) & (MT)
- Figure 35. Global Pharmaceutical Amino Acids Sales in Value by Region (2017-2028) & (US$ Million)
- Figure 36. Amino Acids for Active Pharmaceuticals Ingredients (APIs) Applications
- Figure 37. Global Active Pharmaceuticals Ingredients (APIs) Sales YoY Growth (2017-2028) & (MT)
- Figure 38. Amino Acids for Pharmaceutical Intermediates Applications
- Figure 39. Global Pharmaceutical Intermediates Sales YoY Growth (2017-2028) & (MT)
- Figure 40. Amino Acids for Cell Culture Media Ingredients Applications
- Figure 41. Global Cell Culture Media Ingredients Sales YoY Growth (2017-2028) & (MT)
- Figure 42. Amino Acids for Pharmaceutical Excipients Applications
- Figure 43. Global Pharmaceutical Excipients Sales YoY Growth (2017-2028) & (MT)
- Figure 44. Amino Acids for Medical Food Applications
- Figure 45. Global Medical Food Sales YoY Growth (2017-2028) & (MT)
- Figure 46. Global Pharmaceutical Amino Acids Sales Breakdown in Volume, by Application (2017-2028) & (MT)
- Figure 47. Global Pharmaceutical Amino Acids Sales Breakdown in Value, by Application (2017-2028) & (US$ Million)
- Figure 48. Global Pharmaceutical Amino Acids Sales Market Share in Volume by Application (2017-2022)
- Figure 49. Global Pharmaceutical Amino Acids Sales Market Share in Value by Application (2017-2022)
- Figure 50. Global Pharmaceutical Amino Acids Sales Market Share in Volume by Application (2023-2028)
- Figure 51. USMCA Pharmaceutical Amino Acids Sales Market Share in Volume by Application in 2021
- Figure 52. Europe Pharmaceutical Amino Acids Sales Market Share in Volume by Application in 2021
- Figure 53. Asia Pharmaceutical Amino Acids Sales Market Share in Volume by Application in 2021
- Figure 54. Middle East Pharmaceutical Amino Acids Sales Market Share in Volume by Application in 2021
- Figure 55. Central & South America Pharmaceutical Amino Acids Sales Market Share in Volume by Application in 2021
- Figure 56. CIS Pharmaceutical Amino Acids Sales Market Share in Volume by Application in 2021
- Figure 57. Africa Pharmaceutical Amino Acids Sales Market Share in Volume by Application in 2021
- Figure 58. Oceania Pharmaceutical Amino Acids Sales Market Share in Volume by Application in 2021
- Figure 59. Ajinomoto Amino Acids for Pharmaceuticals and Foods Picture
- Figure 60. Evonik Amino Acids for Pharmaceuticals Process Integration of The Sensible Kind
- Figure 61. Evonik Amino Acids for Pharmaceuticals and Foods Picture
- Figure 62. Kyowa Hakko Amino Acids for Pharmaceuticals Picture
- Figure 63. MeiHua Holdings Group Amino Acids for Pharmaceuticals Picture
- Figure 64. Jingjing Amino Acids for Pharmaceuticals Picture
- Figure 65. Hubei Bafeng Amino Acids for Pharmaceuticals Picture
- Figure 66. Global Corn Long-term Price Trends (US$ per bushel)
- Figure 67. Amino Acids Manufacturing Cost Structure
- Figure 68. Pharmaceutical Amino Acids Industrial Chain Analysis
- Figure 69. Channels of Distribution
- Figure 70. Distributors Profiles
- Figure 71. Bottom-up and Top-down Approaches for This Report
- Figure 72. Data Triangulation 156
Market Analysis and Insights:
The global Pharmaceutical Amino Acids market was valued at US$ 1,326.13 million in 2021 and will reach US$ 1,569.19 million by the end of 2028, growing at a CAGR of 2.5% during 2022-2028.
In the industry, the key players in the global Pharmaceutical Amino Acids market are like Ajinomoto, Evonik, Kyowa Hakko, AMINO, Meihua Holding Group, Tianjin Tianyao, Jingjing, Wuxi Jinghai, Jiahe Biotech, Hubei Bafeng, Grand Hoyo, Yichang Sanxia Proudin and Shine Star, etc. Ajinomoto shipments most in 2021 and recent years, while Evonik and Kyowa Hakko ranked 2 and 3.The gap of market share is keep on enlarged due to different strategy. The market concentration ratio in the past three years. The top five manufacturers held 67.44% of the market, in terms of Pharmaceutical Amino Acids revenue in 2021.
Asia has the largest global export quantity and manufacturers in Pharmaceutical Amino Acids market, global leading companies all have production bases in China.
Demand is growing worldwide in the market for amino acids for pharmaceuticals, and steady growth is forecast to continue. The demand for high-quality amino acids centering on the biopharmaceuticals business in particular is growing. Also, since development is proceeding on antibody drugs and biosimilars (follow-on biologics), strong growth is expected to continue in the culture media market for biopharmaceuticals. However, we must keep a close watch on factors such as distribution delays and the skyrocketing costs of raw materials and fuel stemming from the Ukraine situation.
On the basis of amino acids type, the Pharmaceutical Amino Acids market has been segmented into Glycine, L-Threonine, L-Alanine, L-Leucine, L-Cysteine, L-Arginine, L-Valine, L-Isoleucine and Others. Glycine is the largest type, Glycine accounts for about 31.68% of the total sales in 2021, with a sales volume of 16,650 metric tons. The L-Alanine and L-Isoleucine segment of Pharmaceutical Amino Acids is projected to register the highest CAGR during the forecast period.
Active Pharmaceuticals Ingredients (APIs) is estimated to be the largest application of Pharmaceutical Amino Acids. Cell Culture Media Ingredients are expected to show the fastest growth rates in the Pharmaceutical Amino Acids market in the coming years.
Affected by the COVID-19, the operating rate of small manufacturer has declined, and the market share of large manufacturer has increased rapidly. It is expected that major manufacturer will continue to expand production capacity in the next five years.
The market growth rate (by volume) is expected to exceed 6.99% in 2022.
On the basis of region, the Pharmaceutical Amino Acids market has been segmented into Asia, Europe, USMCA, Middle East, CIS, Central & South America, Africa, Oceania. USMCA is projected to be the largest market during the forecast period. The demand for Pharmaceutical Amino Acids is high in developing economies such as China and India. High growth and innovation, along with industry consolidations, are expected to drive the market in the region.
In terms of production side, this report researches the Pharmaceutical Amino Acids capacity, production, growth rate, market share by manufacturers and regional level and country level, from 2017 to 2022, and forecast to 2028.
The production capacity in this report is mainly based on the nameplate capacity, and the manufacturer's capacity data includes the part of the joint venture.
It should be pointed out that the revenue market size described in this report refers to the output value calculated according to the market price of Pharmaceutical Amino Acids. Most Pharmaceutical Amino Acids production enterprises have downstream derivatives manufacturing business, and the Pharmaceutical Amino Acids traded between enterprises are usually quoted based on the market price, plus processing fees.
In this report, MT refers to Metric Tones.
In terms of sales side, this report focuses on the sales of Pharmaceutical Amino Acids by regions (countries), company, by Progress and by Application. from 2017 to 2022 and forecast to 2028.
The global Pharmaceutical Amino Acids market is thoroughly, accurately, and comprehensively assessed in the report with a large focus on market dynamics, market competition, regional growth, segmental analysis, and key growth strategies. Buyers of the report will have access to verified market figures, including global market size in terms of revenue and volume. As part of production analysis, the authors of the report have provided reliable estimations and calculations for global revenue and volume by Progress segment of the global Pharmaceutical Amino Acids market. These figures have been provided in terms of both revenue and volume for the period 2017-2028. Additionally, the report provides accurate figures for production by region in terms of revenue as well as volume for the same period. The report also includes production capacity statistics for the same period.
By Company
- Ajinomoto
- Evonik
- Kyowa Hakko
- AMINO
- Meihua Holding Group
- Tianjin Tianyao
- Jingjing
- Wuxi Jinghai
- Jiahe Biotech
- Hubei Bafeng
- Grand Hoyo
- Yichang Sanxia Proudin
- Shine Star
Segment by Type
- Glycine
- L-Threonine
- L-Alanine
- L-Leucine
- L-Cysteine
- L-Arginine
- L-Valine
- L-Isoleucine
- Others
Segment by Application
- Active Pharmaceuticals Ingredients (APIs)
- Pharmaceutical Intermediates
- Cell Culture Media Ingredients
- Pharmaceutical Excipients
- Medical Food
- Others
Sales by Region
- Asia Pacific
- Europe
- USMCA
- Middle East and Africa
- CIS
- Central & South America
- China
- Japan
- South Korea
- India
- Taiwan China
- Indonesia
- Thailand
- Germany
- France
- Italy
- United Kingdom
- Netherlands
- Spain
- Switzerland
- United States
- Mexico
- Canada
- Saudi Arabia
- Iran
- Brazil
- Argentina
TABLE OF CONTENTS
1 PHARMACEUTICAL AMINO ACIDS MARKET OVERVIEW
- 1.1 Pharmaceutical Amino Acids Product Overview
- 1.2 Pharmaceutical Amino Acids Market Segment by Type
- 1.2.1 Glycine
- 1.2.2 L-Threonine
- 1.2.3 L-Alanine
- 1.2.4 L-Leucine
- 1.2.5 L-Cysteine
- 1.2.6 L-Arginine
- 1.2.7 L-Valine
- 1.2.8 L-Isoleucine
- 1.2.9 Others
- 1.3 Global Pharmaceutical Amino Acids Market Size by Type
- 1.3.1 Global Pharmaceutical Amino Acids Market Size Overview by Type (2017-2028)
- 1.3.2 Global Pharmaceutical Amino Acids Historic Market Size Review by Type (2017-2022)
- 1.3.3 Global Pharmaceutical Amino Acids Forecasted Market Size by Type (2023-2028)
- 1.4 Key Regions Market Size Segment by Type
- 1.4.1 USMCA Pharmaceutical Amino Acids Sales Breakdown by Type (2017-2022)
- 1.4.2 Europe Pharmaceutical Amino Acids Sales Breakdown by Type (2017-2022)
- 1.4.3 Asia Pharmaceutical Amino Acids Sales Breakdown by Type (2017-2022)
- 1.4.4 Middle East Pharmaceutical Amino Acids Sales Breakdown by Type (2017-2022)
- 1.4.5 Central & South America Pharmaceutical Amino Acids Sales Breakdown by Type (2017-2022)
- 1.4.6 CIS Pharmaceutical Amino Acids Sales Breakdown by Type (2017-2022)
- 1.4.7 Africa Pharmaceutical Amino Acids Sales Breakdown by Type (2017-2022)
- 1.4.8 Oceania Pharmaceutical Amino Acids Sales Breakdown by Type (2017-2022)
2 PHARMACEUTICAL AMINO ACIDS MARKET COMPETITION BY COMPANY
- 2.1 Global Top Players by Pharmaceutical Amino Acids Sales (2017-2022)
- 2.2 Global Top Players by Pharmaceutical Amino Acids Revenue (2017-2022)
- 2.3 Global Top Players by Pharmaceutical Amino Acids Price (2017-2022)
- 2.4 Global Top Manufacturers Pharmaceutical Amino Acids Manufacturing Base
- 2.5 Pharmaceutical Amino Acids Market Competitive Situation and Trends
- 2.5.1 Pharmaceutical Amino Acids Market Concentration Rate (2017-2022)
- 2.5.2 Global 5 and 10 Largest Manufacturers by Pharmaceutical Amino Acids Sales and Revenue in 2021
- 2.6 Global Top Manufacturers by Company Type (Tier 1, Tier 2, and Tier 3) & (based on the Revenue in Pharmaceutical Amino Acids as of 2021)
3 PHARMACEUTICAL AMINO ACIDS STATUS AND OUTLOOK BY REGION
- 3.1 Global Pharmaceutical Amino Acids Market Size and CAGR by Region: 2017 VS 2021 VS 2028
- 3.2 Global Pharmaceutical Amino Acids Historic Market Size by Region
- 3.2.1 Global Pharmaceutical Amino Acids Sales in Volume by Region (2017-2022)
- 3.2.2 Global Pharmaceutical Amino Acids Sales in Value by Region (2017-2022)
- 3.2.3 Global Pharmaceutical Amino Acids Sales (Volume & Value), Price and Gross Margin (2017-2022)
- 3.3 Global Pharmaceutical Amino Acids Forecasted Market Size by Region
- 3.3.1 Global Pharmaceutical Amino Acids Sales in Volume by Region (2023-2028)
- 3.3.2 Global Pharmaceutical Amino Acids Sales in Value by Region (2023-2028)
- 3.3.3 Global Pharmaceutical Amino Acids Sales (Volume & Value), Price and Gross Margin (2023-2028)
4 PHARMACEUTICAL AMINO ACIDS BY APPLICATION
- 4.1 Pharmaceutical Amino Acids Market Segment by Application
- 4.1.1 Active Pharmaceuticals Ingredients (APIs)
- 4.1.2 Pharmaceutical Intermediates
- 4.1.3 Cell Culture Media Ingredients
- 4.1.4 Pharmaceutical Excipients
- 4.1.5 Medical Food
- 4.1.6 Others
- 4.2 Global Pharmaceutical Amino Acids Market Size by Application
- 4.2.1 Global Pharmaceutical Amino Acids Market Size Overview by Application (2017-2028)
- 4.2.2 Global Pharmaceutical Amino Acids Historic Market Size Review by Application (2017-2022)
- 4.2.3 Global Pharmaceutical Amino Acids Forecasted Market Size by Application (2023-2028)
- 4.3 Key Regions Market Size Segment by Application
- 4.3.1 USMCA Pharmaceutical Amino Acids Sales Breakdown by Application (2017-2022)
- 4.3.2 Europe Pharmaceutical Amino Acids Sales Breakdown by Application (2017-2022)
- 4.3.3 Asia Pharmaceutical Amino Acids Sales Breakdown by Application (2017-2022)
- 4.3.4 Middle East Pharmaceutical Amino Acids Sales Breakdown by Application (2017-2022)
- 4.3.5 Central & South America Pharmaceutical Amino Acids Sales Breakdown by Application (2017-2022)
- 4.3.6 CIS Pharmaceutical Amino Acids Sales Breakdown by Application (2017-2022)
- 4.3.7 Africa Pharmaceutical Amino Acids Sales Breakdown by Application (2017-2022)
- 4.3.8 Oceania Pharmaceutical Amino Acids Sales Breakdown by Application (2017-2022)
5 USMCA PHARMACEUTICAL AMINO ACIDS BY REGION
- 5.1 USMCA Pharmaceutical Amino Acids Historic Market Size by Region
- 5.1.1 USMCA Pharmaceutical Amino Acids Sales in Volume by Region (2017-2022)
- 5.1.2 USMCA Pharmaceutical Amino Acids Sales in Value by Region (2017-2022)
- 5.2 USMCA Pharmaceutical Amino Acids Forecasted Market Size by Region
- 5.2.1 USMCA Pharmaceutical Amino Acids Sales in Volume by Region (2023-2028)
- 5.2.2 USMCA Pharmaceutical Amino Acids Sales in Value by Region (2023-2028)
6 ASIA PHARMACEUTICAL AMINO ACIDS BY REGION
- 6.1 Asia Pharmaceutical Amino Acids Historic Market Size by Region
- 6.1.1 Asia Pharmaceutical Amino Acids Sales in Volume by Region (2017-2022)
- 6.1.2 Asia Pharmaceutical Amino Acids Sales in Value by Region (2017-2022)
- 6.2 Asia Pharmaceutical Amino Acids Forecasted Market Size by Region
- 6.2.1 Asia Pharmaceutical Amino Acids Sales in Volume by Region (2023-2028)
- 6.2.2 Asia Pharmaceutical Amino Acids Sales in Value by Region (2023-2028)
7 EUROPE PHARMACEUTICAL AMINO ACIDS BY COUNTRY
- 7.1 Europe Pharmaceutical Amino Acids Historic Market Size by Country
- 7.1.1 Europe Pharmaceutical Amino Acids Sales in Volume by Country (2017-2022)
- 7.1.2 Europe Pharmaceutical Amino Acids Sales in Value by Country (2017-2022)
- 7.2 Europe Pharmaceutical Amino Acids Forecasted Market Size by Country
- 7.2.1 Europe Pharmaceutical Amino Acids Sales in Volume by Country (2023-2028)
- 7.2.2 Europe Pharmaceutical Amino Acids Sales in Value by Country (2023-2028)
8 MIDDLE EAST PHARMACEUTICAL AMINO ACIDS BY REGION
- 8.1 Middle East Pharmaceutical Amino Acids Historic Market Size by Region
- 8.1.1 Middle East Pharmaceutical Amino Acids Sales in Volume by Region (2017-2022)
- 8.1.2 Middle East Pharmaceutical Amino Acids Sales in Value by Region (2017-2022)
- 8.2 Middle East Pharmaceutical Amino Acids Forecasted Market Size by Region
- 8.2.1 Middle East Pharmaceutical Amino Acids Sales in Volume by Region (2023-2028)
- 8.2.2 Middle East Pharmaceutical Amino Acids Sales in Value by Region (2023-2028)
9 CENTRAL & SOUTH AMERICA PHARMACEUTICAL AMINO ACIDS BY REGION
- 9.1 Central & South America Pharmaceutical Amino Acids Historic Market Size by Region
- 9.1.1 Central & South America Pharmaceutical Amino Acids Sales in Volume by Region (2017-2022)
- 9.1.2 Central & South America Pharmaceutical Amino Acids Sales in Value by Region (2017-2022)
- 9.2 Central & South America Pharmaceutical Amino Acids Forecasted Market Size by Region
- 9.2.1 Central & South America Pharmaceutical Amino Acids Sales in Volume by Region (2023-2028)
- 9.2.2 Central & South America Pharmaceutical Amino Acids Sales in Value by Region (2023-2028)
10 COMPANY PROFILES AND KEY FIGURES IN PHARMACEUTICAL AMINO ACIDS BUSINESS
- 10.1 Ajinomoto (Japan)
- 10.1.1 Ajinomoto Corporation Information
- 10.1.2 Ajinomoto Introduction and Business Overview
- 10.1.3 Ajinomoto Pharmaceutical Amino Acids Sales, Revenue and Gross Margin (2017-2022)
- 10.1.4 Ajinomoto Pharmaceutical Amino Acids Products Offered
- 10.1.5 Ajinomoto Recent Development
- 10.2 Evonik (Germany)
- 10.2.1 Evonik Corporation Information
- 10.2.2 Evonik Introduction and Business Overview
- 10.2.3 Evonik Pharmaceutical Amino Acids Sales, Revenue and Gross Margin (2017-2022)
- 10.2.4 Evonik Pharmaceutical Amino Acids Products Offered
- 10.2.5 Evonik Recent Development
- 10.3 Kyowa Hakko (Japan)
- 10.3.1 Kyowa Hakko Corporation Information
- 10.3.2 Kyowa Hakko Introduction and Business Overview
- 10.3.3 Kyowa Hakko Pharmaceutical Amino Acids Sales, Revenue and Gross Margin (2017-2022)
- 10.3.4 Kyowa Hakko Pharmaceutical Amino Acids Products Offered
- 10.3.5 Kyowa Hakko Recent Development
- 10.4 AMINO (Germany)
- 10.4.1 AMINO Corporation Information
- 10.4.2 AMINO Introduction and Business Overview
- 10.4.3 AMINO Pharmaceutical Amino Acids Sales, Revenue and Gross Margin (2017-2022)
- 10.4.4 AMINO Pharmaceutical Amino Acids Products Offered
- 10.4.5 AMINO Recent Development
- 10.5 MeiHua Holdings Group (China)
- 10.5.1 MeiHua Holdings Group Corporation Information
- 10.5.2 MeiHua Holdings Group Introduction and Business Overview
- 10.5.3 MeiHua Holdings Group Pharmaceutical Amino Acids Sales, Revenue and Gross Margin (2017-2022)
- 10.5.4 MeiHua Holdings Group Pharmaceutical Amino Acids Products Offered
- 10.5.5 MeiHua Holdings Group Recent Development
- 10.6 Tianjin Tianyao (China)
- 10.6.1 Tianjin Tianyao Corporation Information
- 10.6.2 Tianjin Tianyao Introduction and Business Overview
- 10.6.3 Tianjin Tianyao Pharmaceutical Amino Acids Sales, Revenue and Gross Margin (2017-2022)
- 10.6.4 Tianjin Tianyao Pharmaceutical Amino Acids Products Offered
- 10.7 Jingjing (China)
- 10.7.1 Jingjing Corporation Information
- 10.7.2 Jingjing Introduction and Business Overview
- 10.7.3 Jingjing Pharmaceutical Amino Acids Sales, Revenue and Gross Margin (2017-2022)
- 10.7.4 Jingjing Pharmaceutical Amino Acids Products Offered
- 10.8 Wuxi Jinghai (China)
- 10.8.1 Wuxi Jinghai Corporation Information
- 10.8.2 Wuxi Jinghai Introduction and Business Overview
- 10.8.3 Wuxi Jinghai Pharmaceutical Amino Acids Sales, Revenue and Gross Margin (2017-2022)
- 10.8.4 Wuxi Jinghai Pharmaceutical Amino Acids Products Offered
- 10.9 Jiahe Biotech (China)
- 10.9.1 Jiahe Biotech Corporation Information
- 10.9.2 Jiahe Biotech Introduction and Business Overview
- 10.9.3 Jiahe Biotech Pharmaceutical Amino Acids Sales, Revenue and Gross Margin (2017-2022)
- 10.9.4 Jiahe Biotech Pharmaceutical Amino Acids Products Offered
- 10.10 Hubei Bafeng (China)
- 10.10.1 Hubei Bafeng Corporation Information
- 10.10.2 Hubei Bafeng Introduction and Business Overview
- 10.10.3 Hubei Bafeng Pharmaceutical Amino Acids Sales, Revenue and Gross Margin (2017-2022)
- 10.10.4 Hubei Bafeng Pharmaceutical Amino Acids Products Offered
- 10.10.5 Hubei Bafeng Recent Development
- 10.11 Grand Hoyo (China)
- 10.11.1 Grand Hoyo Corporation Information
- 10.11.2 Grand Hoyo Introduction and Business Overview
- 10.11.3 Grand Hoyo Pharmaceutical Amino Acids Sales, Revenue and Gross Margin (2017-2022)
- 10.11.4 Grand Hoyo Pharmaceutical Amino Acids Products Offered
- 10.11.5 Grand Hoyo Recent Development
- 10.12 Yichang Sanxia Proudin (China)
- 10.12.1 Yichang Sanxia Proudin Corporation Information
- 10.12.2 Yichang Sanxia Proudin Introduction and Business Overview
- 10.12.3 Yichang Sanxia Proudin Pharmaceutical Amino Acids Sales, Revenue and Gross Margin (2017-2022)
- 10.12.4 Yichang Sanxia Proudin Pharmaceutical Amino Acids Products Offered
- 10.12.5 Yichang Sanxia Proudin Recent Development
- 10.13 Shine Star (China)
- 10.13.1 Shine Star Corporation Information
- 10.13.2 Shine Star Introduction and Business Overview
- 10.13.3 Shine Star Pharmaceutical Amino Acids Sales, Revenue and Gross Margin (2017-2022)
- 10.13.4 Shine Star Pharmaceutical Amino Acids Products Offered
11 UPSTREAM, OPPORTUNITIES, CHALLENGES, RISKS AND INFLUENCES FACTORS ANALYSIS
- 11.1 Pharmaceutical Amino Acids Key Raw Materials
- 11.1.1 Key Raw Materials
- 11.1.2 Key Raw Materials Price
- 11.1.3 Raw Materials Key Suppliers
- 11.2 Manufacturing Cost Structure
- 11.3 Pharmaceutical Amino Acids Industrial Chain Analysis
- 11.4 Pharmaceutical Amino Acids Market Dynamics
- 11.4.1 Industry Trends
- 11.4.2 Market Drivers
- 11.4.3 Market Challenges
- 11.4.4 Market Restraints
12 MARKETING STRATEGY ANALYSIS, DISTRIBUTORS
- 12.1 Sales Channel
- 12.2 Pharmaceutical Amino Acids Distributors
- 12.3 Pharmaceutical Amino Acids Downstream Customers
13 RESEARCH FINDINGS AND CONCLUSION
14 APPENDIX
- 14.1 Methodology/Research Approach
- 14.1.1 Research Programs/Design
- 14.1.2 Market Size Estimation
- 14.1.3 Market Breakdown and Data Triangulation
- 14.2 Data Source
- 14.2.1 Secondary Sources
- 14.2.2 Primary Sources
- 14.3 Disclaimer
- 14.4 Author List