|
|
市場調査レポート
商品コード
1128957
車載用SerDesの世界市場 - 考察・予測(2028年まで)Global SerDes for Automotive Market Insights and Forecast to 2028 |
||||||
|
|
|||||||
|
● お客様のご希望に応じて、既存データの加工や未掲載情報(例:国別セグメント)の追加などの対応が可能です。 詳細はお問い合わせください。 |
|||||||


| 車載用SerDesの世界市場 - 考察・予測(2028年まで) |
|
出版日: 2022年09月27日
発行: QYResearch
ページ情報: 英文 167 Pages
納期: 2~3営業日
|
- 全表示
- 概要
- 図表
- 目次
COVID-19の大流行により、世界の車載用SerDesの市場規模は、2022年に1億6,502万米ドルと推定され、2028年までに2億7,704万米ドルに再調整され、予測期間(2022年~2028年)中のCAGRで9.02%の成長が予測されています。
世界の車載用SerDesの主要メーカーは、Texas Instruments、Maxim Integrated、ON Semiconductor、NXP、STMicroelectronics、Broadcom、ROHM Semiconductor、Infineon、Renesas(Intersil)などです。2021年の収益では、世界の上位企業5社が約67%のシェアを占めています。
目次
第1章 調査範囲
- 車載用SerDes製品の紹介
- 市場:タイプ別
- 世界の車載用SerDesの市場規模:タイプ別(2017年、2021年、2028年)
- 16ビット以下
- 16~32ビット
- 32ビット超
- 市場:用途別
- 世界の車載用SerDesの市場規模:用途別(2017年、2021年、2028年)
- 乗用車
- 商用車
- 調査目的
- 考慮年
第2章 世界の車載用SerDesの生産
- 世界の車載用SerDesの生産:地域別(2017年、2021年、2028年)
- 世界の車載用SerDesの生産:地域別
- 北米
- 欧州
- 中国
- 日本
- 韓国
第3章 世界の車載用SerDesの販売量・販売額の推定と予測
- 世界の車載用SerDesの販売の推定と予測(2017年~2028年)
- 世界の車載用SerDesの収益の推定と予測(2017年~2028年)
- 世界の車載用SerDesの収益:地域別(2017年、2021年、2028年)
- 世界の車載用SerDesの販売:地域別
- 世界の車載用SerDesの主要地域:地域別
- 北米
- 欧州
- アジア太平洋地域
- ラテンアメリカ
- 中東・アフリカ
第4章 競合:メーカー別
- 世界の車載用SerDesの販売:メーカー別
- 世界の車載用SerDesの収益:メーカー別
- 世界の車載用SerDesの販売価格:メーカー別(2017年~2022年)
- 競合情勢の分析
- M&A、拡張計画
第5章 市場規模:タイプ別
- 世界の車載用SerDesの販売:タイプ別
- 世界の車載用SerDesの収益:タイプ別
- 世界の車載用SerDesの価格:タイプ別
第6章 市場規模:用途別
- 世界の車載用SerDesの販売:用途別
- 世界の車載用SerDesの収益:用途別
- 世界の車載用SerDesの価格:用途別
第7章 北米
- 北米の車載用SerDesの市場規模:タイプ別
- 北米の車載用SerDesの市場規模:用途別
- 北米の車載用SerDesの販売:国別
- 米国
- カナダ
第8章 欧州
- 欧州の車載用SerDesの市場規模:タイプ別
- 欧州の車載用SerDesの市場規模:用途別
- 欧州の車載用SerDesの市場規模:国別
- ドイツ
- 英国
- フランス
- ロシア
- スペイン
第9章 アジア太平洋地域
- アジア太平洋地域の車載用SerDesの市場規模:タイプ別
- アジア太平洋地域の車載用SerDesの市場規模:用途別
- アジア太平洋地域の車載用SerDesの市場規模:地域別
- 中国
- 日本
- 韓国
- インド
- 東南アジア
第10章 ラテンアメリカ
- ラテンアメリカの車載用SerDesの市場規模:タイプ別
- ラテンアメリカの車載用SerDesの市場規模:用途別
- ラテンアメリカの車載用SerDesの市場規模:国別
- メキシコ
- ブラジル
- アルゼンチン
第11章 中東・アフリカ
- 中東・アフリカの車載用SerDesの市場規模:タイプ別
- 中東・アフリカの車載用SerDesの市場規模:用途別
- 中東・アフリカの車載用SerDesの市場規模:国別
- トルコ
- イラン
- 南アフリカ
第12章 企業プロファイル
- Texas Instruments
- Maxim Integrated
- NXP
- ON Semiconductor
- ROHM Semiconductor
- Inova Semiconductors
- Broadcom
- STMicroelectronics
- THine Electronics
- Renesas(Intersil)
- Infineon
- Semtech
- Microsemi(Vitesse)
第13章 業界チェーン分析と販売チャネル分析
- 車載用SerDesの業界チェーン分析
- 車載用SerDesの主要原材料
- 車載用SerDesの生産モード・プロセス
- 車載用SerDesの販売・マーケティング
- 車載用SerDesの顧客
第14章 車載用SerDesの市場力学
- 車載用SerDesの業界動向
- 車載用SerDesの市場促進要因
- 車載用SerDesの市場課題
第15章 世界の車載用SerDesの主な調査結果
第16章 付録
LIST OF TABLES
- Table 1. Global SerDes for Automotive Market Size Growth Rate by Type, 2017 VS 2021 VS 2028 (US$ Million)
- Table 2. Major Manufacturers of 16 to 32 Bit
- Table 3. Major Manufacturers of Above 32 Bit
- Table 4. Global SerDes for Automotive Market Size Growth Rate by Application, 2017 VS 2021 VS 2028 (US$ Million)
- Table 5. Global SerDes for Automotive Production by Region: 2017 VS 2021 VS 2028 (M Units)
- Table 6. Global SerDes for Automotive Production by Region (2017-2022) & (M Units)
- Table 7. Global SerDes for Automotive Production Market Share by Region (2017-2022)
- Table 8. Global SerDes for Automotive Production by Region (2023-2028) & (M Units)
- Table 9. Global SerDes for Automotive Production Market Share by Region (2023-2028)
- Table 10. Global SerDes for Automotive Revenue by Region: 2017 VS 2021 VS 2028 (US$ Million)
- Table 11. Global SerDes for Automotive Sales by Region (2017-2022) & (M Units)
- Table 12. Global SerDes for Automotive Sales Market Share by Region (2017-2022)
- Table 13. Global SerDes for Automotive Sales by Region (2023-2028) & (M Units)
- Table 14. Global SerDes for Automotive Sales Market Share by Region (2023-2028)
- Table 15. Global SerDes for Automotive Revenue by Region (2017-2022) & (US$ Million)
- Table 16. Global SerDes for Automotive Revenue Market Share by Region (2017-2022)
- Table 17. Global SerDes for Automotive Revenue by Region (2023-2028) & (US$ Million)
- Table 18. Global SerDes for Automotive Revenue Market Share by Region (2023-2028)
- Table 19. Global SerDes for Automotive Sales by Manufacturers (2017-2022) & (M Units)
- Table 20. Global SerDes for Automotive Sales Share by Manufacturers (2017-2022)
- Table 21. Global SerDes for Automotive Revenue by Manufacturers (2017-2022) & (US$ Million)
- Table 22. Global SerDes for Automotive Revenue Market Share by Manufacturers (2017-2022)
- Table 23. SerDes for Automotive Price by Manufacturers (2017-2022) & (US$/K Units)
- Table 24. Global SerDes for Automotive Manufacturers Market Concentration Ratio (CR5 and HHI)
- Table 25. Global SerDes for Automotive by Company Type (Tier 1, Tier 2, and Tier 3) & (based on the Revenue in SerDes for Automotive as of 2020)
- Table 26. SerDes for Automotive Manufacturing Base Distribution and Headquarters
- Table 27. Manufacturers SerDes for Automotive Product Offered
- Table 28. Mergers & Acquisitions, Expansion Plans
- Table 29. Global SerDes for Automotive Sales by Type (2017-2022) & (M Units)
- Table 30. Global SerDes for Automotive Sales by Type (2023-2028) & (M Units)
- Table 31. Global SerDes for Automotive Sales Share by Type (2017-2022)
- Table 32. Global SerDes for Automotive Sales Share by Type (2023-2028)
- Table 33. Global SerDes for Automotive Revenue by Type (2017-2022) & (US$ Million)
- Table 34. Global SerDes for Automotive Revenue by Type (2023-2028) & (US$ Million)
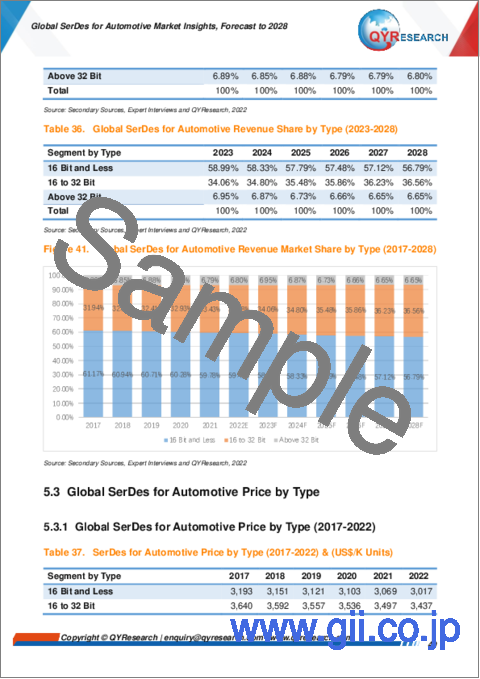
- Table 35. Global SerDes for Automotive Revenue Share by Type (2017-2022)
- Table 36. Global SerDes for Automotive Revenue Share by Type (2023-2028)
- Table 37. SerDes for Automotive Price by Type (2017-2022) & (US$/K Units)
- Table 38. Global SerDes for Automotive Price Forecast by Type (2023-2028) & (US$/K Units)
- Table 39. Global SerDes for Automotive Sales by Application (2017-2022) & (M Units)
- Table 40. Global SerDes for Automotive Sales by Application (2023-2028) & (M Units)
- Table 41. Global SerDes for Automotive Sales Share by Application (2017-2022)
- Table 42. Global SerDes for Automotive Sales Share by Application (2023-2028)
- Table 43. Global SerDes for Automotive Revenue by Application (2017-2022) & (US$ Million)
- Table 44. Global SerDes for Automotive Revenue by Application (2023-2028) & (US$ Million)
- Table 45. Global SerDes for Automotive Revenue Share by Application (2017-2022)
- Table 46. Global SerDes for Automotive Revenue Share by Application (2023-2028)
- Table 47. SerDes for Automotive Price by Application (2017-2022) & (US$/K Units)
- Table 48. Global SerDes for Automotive Price Forecast by Application (2023-2028) & (US$/K Units)
- Table 49. North America SerDes for Automotive Sales by Type (2017-2022) & (M Units)
- Table 50. North America SerDes for Automotive Sales by Application (2017-2022) & (M Units)
- Table 51. North America SerDes for Automotive Sales by Country (2017-2022) & (M Units)
- Table 52. North America SerDes for Automotive Sales by Country (2023-2028) & (M Units)
- Table 53. North America SerDes for Automotive Revenue by Country (2017-2022) & (US$ Million)
- Table 54. North America SerDes for Automotive Revenue by Country (2023-2028) & (US$ Million)
- Table 55. Europe SerDes for Automotive Sales by Type (2017-2022) & (M Units)
- Table 56. Europe SerDes for Automotive Sales by Application (2017-2022) & (M Units)
- Table 57. Europe SerDes for Automotive Sales by Country (2017-2022) & (M Units)
- Table 58. Europe SerDes for Automotive Sales by Country (2023-2028) & (M Units)
- Table 59. Europe SerDes for Automotive Revenue by Country (2017-2022) & (US$ Million)
- Table 60. Europe SerDes for Automotive Revenue by Country (2023-2028) & (US$ Million)
- Table 61. Asia Pacific SerDes for Automotive Sales by Type (2017-2022) & (M Units)
- Table 62. Asia Pacific SerDes for Automotive Sales by Application (2017-2022) & (M Units)
- Table 63. Asia Pacific SerDes for Automotive Sales by Region (2017-2022) & (M Units)
- Table 64. Asia Pacific SerDes for Automotive Sales by Region (2023-2028) & (M Units)
- Table 65. Asia Pacific SerDes for Automotive Revenue by Region (2017-2022) & (US$ Million)
- Table 66. Asia Pacific SerDes for Automotive Revenue by Region (2023-2028) & (US$ Million)
- Table 67. Latin America SerDes for Automotive Sales by Type (2017-2022) & (M Units)
- Table 68. Latin America SerDes for Automotive Sales by Application (2017-2022) & (M Units)
- Table 69. Latin America SerDes for Automotive Sales by Country (2017-2022) & (M Units)
- Table 70. Latin America SerDes for Automotive Sales by Country (2023-2028) & (M Units)
- Table 71. Latin America SerDes for Automotive Revenue by Country (2017-2022) & (US$ Million)
- Table 72. Latin America SerDes for Automotive Revenue by Country (2023-2028) & (US$ Million)
- Table 73. Middle East and Africa SerDes for Automotive Sales by Type (2017-2022) & (M Units)
- Table 74. Middle East and Africa SerDes for Automotive Sales by Application (2017-2022) & (M Units)
- Table 75. Middle East and Africa SerDes for Automotive Sales by Country (2017-2022) & (M Units)
- Table 76. Middle East and Africa SerDes for Automotive Sales by Country (2023-2028) & (M Units)
- Table 77. Middle East and Africa SerDes for Automotive Revenue by Country (2017-2022) & (US$ Million)
- Table 78. Middle East and Africa SerDes for Automotive Revenue by Country (2023-2028) & (US$ Million)
- Table 79. Texas Instruments Corporation Information
- Table 80. Texas Instruments Description and Major Businesses
- Table 81. Texas Instruments SerDes for Automotive Sales (M Units), Revenue (US$ Million), Price (US$/K Units) and Gross Margin (2017-2022)
- Table 82. Texas Instruments SerDes for Automotive Product Model Numbers, Pictures, Descriptions and Specifications
- Table 83. Maxim Integrated Corporation Information
- Table 84. Maxim Integrated Description and Major Businesses
- Table 85. Maxim Integrated SerDes for Automotive Sales (M Units), Revenue (US$ Million), Price (US$/K Units) and Gross Margin (2017-2022)
- Table 86. Maxim Integrated SerDes for Automotive Product Model Numbers, Pictures, Descriptions and Specifications
- Table 87. NXP Corporation Information
- Table 88. NXP Description and Major Businesses
- Table 89. NXP SerDes for Automotive Sales (M Units), Revenue (US$ Million), Price (US$/K Units) and Gross Margin (2017-2022)
- Table 90. NXP SerDes for Automotive Product Model Numbers, Pictures, Descriptions and Specifications
- Table 91. ON Semiconductor Corporation Information
- Table 92. ON Semiconductor Description and Major Businesses
- Table 93. ON Semiconductor SerDes for Automotive Sales (M Units), Revenue (US$ Million), Price (US$/K Units) and Gross Margin (2017-2022)
- Table 94. ON Semiconductor SerDes for Automotive Product Model Numbers, Pictures, Descriptions and Specifications
- Table 95. ROHM Semiconductor Corporation Information
- Table 96. ROHM Semiconductor Description and Major Businesses
- Table 97. ROHM Semiconductor SerDes for Automotive Sales (M Units), Revenue (US$ Million), Price (US$/K Units) and Gross Margin (2017-2022)
- Table 98. ROHM Semiconductor SerDes for Automotive Product Model Numbers, Pictures, Descriptions and Specifications
- Table 99. Inova Semiconductors Corporation Information
- Table 100. Inova Semiconductors Description and Major Businesses
- Table 101. Inova Semiconductors SerDes for Automotive Sales (M Units), Revenue (US$ Million), Price (US$/K Units) and Gross Margin (2017-2022)
- Table 102. Inova Semiconductors SerDes for Automotive Product Model Numbers, Pictures, Descriptions and Specifications
- Table 103. Broadcom Corporation Information
- Table 104. Broadcom Description and Major Businesses
- Table 105. Broadcom SerDes for Automotive Sales (M Units), Revenue (US$ Million), Price (US$/K Units) and Gross Margin (2017-2022)
- Table 106. Broadcom SerDes for Automotive Product Model Numbers, Pictures, Descriptions and Specifications
- Table 107. STMicroelectronics Corporation Information
- Table 108. STMicroelectronics Description and Major Businesses
- Table 109. STMicroelectronics SerDes for Automotive Sales (M Units), Revenue (US$ Million), Price (US$/K Units) and Gross Margin (2017-2022)
- Table 110. STMicroelectronics SerDes for Automotive Product Model Numbers, Pictures, Descriptions and Specifications
- Table 111. THine Electronics Corporation Information
- Table 112. THine Electronics Description and Major Businesses
- Table 113. THine Electronics SerDes for Automotive Sales (M Units), Revenue (US$ Million), Price (US$/K Units) and Gross Margin (2017-2022)
- Table 114. THine Electronics SerDes for Automotive Product Model Numbers, Pictures, Descriptions and Specifications
- Table 115. Renesas (Intersil) Corporation Information
- Table 116. Renesas (Intersil) Description and Major Businesses
- Table 117. Renesas (Intersil) SerDes for Automotive Sales (M Units), Revenue (US$ Million), Price (US$/K Units) and Gross Margin (2017-2022)
- Table 118. Renesas (Intersil) SerDes for Automotive Product Model Numbers, Pictures, Descriptions and Specifications
- Table 119. Infineon Corporation Information
- Table 120. Infineon Description and Major Businesses
- Table 121. Infineon SerDes for Automotive Sales (M Units), Revenue (US$ Million), Price (US$/K Units) and Gross Margin (2017-2022)
- Table 122. Infineon SerDes for Automotive Product Model Numbers, Pictures, Descriptions and Specifications
- Table 123. Semtech Corporation Information
- Table 124. Semtech Description and Major Businesses
- Table 125. Semtech SerDes for Automotive Sales (M Units), Revenue (US$ Million), Price (US$/K Units) and Gross Margin (2017-2022)
- Table 126. Semtech SerDes for Automotive Product Model Numbers, Pictures, Descriptions and Specifications
- Table 127. Microsemi (Vitesse) Corporation Information
- Table 128. Microsemi (Vitesse) Description and Major Businesses
- Table 129. Microsemi (Vitesse) SerDes for Automotive Sales (M Units), Revenue (US$ Million), Price (US$/K Units) and Gross Margin (2017-2022)
- Table 130. Microsemi (Vitesse) SerDes for Automotive Product Model Numbers, Pictures, Descriptions and Specifications
- Table 131. Key Raw Materials Lists
- Table 132. Raw Materials Key Suppliers Lists
- Table 133. SerDes for Automotive Distributors List
- Table 134. SerDes for Automotive Customers List
- Table 135. SerDes for Automotive Market Trends
- Table 136. SerDes for Automotive Market Drivers
- Table 137. SerDes for Automotive Market Challenges
- Table 138. Research Programs/Design for This Report
- Table 139. Key Data Information from Secondary Sources
- Table 140. Key Data Information from Primary Sources
List of Figures
- Figure 1. SerDes for Automotive Product Picture
- Figure 2. Global SerDes for Automotive Market Size Growth Rate by Type, 2017 VS 2021 VS 2028 (US$ Million)
- Figure 3. Global SerDes for Automotive Market Share by Type: 2021
- Figure 4. DS92LV16 16-Bit Bus LVDS Serializer/Deserializer from TI
- Figure 5. Major Manufacturers of 16 Bit and Less
- Figure 6. 27bit LVDS Trabsmitter 27:4 Serializer - BU90T81 from ROHM
- Figure 7. 56bit LVDS Trabsmitter 56:8 Serializer_BU7988KVT from ROHM
- Figure 8. Global SerDes for Automotive Market Size Growth Rate by Application, 2017 VS 2021 VS 2028 (US$ Million)
- Figure 9. Global SerDes for Automotive Market Share by Application in 2021
- Figure 10. Passenger Cars
- Figure 11. Commercial Vehicle
- Figure 12. SerDes for Automotive Report Years Considered
- Figure 13. Global SerDes for Automotive Production by Region: 2017 VS 2021 VS 2028 (M Units)
- Figure 14. Global SerDes for Automotive Production Market Share by Region in Percentage: 2021
- Figure 15. Global SerDes for Automotive Production Market Share by Region (2017-2022)
- Figure 16. Global SerDes for Automotive Production Market Share by Region (2023-2028)
- Figure 17. SerDes for Automotive Production Growth Rate in North America (2017-2028) & (M Units)
- Figure 18. SerDes for Automotive Production Growth Rate in Europe (2017-2028) & (M Units)
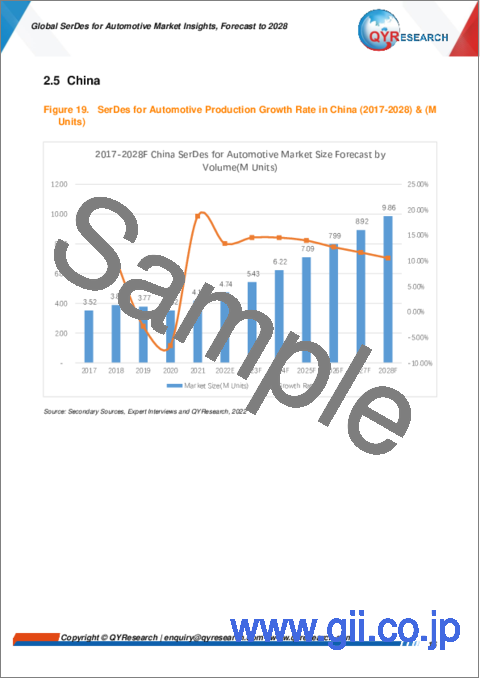
- Figure 19. SerDes for Automotive Production Growth Rate in China (2017-2028) & (M Units)
- Figure 20. SerDes for Automotive Production Growth Rate in Japan (2017-2028) & (M Units)
- Figure 21. SerDes for Automotive Production Growth Rate in South Korea (2017-2028) & (M Units)
- Figure 22. Global SerDes for Automotive Sales 2017-2028 (M Units)
- Figure 23. Global SerDes for Automotive Revenue, (US$ Million), 2017 VS 2021 VS 2028
- Figure 24. Global SerDes for Automotive Revenue 2017-2028 (US$ Million)
- Figure 25. Global SerDes for Automotive Revenue Market Share by Region in Percentage: 2021
- Figure 26. Global SerDes for Automotive Sales Market Share by Region (2017-2022)
- Figure 27. Global SerDes for Automotive Sales Market Share by Region (2023-2028)
- Figure 28. North America SerDes for Automotive Sales YoY (2017-2028) & (M Units)
- Figure 29. North America SerDes for Automotive Revenue YoY (2017-2028) & (US$ Million)
- Figure 30. Europe SerDes for Automotive Sales YoY (2017-2028) & (M Units)
- Figure 31. Europe SerDes for Automotive Revenue YoY (2017-2028) & (US$ Million)
- Figure 32. Asia-Pacific SerDes for Automotive Sales YoY (2017-2028) & (M Units)
- Figure 33. Asia-Pacific SerDes for Automotive Revenue YoY (2017-2028) & (US$ Million)
- Figure 34. Latin America SerDes for Automotive Sales YoY (2017-2028) & (M Units)
- Figure 35. Latin America SerDes for Automotive Revenue YoY (2017-2028) & (US$ Million)
- Figure 36. Middle East & Africa SerDes for Automotive Sales YoY (2017-2028) & (M Units)
- Figure 37. Middle East & Africa SerDes for Automotive Revenue YoY (2017-2028) & (US$ Million)
- Figure 38. The SerDes for Automotive Market Share of Top 3 and Top 5 Largest Manufacturers Around the World in 2021
- Figure 39. The Top 5 and 3 Largest Manufacturers of SerDes for Automotive in the World: Market Share by SerDes for Automotive Revenue in 2021
- Figure 40. Global SerDes for Automotive Sales Market Share by Type (2017-2028)
- Figure 41. Global SerDes for Automotive Revenue Market Share by Type (2017-2028)
- Figure 42. Global SerDes for Automotive Sales Market Share by Application (2017-2028)
- Figure 43. Global SerDes for Automotive Revenue Market Share by Application (2017-2028)
- Figure 44. North America SerDes for Automotive Sales Market Share by Type in 2021
- Figure 45. North America SerDes for Automotive Sales Market Share by Application in 2021
- Figure 46. North America SerDes for Automotive Sales Share by Country (2017-2028)
- Figure 47. North America SerDes for Automotive Revenue Share by Country (2017-2028)
- Figure 48. United States SerDes for Automotive Revenue (2017-2028) & (US$ Million)
- Figure 49. Canada SerDes for Automotive Revenue (2017-2028) & (US$ Million)
- Figure 50. Europe SerDes for Automotive Sales Market Share by Type in 2021
- Figure 51. Europe SerDes for Automotive Sales Market Share by Application in 2021
- Figure 52. Europe SerDes for Automotive Sales Share by Country (2017-2028)
- Figure 53. Europe SerDes for Automotive Revenue Share by Country (2017-2028)
- Figure 54. Germany SerDes for Automotive Revenue (2017-2028) & (US$ Million)
- Figure 55. U.K. SerDes for Automotive Revenue (2017-2028) & (US$ Million)
- Figure 56. France SerDes for Automotive Revenue (2017-2028) & (US$ Million)
- Figure 57. Russia SerDes for Automotive Revenue (2017-2028) & (US$ Million)
- Figure 58. Spain SerDes for Automotive Revenue (2017-2028) & (US$ Million)
- Figure 59. Asia Pacific SerDes for Automotive Sales Market Share by Type in 2021
- Figure 60. Asia Pacific SerDes for Automotive Sales Market Share by Application in 2021
- Figure 61. Asia Pacific SerDes for Automotive Sales Share by Region (2017-2028)
- Figure 62. Asia Pacific SerDes for Automotive Revenue Share by Region (2017-2028)
- Figure 63. China SerDes for Automotive Revenue (2017-2028) & (US$ Million)
- Figure 64. Japan SerDes for Automotive Revenue (2017-2028) & (US$ Million)
- Figure 65. South Korea SerDes for Automotive Revenue (2017-2028) & (US$ Million)
- Figure 66. India SerDes for Automotive Revenue (2017-2028) & (US$ Million)
- Figure 67. Southeast Asia SerDes for Automotive Revenue (2017-2028) & (US$ Million)
- Figure 68. Latin America SerDes for Automotive Sales Market Share by Type in 2021
- Figure 69. Latin America SerDes for Automotive Sales Market Share by Application in 2021
- Figure 70. Latin America SerDes for Automotive Sales Share by Country (2017-2028)
- Figure 71. Latin America SerDes for Automotive Revenue Share by Country (2017-2028)
- Figure 72. Mexico SerDes for Automotive Revenue (2017-2028) & (US$ Million)
- Figure 73. Brazil SerDes for Automotive Revenue (2017-2028) & (US$ Million)
- Figure 74. Argentina SerDes for Automotive Revenue (2017-2028) & (US$ Million)
- Figure 75. Middle East and Africa SerDes for Automotive Sales Market Share by Type in 2021
- Figure 76. Middle East and Africa SerDes for Automotive Sales Market Share by Application in 2021
- Figure 77. Middle East and Africa SerDes for Automotive Sales Share by Country (2017-2028)
- Figure 78. Middle East and Africa SerDes for Automotive Revenue Share by Country (2017-2028)
- Figure 79. Turkey SerDes for Automotive Revenue (2017-2028) & (US$ Million)
- Figure 80. Iran SerDes for Automotive Revenue (2017-2028) & (US$ Million)
- Figure 81. South Africa SerDes for Automotive Revenue (2017-2028) & (US$ Million)
- Figure 82. SerDes for Automotive Value Chain
- Figure 83. SerDes for Automotive Production Process
- Figure 84. Channels of Distribution
- Figure 85. Distributors Profiles
- Figure 86. Bottom-up and Top-down Approaches for This Report
- Figure 87. Data Triangulation
- Figure 88. Key Executives Interviewed 146
Market Analysis and Insights:
Due to the COVID-19 pandemic, the global SerDes for Automotive market size is estimated to be worth US$ 165.02 million in 2022 and is forecast to a readjusted size of US$ 277.04 million by 2028 with a CAGR of 9.02% during the forecast period 2022-2028.
The global key manufacturers of SerDes for Automotive include Texas Instruments, Maxim Integrated, ON Semiconductor, NXP, STMicroelectronics, Broadcom, ROHM Semiconductor, Infineon, and Renesas (Intersil), etc. In 2021, the global top five players hold a share approximately 67% in terms of revenue.
In terms of production side, this report researches the SerDes for Automotive production, growth rate, market share by manufacturers and by region (region level and country level), from 2017 to 2022, and forecast to 2028.
In terms of sales side, this report focuses on the sales of SerDes for Automotive by region (region level and country level), by company, by Type and by Application. from 2017 to 2022 and forecast to 2028.
Scope and Segment:
SerDes for Automotive market is segmented by Type, and by Application. Players, stakeholders, and other participants in the global SerDes for Automotive market will be able to gain the upper hand as they use the report as a powerful resource. The segmental analysis focuses on production capacity, revenue and forecast by Type, and by Application for the period 2017-2028.
By Company
- Texas Instruments
- Maxim Integrated
- NXP
- ON Semiconductor
- ROHM Semiconductor
- Inova Semiconductors
- Broadcom
- STMicroelectronics
- THine Electronics
- Renesas (Intersil)
- Infineon
- Semtech
- Microsemi (Vitesse)
Segment by Type
- 16 Bit and Less
- 16 to 32 Bit
- Above 32 Bit
Segment by Application
- Passenger Cars
- Commercial Vehicle
Production by Region
- North America
- Europe
- China
- Japan
- South Korea
Sales by Region
- North America
- United States
- Canada
- Asia-Pacific
- China
- Japan
- South Korea
- India
- Southeast Asia
- Europe
- Germany
- France
- U.K.
- Spain
- Russia
- Latin America
- Mexico
- Brazil
- Argentina
- Middle East & Africa
- Turkey
- Iran
- South Africa
TABLE OF CONTENTS
1 Study Coverage
- 1.1 SerDes for Automotive Product Introduction
- 1.2 Market by Type
- 1.2.1 Global SerDes for Automotive Market Size by Type, 2017 VS 2021 VS 2028
- 1.2.2 16 Bit and Less
- 1.2.3 16 to 32 Bit
- 1.2.4 Above 32 Bit
- 1.3 Market by Application
- 1.3.1 Global SerDes for Automotive Market Size by Application, 2017 VS 2021 VS 2028
- 1.3.2 Passenger Cars
- 1.3.3 Commercial Vehicle
- 1.4 Study Objectives
- 1.5 Years Considered
2 Global SerDes for Automotive Production
- 2.1 Global SerDes for Automotive Production by Region: 2017 VS 2021 VS 2028
- 2.2 Global SerDes for Automotive Production by Region
- 2.2.1 Global SerDes for Automotive Historic Production by Region (2017-2022)
- 2.2.2 Global SerDes for Automotive Forecasted Production by Region (2023-2028)
- 2.3 North America
- 2.4 Europe
- 2.5 China
- 2.6 Japan
- 2.7 South Korea
3 Global SerDes for Automotive Sales in Volume & Value Estimates and Forecasts
- 3.1 Global SerDes for Automotive Sales Estimates and Forecasts 2017-2028
- 3.2 Global SerDes for Automotive Revenue Estimates and Forecasts 2017-2028
- 3.3 Global SerDes for Automotive Revenue by Region: 2017 VS 2021 VS 2028
- 3.4 Global SerDes for Automotive Sales by Region
- 3.4.1 Global SerDes for Automotive Sales by Region (2017-2022)
- 3.4.2 Global Sales SerDes for Automotive by Region (2023-2028)
- 3.5 Global SerDes for Automotive Revenue by Region
- 3.5.1 Global SerDes for Automotive Revenue by Region (2017-2022)
- 3.5.2 Global SerDes for Automotive Revenue by Region (2023-2028)
- 3.6 North America
- 3.7 Europe
- 3.8 Asia-Pacific
- 3.9 Latin America
- 3.10 Middle East & Africa
4 Competition by Manufacturers
- 4.1 Global SerDes for Automotive Sales by Manufacturers
- 4.1.1 Global SerDes for Automotive Sales by Manufacturers (2017-2022)
- 4.1.2 Global SerDes for Automotive Sales Market Share by Manufacturers (2017-2022)
- 4.1.3 Global Top 3 and Top 5 Largest Manufacturers of SerDes for Automotive in 2021
- 4.2 Global SerDes for Automotive Revenue by Manufacturers
- 4.2.1 Global SerDes for Automotive Revenue by Manufacturers (2017-2022)
- 4.2.2 Global SerDes for Automotive Revenue Market Share by Manufacturers (2017-2022)
- 4.2.3 Global Top 3 and Top 5 Companies by SerDes for Automotive Revenue in 2021
- 4.3 Global SerDes for Automotive Sales Price by Manufacturers (2017-2022)
- 4.4 Analysis of Competitive Landscape
- 4.4.1 Manufacturers Market Concentration Ratio (CR5 and HHI)
- 4.4.2 Global SerDes for Automotive Market Share by Company Type (Tier 1, Tier 2, and Tier 3)
- 4.4.3 Global SerDes for Automotive Manufacturers Geographical Distribution
- 4.5 Mergers & Acquisitions, Expansion Plans
5 Market Size by Type
- 5.1 Global SerDes for Automotive Sales by Type
- 5.1.1 Global SerDes for Automotive Historical Sales by Type (2017-2022)
- 5.1.2 Global SerDes for Automotive Forecasted Sales by Type (2023-2028)
- 5.1.3 Global SerDes for Automotive Sales Market Share by Type (2017-2028)
- 5.2 Global SerDes for Automotive Revenue by Type
- 5.2.1 Global SerDes for Automotive Historical Revenue by Type (2017-2022)
- 5.2.2 Global SerDes for Automotive Forecasted Revenue by Type (2023-2028)
- 5.2.3 Global SerDes for Automotive Revenue Market Share by Type (2017-2028)
- 5.3 Global SerDes for Automotive Price by Type
- 5.3.1 Global SerDes for Automotive Price by Type (2017-2022)
- 5.3.2 Global SerDes for Automotive Price Forecast by Type (2023-2028)
6 Market Size by Application
- 6.1 Global SerDes for Automotive Sales by Application
- 6.1.1 Global SerDes for Automotive Historical Sales by Application (2017-2022)
- 6.1.2 Global SerDes for Automotive Forecasted Sales by Application (2023-2028)
- 6.1.3 Global SerDes for Automotive Sales Market Share by Application (2017-2028)
- 6.2 Global SerDes for Automotive Revenue by Application
- 6.2.1 Global SerDes for Automotive Historical Revenue by Application (2017-2022)
- 6.2.2 Global SerDes for Automotive Forecasted Revenue by Application (2023-2028)
- 6.2.3 Global SerDes for Automotive Revenue Market Share by Application (2017-2028)
- 6.3 Global SerDes for Automotive Price by Application
- 6.3.1 Global SerDes for Automotive Price by Application (2017-2022)
- 6.3.2 Global SerDes for Automotive Price Forecast by Application (2023-2028)
7 North America
- 7.1 North America SerDes for Automotive Market Size by Type
- 7.2 North America SerDes for Automotive Market Size by Application
- 7.3 North America SerDes for Automotive Sales by Country
- 7.3.1 North America SerDes for Automotive Sales by Country (2017-2028)
- 7.3.2 North America SerDes for Automotive Revenue by Country (2017-2028)
- 7.3.3 United States
- 7.3.4 Canada
8 Europe
- 8.1 Europe SerDes for Automotive Market Size by Type
- 8.2 Europe SerDes for Automotive Market Size by Application
- 8.3 Europe SerDes for Automotive Market Size by Country
- 8.3.1 Europe SerDes for Automotive Sales by Country (2017-2028)
- 8.3.2 Europe SerDes for Automotive Revenue by Country (2017-2028)
- 8.3.3 Germany
- 8.3.4 U.K.
- 8.3.5 France
- 8.3.6 Russia
- 8.3.7 Spain
9 Asia Pacific
- 9.1 Asia Pacific SerDes for Automotive Market Size by Type
- 9.2 Asia Pacific SerDes for Automotive Market Size by Application
- 9.3 Asia Pacific SerDes for Automotive Market Size by Region
- 9.3.1 Asia Pacific SerDes for Automotive Sales by Region (2017-2028)
- 9.3.2 Asia Pacific SerDes for Automotive Revenue by Region (2017-2028)
- 9.3.3 China
- 9.3.4 Japan
- 9.3.5 South Korea
- 9.3.6 India
- 9.3.7 Southeast Asia
10 Latin America
- 10.1 Latin America SerDes for Automotive Market Size by Type
- 10.2 Latin America SerDes for Automotive Market Size by Application
- 10.3 Latin America SerDes for Automotive Market Size by Country
- 10.3.1 Latin America SerDes for Automotive Sales by Country (2017-2028)
- 10.3.2 Latin America SerDes for Automotive Revenue by Country (2017-2028)
- 10.3.3 Mexico
- 10.3.4 Brazil
- 10.3.5 Argentina
11 Middle East and Africa
- 11.1 Middle East and Africa SerDes for Automotive Market Size by Type
- 11.2 Middle East and Africa SerDes for Automotive Market Size by Application
- 11.3 Middle East and Africa SerDes for Automotive Market Size by Country
- 11.3.1 Middle East and Africa SerDes for Automotive Sales by Country (2017-2028)
- 11.3.2 Middle East and Africa SerDes for Automotive Revenue by Country (2017-2028)
- 11.3.3 Turkey
- 11.3.4 Iran
- 11.3.5 South Africa
12 Corporate Profile
- 12.1 Texas Instruments
- 12.1.1 Texas Instruments Corporation Information
- 12.1.2 Texas Instruments Overview
- 12.1.3 Texas Instruments SerDes for Automotive Sales, Price, Revenue and Gross Margin (2017-2022)
- 12.1.4 Texas Instruments SerDes for Automotive Product Model Numbers, Pictures, Descriptions and Specifications
- 12.2 Maxim Integrated
- 12.2.1 Maxim Integrated Corporation Information
- 12.2.2 Maxim Integrated Overview
- 12.2.3 Maxim Integrated SerDes for Automotive Sales, Price, Revenue and Gross Margin (2017-2022)
- 12.2.4 Maxim Integrated SerDes for Automotive Product Model Numbers, Pictures, Descriptions and Specifications
- 12.3 NXP
- 12.3.1 NXP Corporation Information
- 12.3.2 NXP Overview
- 12.3.3 NXP SerDes for Automotive Sales, Price, Revenue and Gross Margin (2017-2022)
- 12.3.4 NXP SerDes for Automotive Product Model Numbers, Pictures, Descriptions and Specifications
- 12.4 ON Semiconductor
- 12.4.1 ON Semiconductor Corporation Information
- 12.4.2 ON Semiconductor Overview
- 12.4.3 ON Semiconductor SerDes for Automotive Sales, Price, Revenue and Gross Margin (2017-2022)
- 12.4.4 ON Semiconductor SerDes for Automotive Product Model Numbers, Pictures, Descriptions and Specifications
- 12.5 ROHM Semiconductor
- 12.5.1 ROHM Semiconductor Corporation Information
- 12.5.2 ROHM Semiconductor Overview
- 12.5.3 ROHM Semiconductor SerDes for Automotive Sales, Price, Revenue and Gross Margin (2017-2022)
- 12.5.4 ROHM Semiconductor SerDes for Automotive Product Model Numbers, Pictures, Descriptions and Specifications
- 12.6 Inova Semiconductors
- 12.6.1 Inova Semiconductors Corporation Information
- 12.6.2 Inova Semiconductors Overview
- 12.6.3 Inova Semiconductors SerDes for Automotive Sales, Price, Revenue and Gross Margin (2017-2022)
- 12.6.4 Inova Semiconductors SerDes for Automotive Product Model Numbers, Pictures, Descriptions and Specifications
- 12.7 Broadcom
- 12.7.1 Broadcom Corporation Information
- 12.7.2 Broadcom Overview
- 12.7.3 Broadcom SerDes for Automotive Sales, Price, Revenue and Gross Margin (2017-2022)
- 12.7.4 Broadcom SerDes for Automotive Product Model Numbers, Pictures, Descriptions and Specifications
- 12.8 STMicroelectronics
- 12.8.1 STMicroelectronics Corporation Information
- 12.8.2 STMicroelectronics Overview
- 12.8.3 STMicroelectronics SerDes for Automotive Sales, Price, Revenue and Gross Margin (2017-2022)
- 12.8.4 STMicroelectronics SerDes for Automotive Product Model Numbers, Pictures, Descriptions and Specifications
- 12.9 THine Electronics
- 12.9.1 THine Electronics Corporation Information
- 12.9.2 THine Electronics Overview
- 12.9.3 THine Electronics SerDes for Automotive Sales, Price, Revenue and Gross Margin (2017-2022)
- 12.9.4 THine Electronics SerDes for Automotive Product Model Numbers, Pictures, Descriptions and Specifications
- 12.10 Renesas (Intersil)
- 12.10.1 Renesas (Intersil) Corporation Information
- 12.10.2 Renesas (Intersil) Overview
- 12.10.3 Renesas (Intersil) SerDes for Automotive Sales, Price, Revenue and Gross Margin (2017-2022)
- 12.10.4 Renesas (Intersil) SerDes for Automotive Product Model Numbers, Pictures, Descriptions and Specifications
- 12.11 Infineon
- 12.11.1 Infineon Corporation Information
- 12.11.2 Infineon Overview
- 12.11.3 Infineon SerDes for Automotive Sales, Price, Revenue and Gross Margin (2017-2022)
- 12.11.4 Infineon SerDes for Automotive Product Model Numbers, Pictures, Descriptions and Specifications
- 12.12 Semtech
- 12.12.1 Semtech Corporation Information
- 12.12.2 Semtech Overview
- 12.12.3 Semtech SerDes for Automotive Sales, Price, Revenue and Gross Margin (2017-2022)
- 12.12.4 Semtech SerDes for Automotive Product Model Numbers, Pictures, Descriptions and Specifications
- 12.13 Microsemi (Vitesse)
- 12.13.1 Microsemi (Vitesse) Corporation Information
- 12.13.2 Microsemi (Vitesse) Overview
- 12.13.3 Microsemi (Vitesse) SerDes for Automotive Sales, Price, Revenue and Gross Margin (2017-2022)
- 12.13.4 Microsemi (Vitesse) SerDes for Automotive Product Model Numbers, Pictures, Descriptions and Specifications
13 Industry Chain and Sales Channels Analysis
- 13.1 SerDes for Automotive Industry Chain Analysis
- 13.2 SerDes for Automotive Key Raw Materials
- 13.2.1 Key Raw Materials
- 13.2.2 Raw Materials Key Suppliers
- 13.3 SerDes for Automotive Production Mode & Process
- 13.4 SerDes for Automotive Sales and Marketing
- 13.4.1 Sales Channel
- 13.4.2 SerDes for Automotive Distributors
- 13.5 SerDes for Automotive Customers
14 SerDes for Automotive Market Dynamics
- 14.1.1 SerDes for Automotive Industry Trends
- 14.1.2 SerDes for Automotive Market Drivers
- 14.1.3 SerDes for Automotive Market Challenges
15 Key Findings in the Global SerDes for Automotive Study
16 Appendix
- 16.1 Research Methodology
- 16.1.1 Methodology/Research Approach
- 16.1.2 Data Source
- 16.2 Author Details
- 16.3 Disclaimer