|
|
市場調査レポート
商品コード
1128953
ラバーマウントの世界市場(2022年)Global Rubber Mounts Market Research Report 2022 - Customized Version |
||||||
|
|
|||||||
|
● お客様のご希望に応じて、既存データの加工や未掲載情報(例:国別セグメント)の追加などの対応が可能です。 詳細はお問い合わせください。 |
|||||||


| ラバーマウントの世界市場(2022年) |
|
出版日: 2022年09月27日
発行: QYResearch
ページ情報: 英文 130 Pages
納期: 2~3営業日
|
- 全表示
- 概要
- 図表
- 目次
市場の分析と洞察
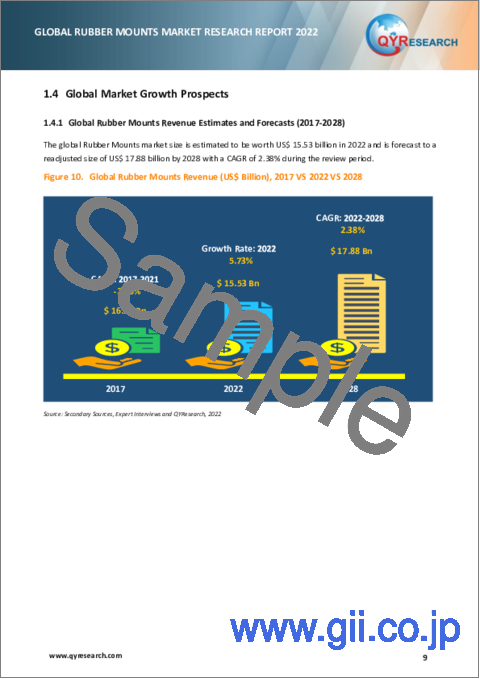
の世界のラバーマウントの市場規模は、2022年には155億3000万米ドルと推定され、2028年には178億8000万米ドルに達する見通しで、レビュー期間中のCAGRは2.38%になると予測されています。
ラバーマウントの世界主要メーカーは、住友理工、Vibracustic、Contitech、Boge、TUOPUなどです。収益面では、2021年のラバーマウントの市場シェアは世界3大企業が32.92%を占めています。
促進要因と抑制要因
調査レポートでは、市場の成長を増大させる様々な要因の分析を組み込んでいます。それは、市場を肯定的または否定的に変化させる動向と促進要因を構成しています。このセクションでは、将来の市場に影響を与える可能性のある様々なセグメントと用途の展望も提供しています。詳細な情報は、現在の動向と歴史的なマイルストーンに基づいています。このセクションでは、2017年から2028年までの世界市場に関する生産と各タイプに関する分析も行っています。2017年から2028年までの地域別:生産について言及しています。2017年から2028年までの各タイプ、2017年から2022年までのメーカー、2017年から2022年までの地域、2017年から2028年までの世界価格による価格分析が記載されています。
レポートに含まれる抑制の徹底的な評価は、促進要因との対比を描き、戦略的な計画のための余地を与えます。彼らは成長し続ける市場に存在する有利な機会のホールドを取得するための異なる曲げを考案するために理解することができるように、市場の成長を覆い隠す要因は極めて重要です。さらに、市場の専門家の意見への洞察は、より良い市場を理解するために取られています。
セグメント分析
調査レポートには、地域別(国別)、メーカー別、タイプ別、用途別:具体的なセグメントが含まれています。各タイプは、2017年から2028年の予測期間中の生産に関する情報を提供します。また、各用途セグメントでは、2017年から2028年までの予測期間中の消費を提供しています。セグメントを理解することは、市場の成長を助けるさまざまな要因の重要性を特定するのに役立ちます。
目次
第1章 ラバーマウントの市場概要
- ラバーマウントの製品概要と範囲
- タイプ別セグメント
- 世界の市場規模成長率分析(2022 VS 2028)
- シリンダー
- ブッシング
- コニカル
- 用途別:セグメント
- 世界の市場規模成長率分析(2022 VS 2028)
- 一般産業
- 海洋産業
- 輸送車両
- 世界市場の成長見通し
- 地域別:世界の市場規模
第2章 メーカー別:市場競争
- メーカー別:世界の生産(2017-2022)
- メーカー別:世界の収益市場シェア(2017-2022)
- 企業タイプ別:市場シェア(ティア 1、ティア 2、およびティア 3)
- メーカー別:世界の平均価格(2017-2022)
- メーカー本社
- 市場の競争状況と動向
第3章 地域別:生産
- 地域別:世界の生産(2017-2022)
- 地域別:世界の収益市場シェア(2017-2022)
- 地域別:世界の生産、収益、価格(2017-2022)
- 北米
- 欧州
- 中国
- 日本
第4章 地域別:ラバーマウントの消費
- 地域別:世界のゴム消費
- 北米
- 国別:消費
- 米国
- カナダ
- メキシコ
- 欧州
- 国別:消費
- ドイツ
- フランス
- 英国
- スペイン
- ロシア
- アジア太平洋地域
- 地域別:消費
- 中国
- 日本
- 韓国
- 東南アジア
- インド
- 南米
- 国別:消費
- アルゼンチン
- ブラジル
第5章 タイプ別:セグメント
- タイプ別:世界の生産市場シェア(2017-2022)
- タイプ別:世界の収益市場シェア(2017-2022)
- タイプ別:世界の価格(2017-2022)
第6章 用途別:セグメント
- 用途別:世界の消費市場シェア(2017-2022)
- 用途別:世界の消費成長率(2018-2022)
第7章 主要企業のプロファイル
- SUMITOMO RIKO
- 企業情報
- 製品ポートフォリオ
- 生産、収益、価格、粗利(2017-2022)
- 連絡先
- VIBRACUSTIC
- 企業情報
- 製品ポートフォリオ
- 生産、収益、価格、粗利(2017-2022)
- 連絡先
- CONTITECH
- 企業情報
- 製品ポートフォリオ
- 生産、収益、価格、粗利(2017-2022)
- 連絡先
- BOGE
- 企業情報
- 製品ポートフォリオ
- 生産、収益、価格、粗利(2017-2022)
- 連絡先
- TUOPU
- 企業情報
- 製品ポートフォリオ
- 生産、収益、価格、粗利(2017-2022)
- 連絡先
- BRIDGSTONE
- 企業情報
- 製品ポートフォリオ
- 生産、収益、価格、粗利(2017-2022)
- 連絡先
- HENNIGES AUTOMOTIVE
- 企業情報
- 製品ポートフォリオ
- 生産、収益、価格、粗利(2017-2022)
- 連絡先
- HUTCHINSON
- 企業情報
- 製品ポートフォリオ
- 生産、収益、価格、粗利(2017-2022)
- 連絡先
- TOYO TIRE & RUBBER CO.
- 企業情報
- 製品ポートフォリオ
- 生産、収益、価格、粗利(2017-2022)
- 連絡先
- ZHONGDING
- 企業情報
- 製品ポートフォリオ
- 生産、収益、価格、粗利(2017-2022)
- 連絡先
- YAMASHITA RUBBER
- 企業情報
- 製品ポートフォリオ
- 生産、収益、価格、粗利(2017-2022)
- 連絡先
- ASIMCO
- 企業情報
- 製品ポートフォリオ
- 生産、収益、価格、粗利(2017-2022)
- 連絡先
- JX ZHAO'S GROUP
- 企業情報
- 製品ポートフォリオ
- 生産、収益、価格、粗利(2017-2022)
- 連絡先
- DTR VSM
- 企業情報
- 製品ポートフォリオ
- 生産、収益、価格、粗利(2017-2022)
- 連絡先
- LUOSHI
- 企業情報
- 製品ポートフォリオ
- 生産、収益、価格、粗利(2017-2022)
- 連絡先
- GMT RUBBER
- 企業情報
- 製品ポートフォリオ
- 生産、収益、価格、粗利(2017-2022)
- 連絡先
第8章 ラバーマウントの製造コスト分析
- 主要原材料分析
- 製造コスト構造比
- 産業チェーン分析
第9章 マーケティングチャネル、ディストリビューター、および顧客
- マーケティングチャネル
- ディストリビューターリスト
- 顧客
第10章 ラバーマウントの市場力学
- 業界の動向
- 市場の促進要因
- 市場の課題
- 市場のリスク
第11章 生産と供給予測
- 地域別:世界の予測生産(2023-2028)
- 北米の生産予測(2023-2028)
- 欧州の生産、収益予測(2023-2028)
- 中国生産、収益予測(2023-2028)
- 日本の生産、収益予測(2023-2028)
第12章 消費と需要予測
- 世界の需要分析予測
- 国別:北米の消費予測
- 国別:欧州の消費予測
- 地域別:アジア太平洋の消費予測
- 国別:南米の消費予測
第13章 タイプ別および用途別:予測
- タイプ別:世界の生産、収益、価格予測(2023-2028)
- 用途別:世界の消費予測(2022-2027)
第14章 調査結果と結論
第15章 調査手法と情報源
LIST OF TABLES
- Table 1. Global Rubber Mounts Market Size by Type (M Units) & (US$ Million) & (2022 VS 2028)
- Table 2. Global Rubber Mounts Market Size by Application (M Units) & (2022 VS 2028)
- Table 3. Rubber Mounts Market Size Comparison (US$ Million) by Region: 2017 VS 2022 VS 2028
- Table 4. Global Rubber Mounts Production by Manufacturers (2017-2022) & (M Units)
- Table 5. Global Rubber Mounts Production Market Share by Manufacturers (2017-2022)
- Table 6. Global Rubber Mounts Revenue by Manufacturers (2017-2022) & (US$ Million)
- Table 7. Global Rubber Mounts Revenue Share by Manufacturers (2017-2022)
- Table 8. Company Type (Tier 1, Tier 2, and Tier 3) & (based on the Revenue in Rubber Mounts as of 2021)
- Table 9. Global Market Rubber Mounts Average Price (USD/Unit) of Key Manufacturers (2017-2022)
- Table 10. Manufacturers Rubber Mounts Headquarters
- Table 11. Global Rubber Mounts Manufacturers Market Concentration Ratio (CR5 and HHI)
- Table 12. Global Rubber Mounts Production (M Units) by Region (2017-2022)
- Table 13. Global Rubber Mounts Revenue (US$ Million) by Region (2017-2022)
- Table 14. Global Rubber Mounts Revenue Market Share by Region (2017-2022)
- Table 15. Global Rubber Mounts Production (M Units), Revenue (US$ Million) and Price (USD/Unit) (2017-2022)
- Table 16. North America Rubber Mounts Production (M Units), Revenue (US$ Million) and Price (USD/Unit) (2017-2022)
- Table 17. Europe Rubber Mounts Production (M Units), Revenue (US$ Million) and Price (USD/Unit) (2017-2022)
- Table 18. China Rubber Mounts Production (M Units), Revenue (US$ Million) and Price (USD/Unit) (2017-2022)
- Table 19. Japan Rubber Mounts Production (M Units), Revenue (US$ Million) and Price (USD/Unit) (2017-2022)
- Table 20. Global Rubber Mounts Consumption by Region (2017-2022) & (M Units)
- Table 21. Global Rubber Mounts Consumption Market Share by Region (2017-2022)
- Table 22. North America Rubber Mounts Consumption by Country (2017-2022) & (M Units)
- Table 23. Europe Rubber Mounts Consumption by Country (2017-2022) & (M Units)
- Table 24. Asia Pacific Rubber Mounts Consumption by Region (2017-2022) & (M Units)
- Table 25. South America Rubber Mounts Consumption by Country (2017-2022) & (M Units)
- Table 26. Global Rubber Mounts Production (M Units) by Type (2017-2022)
- Table 27. Global Rubber Mounts Production Market Share by Type (2017-2022)
- Table 28. Global Rubber Mounts Revenue (US$ Million) by Type (2017-2022)
- Table 29. Global Rubber Mounts Revenue Share by Type (2017-2022)
- Table 30. Global Rubber Mounts Price (USD/Unit) by Type (2017-2022)
- Table 31. Global Rubber Mounts Consumption by Application (2017-2022) & (M Units)
- Table 32. Global Rubber Mounts Consumption Market Share by Application (2017-2022)
- Table 33. Global Rubber Mounts Consumption Growth Rate by Application (2018-2022)
- Table 34. Sumitomo Riko Rubber Mounts Corporation Information
- Table 35. Sumitomo Riko Rubber Mounts Specification and Application
- Table 36. Sumitomo Riko Rubber Mounts Production (M Units), Revenue (US$ Million), Price (USD/Unit) and Gross Margin (2017-2022)
- Table 37. Vibracustic Rubber Mounts Corporation Information
- Table 38. Vibracustic Rubber Mounts Specification and Application
- Table 39. Vibracustic Rubber Mounts Production (M Units), Revenue (US$ Million), Price (USD/Unit) and Gross Margin (2017-2022)
- Table 40. Contitech Rubber Mounts Corporation Information
- Table 41. Contitech Rubber Mounts Specification and Application
- Table 42. Contitech Rubber Mounts Production (M Units), Revenue (US$ Million), Price (USD/Unit) and Gross Margin (2017-2022)
- Table 43. Boge Rubber Mounts Corporation Information
- Table 44. Boge Rubber Mounts Specification and Application
- Table 45. Boge Rubber Mounts Production (M Units), Revenue (US$ Million), Price (USD/Unit) and Gross Margin (2017-2022)
- Table 46. TUOPU Rubber Mounts Corporation Information
- Table 47. TUOPU Rubber Mounts Specification and Application
- Table 48. TUOPU Rubber Mounts Production (M Units), Revenue (US$ Million), Price (USD/Unit) and Gross Margin (2017-2022)
- Table 49. Bridgstone Rubber Mounts Corporation Information
- Table 50. Bridgstone Rubber Mounts Specification and Application
- Table 51. Bridgstone Rubber Mounts Production (M Units), Revenue (US$ Million), Price (USD/Unit) and Gross Margin (2017-2022)
- Table 52. Henniges Automotive Rubber Mounts Corporation Information
- Table 53. Henniges Automotive Rubber Mounts Specification and Application
- Table 54. Henniges Automotive Rubber Mounts Production (M Units), Revenue (US$ Million), Price (USD/Unit) and Gross Margin (2017-2022)
- Table 55. Hutchinson Rubber Mounts Corporation Information
- Table 56. Hutchinson Rubber Mounts Specification and Application
- Table 57. Hutchinson Rubber Mounts Production (M Units), Revenue (US$ Million), Price (USD/Unit) and Gross Margin (2017-2022)
- Table 58. TOYO TIRE & RUBBER CO. Rubber Mounts Corporation Information
- Table 59. TOYO TIRE & RUBBER CO. Rubber Mounts Specification and Application
- Table 60. TOYO TIRE & RUBBER CO. Rubber Mounts Production (M Units), Revenue (US$ Million), Price (USD/Unit) and Gross Margin (2017-2022)
- Table 61. Zhongding Rubber Mounts Corporation Information
- Table 62. Zhongding Rubber Mounts Specification and Application
- Table 63. Zhongding Rubber Mounts Production (M Units), Revenue (US$ Million), Price (USD/Unit) and Gross Margin (2017-2022)
- Table 64. Yamashita Rubber Rubber Mounts Corporation Information
- Table 65. Yamashita Rubber Rubber Mounts Specification and Application
- Table 66. Yamashita Rubber Rubber Mounts Production (M Units), Revenue (US$ Million), Price (USD/Unit) and Gross Margin (2017-2022)
- Table 67. Asimco Rubber Mounts Corporation Information
- Table 68. Asimco Rubber Mounts Specification and Application
- Table 69. Asimco Rubber Mounts Production (M Units), Revenue (US$ Million), Price (USD/Unit) and Gross Margin (2017-2022)
- Table 70. JX Zhao's Group Rubber Mounts Corporation Information
- Table 71. JX Zhao's Group Rubber Mounts Specification and Application
- Table 72. JX Zhao's Group Rubber Mounts Production (M Units), Revenue (US$ Million), Price (USD/Unit) and Gross Margin (2017-2022)
- Table 73. DTR VSM Rubber Mounts Corporation Information
- Table 74. DTR VSM Rubber Mounts Specification and Application
- Table 75. DTR VSM Rubber Mounts Production (M Units), Revenue (US$ Million), Price (USD/Unit) and Gross Margin (2017-2022)
- Table 76. Luoshi Rubber Mounts Corporation Information
- Table 77. Luoshi Rubber Mounts Specification and Application
- Table 78. Luoshi Rubber Mounts Production (M Units), Revenue (US$ Million), Price (USD/Unit) and Gross Margin (2017-2022)
- Table 79. GMT Rubber Rubber Mounts Corporation Information
- Table 80. GMT Rubber Rubber Mounts Specification and Application
- Table 81. GMT Rubber Rubber Mounts Production (M Units), Revenue (US$ Million), Price (USD/Unit) and Gross Margin (2017-2022)
- Table 82. Key Suppliers of Raw Materials
- Table 83. Rubber Mounts Distributors List
- Table 84. Rubber Mounts Customers List
- Table 85. Rubber Mounts Market Trends
- Table 86. Rubber Mounts Market Drivers
- Table 87. Rubber Mounts Market Challenges
- Table 88. Rubber Mounts Market Risks
- Table 89. Global Rubber Mounts Production (M Units) Forecast by Region (2023-2028)
- Table 90. North America Rubber Mounts Consumption Forecast by Country (2023-2028) & (M Units)
- Table 91. Europe Rubber Mounts Consumption Forecast by Country (2023-2028) & (M Units)
- Table 92. Asia Pacific Rubber Mounts Consumption Forecast by Region (2023-2028) & (M Units)
- Table 93. South America Rubber Mounts Consumption Forecast by Country (2023-2028) & (M Units)
- Table 94. Global Rubber Mounts Production Forecast by Type (2023-2028) & (M Units)
- Table 95. Global Rubber Mounts Revenue Forecast by Type (2023-2028) & (US$ Million)
- Table 96. Global Rubber Mounts Price Forecast by Type (2023-2028) & (USD/Unit)
- Table 97. Global Rubber Mounts Consumption Forecast by Application (2023-2028) & (M Units)
- Table 98. Research Programs/Design for This Report
- Table 99. Key Data Information from Secondary Sources
- Table 100. Key Data Information from Primary Sources
List of Figures
- Figure 1. Product Picture of Rubber Mounts
- Figure 2. Global Rubber Mounts Market Share by Type: 2022
- Figure 3. Cylindrical Mounts Product Picture
- Figure 4. Bushing Mounts Product Picture
- Figure 5. Conical Mounts Product Picture
- Figure 6. Global Rubber Mounts Market Share by Application: 2022
- Figure 7. General Industry
- Figure 8. Marine Industry
- Figure 9. Transportation Vehicles
- Figure 10. Global Rubber Mounts Revenue (US$ Billion), 2017 VS 2022 VS 2028
- Figure 11. Global Rubber Mounts Revenue (US$ Million) (2017-2028)
- Figure 12. Global Rubber Mounts Production (M Units) & (2017-2028)
- Figure 13. North America Rubber Mounts Revenue (US$ Million) Growth Rate (2017-2028)
- Figure 14. Europe Rubber Mounts Revenue (US$ Million) Growth Rate (2017-2028)
- Figure 15. China Rubber Mounts Revenue (US$ Million) Growth Rate (2017-2028)
- Figure 16. Japan Rubber Mounts Revenue (US$ Million) Growth Rate (2017-2028)
- Figure 17. Rubber Mounts Production Share by Manufacturers in 2021
- Figure 18. Global Rubber Mounts Revenue Share by Manufacturers in 2021
- Figure 19. Global Market Rubber Mounts Average Price (USD/Unit) of Key Manufacturers in 2021
- Figure 20. The Global 5 Largest Players: Market Share by Rubber Mounts Revenue in 2021
- Figure 21. Global Rubber Mounts Production Market Share by Region (2017-2022)
- Figure 22. North America Rubber Mounts Production (M Units) Growth Rate (2017-2022)
- Figure 23. Europe Rubber Mounts Production (M Units) Growth Rate (2017-2022)
- Figure 24. China Rubber Mounts Production (M Units) Growth Rate (2017-2022)
- Figure 25. Japan Rubber Mounts Production (M Units) Growth Rate (2017-2022)
- Figure 26. North America Rubber Mounts Consumption and Growth Rate (2017-2022) & (M Units)
- Figure 27. U.S. Rubber Mounts Consumption and Growth Rate (2017-2022) & (M Units)
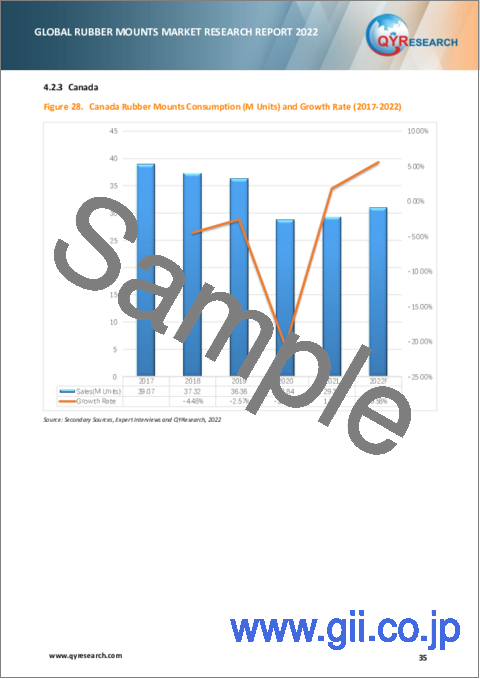
- Figure 28. Canada Rubber Mounts Consumption (M Units) and Growth Rate (2017-2022)
- Figure 29. Mexico Rubber Mounts Consumption and Growth Rate (2017-2022) & (M Units)
- Figure 30. Europe Rubber Mounts Consumption and Growth Rate (2017-2022) & (M Units)
- Figure 31. Germany Rubber Mounts Consumption and Growth Rate (2017-2022) & (M Units)
- Figure 32. France Rubber Mounts Consumption and Growth Rate (2017-2022) & (M Units)
- Figure 33. U.K. Rubber Mounts Consumption and Growth Rate (2017-2022) & (M Units)
- Figure 34. Spain Rubber Mounts Consumption and Growth Rate (2017-2022) & (M Units)
- Figure 35. Russia Rubber Mounts Consumption and Growth Rate (2017-2022) & (M Units)
- Figure 36. Asia Pacific Rubber Mounts Consumption and Growth Rate (M Units)
- Figure 37. China Rubber Mounts Consumption and Growth Rate (2017-2022) & (M Units)
- Figure 38. Japan Rubber Mounts Consumption and Growth Rate (2017-2022) & (M Units)
- Figure 39. South Korea Rubber Mounts Consumption and Growth Rate (2017-2022) & (M Units)
- Figure 40. Southeast Asia Rubber Mounts Consumption and Growth Rate (2017-2022) & (M Units)
- Figure 41. India Rubber Mounts Consumption and Growth Rate (2017-2022) & (M Units)
- Figure 42. South America Rubber Mounts Consumption and Growth Rate (M Units)
- Figure 43. Argentina Rubber Mounts Consumption and Growth Rate (2017-2022) & (M Units)
- Figure 44. Brazil Rubber Mounts Consumption and Growth Rate (2017-2022) & (M Units)
- Figure 45. Production Market Share of Rubber Mounts by Type in 2021
- Figure 46. Revenue Market Share of Rubber Mounts by Type in 2021
- Figure 47. Global Rubber Mounts Consumption Market Share by Application in 2021
- Figure 48. Global Rubber Mounts Consumption Growth Rate by Application (2018-2022)
- Figure 49. Manufacturing Cost Structure of Rubber Mounts
- Figure 50. Rubber Mounts Industrial Chain Analysis
- Figure 51. Channels of Distribution
- Figure 52. Distributors Profiles
- Figure 53. North America Rubber Mounts Production (M Units) Growth Rate Forecast (2023-2028)
- Figure 54. Europe Rubber Mounts Production (M Units) Growth Rate Forecast (2023-2028)
- Figure 55. China Rubber Mounts Production (M Units) Growth Rate Forecast (2023-2028)
- Figure 56. Japan Rubber Mounts Production (M Units) Growth Rate Forecast (2023-2028)
- Figure 57. Global Forecasted Demand Analysis of Rubber Mounts (2023-2028) & (M Units)
- Figure 58. Bottom-up and Top-down Approaches for This Report
- Figure 59. Data Triangulation 109
Market Analysis and Insights:
The global Rubber Mounts market size is estimated to be worth US$ 15.53 billion in 2022 and is forecast to a readjusted size of US$ 17.88 billion by 2028 with a CAGR of 2.38% during the review period.
The global major manufacturers of Rubber Mounts include Sumitomo Riko, Vibracustic, Contitech, Boge, TUOPU, etc. In terms of revenue, the global 3 largest players have a 32.92% market share of Rubber Mounts in 2021.
Drivers and Restrains:
The research report has incorporated the analysis of different factors that augment the market's growth. It constitutes trends, restraints, and drivers that transform the market in either a positive or negative manner. This section also provides the scope of different segments and applications that can potentially influence the market in the future. The detailed information is based on current trends and historic milestones. This section also provides an analysis of the volume of production about the global market and about each type from 2017 to 2028. This section mentions the volume of production by region from 2017 to 2028. Pricing analysis is included in the report according to each type from the year 2017 to 2028, manufacturer from 2017 to 2022, region from 2017 to 2022, and global price from 2017 to 2028.
A thorough evaluation of the restrains included in the report portrays the contrast to drivers and gives room for strategic planning. Factors that overshadow the market growth are pivotal as they can be understood to devise different bends for getting hold of the lucrative opportunities that are present in the ever-growing market. Additionally, insights into market expert's opinions have been taken to understand the market better.
Segment Analysis:
The research report includes specific segments by region (country), by manufacturers, by Type and by Application. Each type provides information about the production during the forecast period of 2017 to 2028. Each application segment also provides consumption during the forecast period of 2017 to 2028. Understanding the segments helps in identifying the importance of different factors that aid the market growth.
By Company
- Sumitomo Riko
- Vibracustic
- Contitech
- Boge
- TUOPU
- Bridgstone
- Henniges Automotive
- Hutchinson
- TOYO TIRE & RUBBER CO.
- Zhongding
- Yamashita Rubber
- Asimco
- JX Zhao's Group
- DTR VSM
- Luoshi
- GMT Rubber
Segment by Type
- Cylindrical Mounts
- Bushing Mounts
- Conical Mounts
Segment by Application
- General Industry
- Marine Industry
- Transportation Vehicles
- Others
Production by Region
- North America
- Europe
- China
- Japan
Consumption by Region
- North America
- U.S.
- Canada
- Mexico
- Asia-Pacific
- China
- Japan
- South Korea
- Southeast Asia
- India
- Rest of Asia-Pacific
- Europe
- Germany
- France
- U.K.
- Spain
- Russia
- Rest of Europe
- South America
- Argentina
- Brazil
- Rest of South America
TABLE OF CONTENTS
1 RUBBER MOUNTS MARKET OVERVIEW
- 1.1 PRODUCT OVERVIEW AND SCOPE OF RUBBER MOUNTS
- 1.2 RUBBER MOUNTS SEGMENT BY TYPE
- 1.2.1 GLOBAL RUBBER MOUNTS MARKET SIZE GROWTH RATE ANALYSIS BY TYPE: 2022 VS 2028
- 1.2.2 CYLINDRICAL MOUNTS
- 1.2.3 BUSHING MOUNTS
- 1.2.4 CONICAL MOUNTS
- 1.3 RUBBER MOUNTS SEGMENT BY APPLICATION
- 1.3.1 GLOBAL RUBBER MOUNTS MARKET SIZE GROWTH RATE ANALYSIS BY APPLICATION: 2022 VS 2028
- 1.3.2 GENERAL INDUSTRY
- 1.3.3 MARINE INDUSTRY
- 1.3.4 TRANSPORTATION VEHICLES
- 1.4 GLOBAL MARKET GROWTH PROSPECTS
- 1.4.1 GLOBAL RUBBER MOUNTS REVENUE ESTIMATES AND FORECASTS (2017-2028)
- 1.4.2 GLOBAL RUBBER MOUNTS PRODUCTION ESTIMATES AND FORECASTS (2017-2028)
- 1.5 GLOBAL MARKET SIZE BY REGION
- 1.5.1 GLOBAL RUBBER MOUNTS MARKET SIZE ESTIMATES AND FORECASTS BY REGION: 2017 VS 2022 VS 2028
- 1.5.2 NORTH AMERICA RUBBER MOUNTS ESTIMATES AND FORECASTS (2017-2028)
- 1.5.3 EUROPE RUBBER MOUNTS ESTIMATES AND FORECASTS (2017-2028)
- 1.5.4 CHINA RUBBER MOUNTS ESTIMATES AND FORECASTS (2017-2028)
- 1.5.5 JAPAN RUBBER MOUNTS ESTIMATES AND FORECASTS (2017-2028)
2 MARKET COMPETITION BY MANUFACTURERS
- 2.1 GLOBAL RUBBER MOUNTS PRODUCTION BY MANUFACTURERS (2017-2022)
- 2.2 GLOBAL RUBBER MOUNTS REVENUE MARKET SHARE BY MANUFACTURERS (2017-2022)
- 2.3 RUBBER MOUNTS MARKET SHARE BY COMPANY TYPE (TIER 1, TIER 2, AND TIER 3)
- 2.4 GLOBAL RUBBER MOUNTS AVERAGE PRICE BY MANUFACTURERS (2017-2022)
- 2.5 MANUFACTURERS RUBBER MOUNTS HEADQUARTERS
- 2.6 RUBBER MOUNTS MARKET COMPETITIVE SITUATION AND TRENDS
- 2.6.1 RUBBER MOUNTS MARKET CONCENTRATION RATE
- 2.6.2 GLOBAL 5 LARGEST RUBBER MOUNTS PLAYERS MARKET SHARE BY REVENUE
3 PRODUCTION BY REGION
- 3.1 GLOBAL PRODUCTION OF RUBBER MOUNTS BY REGION (2017-2022)
- 3.2 GLOBAL RUBBER MOUNTS REVENUE MARKET SHARE BY REGION (2017-2022)
- 3.3 GLOBAL RUBBER MOUNTS PRODUCTION, REVENUE AND PRICE (2017-2022)
- 3.4 NORTH AMERICA RUBBER MOUNTS PRODUCTION
- 3.4.1 NORTH AMERICA RUBBER MOUNTS PRODUCTION GROWTH RATE (2017-2022)
- 3.4.2 NORTH AMERICA RUBBER MOUNTS PRODUCTION, REVENUE AND PRICE (2017-2022)
- 3.5 EUROPE RUBBER MOUNTS PRODUCTION
- 3.5.1 EUROPE RUBBER MOUNTS PRODUCTION GROWTH RATE (2017-2022)
- 3.5.2 EUROPE RUBBER MOUNTS PRODUCTION, REVENUE AND PRICE (2017-2022)
- 3.6 CHINA RUBBER MOUNTS PRODUCTION (2017-2022)
- 3.6.1 CHINA RUBBER MOUNTS PRODUCTION GROWTH RATE (2017-2022)
- 3.6.2 CHINA RUBBER MOUNTS PRODUCTION, REVENUE AND PRICE (2017-2022)
- 3.7 JAPAN RUBBER MOUNTS PRODUCTION (2017-2022)
- 3.7.1 JAPAN RUBBER MOUNTS PRODUCTION GROWTH RATE (2017-2022)
- 3.7.2 JAPAN RUBBER MOUNTS PRODUCTION, REVENUE AND PRICE (2017-2022)
4 RUBBER MOUNTS CONSUMPTION BY REGION
- 4.1 GLOBAL RUBBER MOUNTS CONSUMPTION BY REGION
- 4.1.1 GLOBAL RUBBER MOUNTS CONSUMPTION BY REGION
- 4.1.2 GLOBAL RUBBER MOUNTS CONSUMPTION MARKET SHARE BY REGION
- 4.2 NORTH AMERICA
- 4.2.1 NORTH AMERICA RUBBER MOUNTS CONSUMPTION BY COUNTRY
- 4.2.2 U.S.
- 4.2.3 CANADA
- 4.2.4 MEXICO
- 4.3 EUROPE
- 4.3.1 EUROPE RUBBER MOUNTS CONSUMPTION BY COUNTRY
- 4.3.2 GERMANY
- 4.3.3 FRANCE
- 4.3.4 U.K.
- 4.3.5 SPAIN
- 4.3.6 RUSSIA
- 4.4 ASIA PACIFIC
- 4.4.1 ASIA PACIFIC RUBBER MOUNTS CONSUMPTION BY REGION
- 4.4.2 CHINA
- 4.4.3 JAPAN
- 4.4.4 SOUTH KOREA
- 4.4.5 SOUTHEAST ASIA
- 4.4.6 INDIA
- 4.5 SOUTH AMERICA
- 4.5.1 SOUTH AMERICA RUBBER MOUNTS CONSUMPTION BY COUNTRY
- 4.5.2 ARGENTINA
- 4.5.3 BRAZIL
5 SEGMENT BY TYPE
- 5.1 GLOBAL RUBBER MOUNTS PRODUCTION MARKET SHARE BY TYPE (2017-2022)
- 5.2 GLOBAL RUBBER MOUNTS REVENUE MARKET SHARE BY TYPE (2017-2022)
- 5.3 GLOBAL RUBBER MOUNTS PRICE BY TYPE (2017-2022)
6 SEGMENT BY APPLICATION
- 6.1 GLOBAL RUBBER MOUNTS CONSUMPTION MARKET SHARE BY APPLICATION (2017-2022)
- 6.2 GLOBAL RUBBER MOUNTS CONSUMPTION GROWTH RATE BY APPLICATION (2018-2022)
7 KEY COMPANIES PROFILED
- 7.1 SUMITOMO RIKO
- 7.1.1 SUMITOMO RIKO RUBBER MOUNTS CORPORATION INFORMATION
- 7.1.2 SUMITOMO RIKO RUBBER MOUNTS PRODUCT PORTFOLIO
- 7.1.3 SUMITOMO RIKO RUBBER MOUNTS PRODUCTION, REVENUE, PRICE AND GROSS MARGIN (2017-2022)
- 7.1.4 SUMITOMO RIKO CONTACT INFORMATION
- 7.2 VIBRACUSTIC
- 7.2.1 VIBRACUSTIC RUBBER MOUNTS CORPORATION INFORMATION
- 7.2.2 VIBRACUSTIC RUBBER MOUNTS PRODUCT PORTFOLIO
- 7.2.3 VIBRACUSTIC RUBBER MOUNTS PRODUCTION, REVENUE, PRICE AND GROSS MARGIN (2017-2022)
- 7.2.4 VIBRACUSTIC CONTACT INFORMATION
- 7.3 CONTITECH
- 7.3.1 CONTITECH RUBBER MOUNTS CORPORATION INFORMATION
- 7.3.2 CONTITECH RUBBER MOUNTS PRODUCT PORTFOLIO
- 7.3.3 CONTITECH RUBBER MOUNTS PRODUCTION, REVENUE, PRICE AND GROSS MARGIN (2017-2022)
- 7.3.4 CONTITECH CONTACT INFORMATION
- 7.4 BOGE
- 7.4.1 BOGE RUBBER MOUNTS CORPORATION INFORMATION
- 7.4.2 BOGE RUBBER MOUNTS PRODUCT PORTFOLIO
- 7.4.3 BOGE RUBBER MOUNTS PRODUCTION, REVENUE, PRICE AND GROSS MARGIN (2017-2022)
- 7.4.4 BOGE CONTACT INFORMATION
- 7.5 TUOPU
- 7.5.1 TUOPU RUBBER MOUNTS CORPORATION INFORMATION
- 7.5.2 TUOPU RUBBER MOUNTS PRODUCT PORTFOLIO
- 7.5.3 TUOPU RUBBER MOUNTS PRODUCTION, REVENUE, PRICE AND GROSS MARGIN (2017-2022)
- 7.5.4 TUOPU CONTACT INFORMATION
- 7.6 BRIDGSTONE
- 7.6.1 BRIDGSTONE RUBBER MOUNTS CORPORATION INFORMATION
- 7.6.2 BRIDGSTONE RUBBER MOUNTS PRODUCT PORTFOLIO
- 7.6.3 BRIDGSTONE RUBBER MOUNTS PRODUCTION, REVENUE, PRICE AND GROSS MARGIN (2017-2022)
- 7.6.4 BRIDGSTONE CONTACT INFORMATION
- 7.7 HENNIGES AUTOMOTIVE
- 7.7.1 HENNIGES AUTOMOTIVE RUBBER MOUNTS CORPORATION INFORMATION
- 7.7.2 HENNIGES AUTOMOTIVE RUBBER MOUNTS PRODUCT PORTFOLIO
- 7.7.3 HENNIGES AUTOMOTIVE RUBBER MOUNTS PRODUCTION, REVENUE, PRICE AND GROSS MARGIN (2017-2022)
- 7.7.4 HENNIGES AUTOMOTIVE CONTACT INFORMATION
- 7.8 HUTCHINSON
- 7.8.1 HUTCHINSON RUBBER MOUNTS CORPORATION INFORMATION
- 7.8.2 HUTCHINSON RUBBER MOUNTS PRODUCT PORTFOLIO
- 7.8.3 HUTCHINSON RUBBER MOUNTS PRODUCTION, REVENUE, PRICE AND GROSS MARGIN (2017-2022)
- 7.8.4 HUTCHINSON CONTACT INFORMATION
- 7.9 TOYO TIRE & RUBBER CO.
- 7.9.1 TOYO TIRE & RUBBER CO. RUBBER MOUNTS CORPORATION INFORMATION
- 7.9.2 TOYO TIRE & RUBBER CO. RUBBER MOUNTS PRODUCT PORTFOLIO
- 7.9.3 TOYO TIRE & RUBBER CO. RUBBER MOUNTS PRODUCTION, REVENUE, PRICE AND GROSS MARGIN (2017-2022)
- 7.9.4 TOYO TIRE & RUBBER CO. CONTACT INFORMATION
- 7.10 ZHONGDING
- 7.10.1 ZHONGDING RUBBER MOUNTS CORPORATION INFORMATION
- 7.10.2 ZHONGDING RUBBER MOUNTS PRODUCT PORTFOLIO
- 7.10.3 ZHONGDING RUBBER MOUNTS PRODUCTION, REVENUE, PRICE AND GROSS MARGIN (2017-2022)
- 7.10.4 ZHONGDING CONTACT INFORMATION
- 7.11 YAMASHITA RUBBER
- 7.11.1 YAMASHITA RUBBER RUBBER MOUNTS CORPORATION INFORMATION
- 7.11.2 YAMASHITA RUBBER RUBBER MOUNTS PRODUCT PORTFOLIO
- 7.11.3 YAMASHITA RUBBER RUBBER MOUNTS PRODUCTION, REVENUE, PRICE AND GROSS MARGIN (2017-2022)
- 7.11.4 YAMASHITA RUBBER CONTACT INFORMATION
- 7.12 ASIMCO
- 7.12.1 ASIMCO RUBBER MOUNTS CORPORATION INFORMATION
- 7.12.2 ASIMCO RUBBER MOUNTS PRODUCT PORTFOLIO
- 7.12.3 ASIMCO RUBBER MOUNTS PRODUCTION, REVENUE, PRICE AND GROSS MARGIN (2017-2022)
- 7.12.4 ASIMCO CONTACT INFORMATION
- 7.13 JX ZHAO'S GROUP
- 7.13.1 JX ZHAO'S GROUP RUBBER MOUNTS CORPORATION INFORMATION
- 7.13.2 JX ZHAO'S GROUP RUBBER MOUNTS PRODUCT PORTFOLIO
- 7.13.3 JX ZHAO'S GROUP RUBBER MOUNTS PRODUCTION, REVENUE, PRICE AND GROSS MARGIN (2017-2022)
- 7.13.4 JX ZHAO'橲 GROUP CONTACT INFORMATION
- 7.14 DTR VSM
- 7.14.1 DTR VSM RUBBER MOUNTS CORPORATION INFORMATION
- 7.14.2 DTR VSM RUBBER MOUNTS PRODUCT PORTFOLIO
- 7.14.3 DTR VSM RUBBER MOUNTS PRODUCTION, REVENUE, PRICE AND GROSS MARGIN (2017-2022)
- 7.14.4 DTR VSM CONTACT INFORMATION
- 7.15 LUOSHI
- 7.15.1 LUOSHI RUBBER MOUNTS CORPORATION INFORMATION
- 7.15.2 LUOSHI RUBBER MOUNTS PRODUCT PORTFOLIO
- 7.15.3 LUOSHI RUBBER MOUNTS PRODUCTION, REVENUE, PRICE AND GROSS MARGIN (2017-2022)
- 7.15.4 LUOSHI CONTACT INFORMATION
- 7.16 GMT RUBBER
- 7.16.1 GMT RUBBER RUBBER MOUNTS CORPORATION INFORMATION
- 7.16.2 GMT RUBBER RUBBER MOUNTS PRODUCT PORTFOLIO
- 7.16.3 GMT RUBBER RUBBER MOUNTS PRODUCTION, REVENUE, PRICE AND GROSS MARGIN (2017-2022)
- 7.16.4 GMT RUBBER CONTACT INFORMATION
8 RUBBER MOUNTS MANUFACTURING COST ANALYSIS
- 8.1 RUBBER MOUNTS KEY RAW MATERIALS ANALYSIS
- 8.2 PROPORTION OF MANUFACTURING COST STRUCTURE
- 8.3 RUBBER MOUNTS INDUSTRIAL CHAIN ANALYSIS
9 MARKETING CHANNEL, DISTRIBUTORS AND CUSTOMERS
- 9.1 MARKETING CHANNEL
- 9.2 RUBBER MOUNTS DISTRIBUTORS LIST
- 9.3 RUBBER MOUNTS CUSTOMERS
10 RUBBER MOUNTS MARKET DYNAMICS
- 10.1 RUBBER MOUNTS INDUSTRY TRENDS
- 10.2 RUBBER MOUNTS MARKET DRIVERS
- 10.3 RUBBER MOUNTS MARKET CHALLENGES
- 10.4 RUBBER MOUNTS MARKET RISKS
11 PRODUCTION AND SUPPLY FORECAST
- 11.1 GLOBAL FORECASTED PRODUCTION OF RUBBER MOUNTS BY REGION (2023-2028)
- 11.2 NORTH AMERICA RUBBER MOUNTS PRODUCTION FORECAST (2023-2028)
- 11.3 EUROPE RUBBER MOUNTS PRODUCTION, REVENUE FORECAST (2023-2028)
- 11.4 CHINA RUBBER MOUNTS PRODUCTION, REVENUE FORECAST (2023-2028)
- 11.5 JAPAN RUBBER MOUNTS PRODUCTION, REVENUE FORECAST (2023-2028)
12 CONSUMPTION AND DEMAND FORECAST
- 12.1 GLOBAL FORECASTED DEMAND ANALYSIS OF RUBBER MOUNTS
- 12.2 NORTH AMERICA FORECASTED CONSUMPTION OF RUBBER MOUNTS BY COUNTRY
- 12.3 EUROPE MARKET FORECASTED CONSUMPTION OF RUBBER MOUNTS BY COUNTRY
- 12.4 ASIA PACIFIC MARKET FORECASTED CONSUMPTION OF RUBBER MOUNTS BY REGION
- 12.5 SOUTH AMERICA FORECASTED CONSUMPTION OF RUBBER MOUNTS BY COUNTRY
13 FORECAST BY TYPE AND BY APPLICATION
- 13.1 GLOBAL PRODUCTION, REVENUE AND PRICE FORECAST BY TYPE (2023-2028)
- 13.1.1 GLOBAL FORECASTED PRODUCTION OF RUBBER MOUNTS BY TYPE (2023-2028)
- 13.1.2 GLOBAL FORECASTED REVENUE OF RUBBER MOUNTS BY TYPE (2023-2028)
- 13.1.3 GLOBAL FORECASTED PRICE OF RUBBER MOUNTS BY TYPE (2023-2028)
- 13.2 GLOBAL FORECASTED CONSUMPTION OF RUBBER MOUNTS BY APPLICATION (2022-2027)
14 RESEARCH FINDINGS AND CONCLUSION
15 METHODOLOGY AND DATA SOURCE
- 15.1 METHODOLOGY/RESEARCH APPROACH
- 15.1.1 RESEARCH PROGRAMS/DESIGN
- 15.1.2 MARKET SIZE ESTIMATION
- 15.1.3 MARKET BREAKDOWN AND DATA TRIANGULATION
- 15.2 DATA SOURCE
- 15.2.1 SECONDARY SOURCES
- 15.2.2 PRIMARY SOURCES
- 15.3 AUTHOR LIST
- 15.4 DISCLAIMER