|
|
市場調査レポート
商品コード
1121194
プローブカードの世界市場、実績と予測(2017年~2028年)Global Probe Card Market Report, History and Forecast 2017-2028 |
||||||
|
|
|||||||
|
● お客様のご希望に応じて、既存データの加工や未掲載情報(例:国別セグメント)の追加などの対応が可能です。 詳細はお問い合わせください。 |
|||||||


| プローブカードの世界市場、実績と予測(2017年~2028年) |
|
出版日: 2022年09月01日
発行: QYResearch
ページ情報: 英文 137 Pages
納期: 2~3営業日
|
- 全表示
- 概要
- 図表
- 目次
市場の分析と洞察
世界のプローブカードの市場規模は、2021年に24億7883万米ドルとなり、2028年には38億8357万米ドルに達する見通しで、予測期間(2022年~2028年)にCAGR6.53%になると予測されています。
プローブカードの世界主要メーカーは、FormFactor、Technoprobe S.p.A.、日本マイクロニクス(MJC)、日本電子材料(JEM)、MPI Corporation、SV Probe、Microfriend、韓国計測器、ウィルテクノロジーなどです。2021年には、世界6大企業が売上高で約72.09%のシェアを持つ。
2021年の北米のプローブカード市場規模は3億5,901万米ドル、中国は約3億4,456万米ドル。中国の割合は2021年に13.90%で、2028年には16.34%に達すると予測されており、分析期間を通じてCAGR9.01%を推移しています。欧州のプローブカードの状況としては、ドイツは2028年に4088万米ドルに達すると予測されており、アジアでは日本と韓国が注目され、今後6年間のCAGRはそれぞれ4.98%と6.41%です。
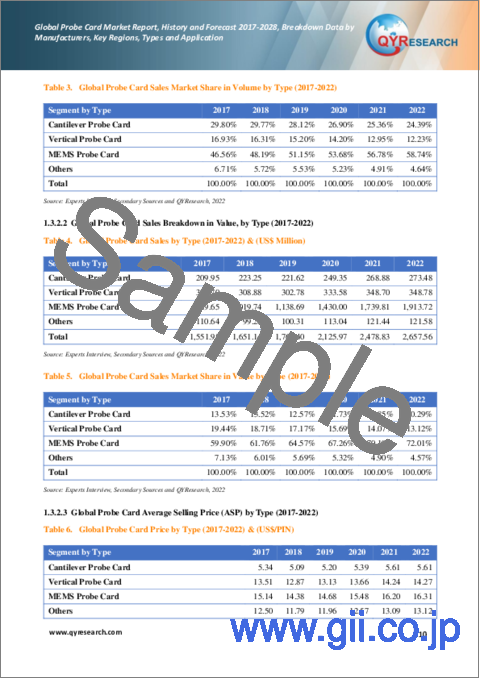
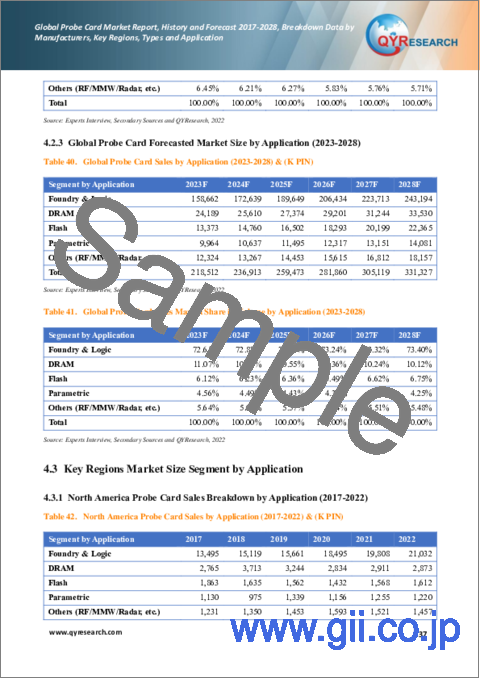
COVID-19による経済変化を十分に考慮すると、2021年にプローブカード世界市場の70.19%を占めたMEMSプローブカードは、2028年までに30億8,049万米ドルの価値を持ち、2022年から2028年までのCAGR8.35%で成長すると予測されます。ファウンドリ&ロジックセグメントは、この予測期間を通してCAGR 9.07%に変化し、2028年には約73.40%のシェアを占めると予測されます。
範囲と市場規模
プローブカードの世界市場は、地域(国)別、企業別、タイプ別、用途別に分類されています。世界のプローブカード市場におけるプレイヤー、利害関係者、その他の参加者は、このレポートを強力なリソースとして利用することで、優位に立つことができるようになることでしょう。セグメント別分析では、2017年から2028年までの地域(国)別、タイプ別、用途別の売上、収益と予測に焦点を当てます。
目次
第1章 プローブカード市場概要
- プローブカード製品概要
- タイプ別:プローブカード市場セグメント
- カンチレバー型プローブカード
- 垂直型プローブカード
- MEMS型プローブカード
- その他
- タイプ別:世界の市場規模
- タイプ別:主要地域の市場規模セグメント
第2章 企業別:プローブカード市場競争
- 販売別:世界の主要企業(2018-2022)
- 収益別:世界の主要企業(2018-2022)
- 価格別:世界の主要企業(2018-2022)
- 世界の主要メーカー製造拠点分布、販売エリア、製品タイプ
- 市場の競争状況と動向
- 企業タイプ(Tier 1、Tier 2、Tier 3)別:世界の主要メーカー(2021年の収益に基づく)
- 主要メーカーの設立日
- 合併と買収、拡張
第3章 地域別:プローブカードの現状と展望
- 地域別:世界の市場規模とCAGR(2017 VS 2021 VS 2028)
- 地域別:世界の市場規模実績
- 地域別:世界の市場規模予測
第4章 用途別:プローブカード
- 用途別:プローブカード市場セグメント
- ファウンドリー・ロジック
- DRAM
- 閃光
- パラメトリック
- その他(RF/MMW/レーダーなど)
- 用途別:世界の市場規模
- 用途別:主要地域の市場規模セグメント
第5章 国別:北米のプローブカード
- 国別:市場規模実績
- 国別:市場規模予測
第6章 国別:欧州のプローブカード
- 国別:市場規模実績
- 国別:市場規模予測
第7章 地域別:アジア太平洋プローブカード
- 地域別:市場規模実績
- 地域別:市場規模予測
第8章 国別:ラテンアメリカのプローブカード
- 国別:市場規模実績
- 国別:市場規模予測
第9章 国別:中東・アフリカのプローブカード
- 国別:市場規模実績
- 国別:市場規模予測
第10章 プローブカード事業の企業プロファイルと主要データ
- FormFactor
- Technoprobe SpA
- Micronics Japan(MJC)
- Japan Electronic Materials(JEM)
- MPI Corporation
- SV Probe
- Microfriend
- Korea Instrument
- Will Technology
- TSE
- Feinmetall
- Synergie Cad Probe
- TIPS Messtechnik GmbH
- STAr Technologies, Inc.
- MaxOne
- Shenzhen DGT
- Suzhou Silicon Test System
- CHPT
第11章 アップストリーム、機会、課題、リスク、および影響の要因分析
- 主要原材料
- 製造コスト構造
- 産業チェーン分析
- 市場力学
- 業界の動向
- 市場促進要因
- 市場の課題
- ポーターのファイブフォース分析
第12章 マーケティング戦略分析、ディストリビューター
- 販売チャンネル
- ディストリビューター
- ダウンストリームの顧客
第13章 調査結果と結論
第14章 付録
LIST OF TABLES
- Table 1. Global Probe Card Sales by Type: 2017 VS 2021 VS 2028 (US$ Million)
- Table 2. Global Probe Card Sales by Type (2017-2022) & (K PIN)
- Table 3. Global Probe Card Sales Market Share in Volume by Type (2017-2022)
- Table 4. Global Probe Card Sales by Type (2017-2022) & (US$ Million)
- Table 5. Global Probe Card Sales Market Share in Value by Type (2017-2022)
- Table 6. Global Probe Card Price by Type (2017-2022) & (US$/PIN)
- Table 7. Global Probe Card Sales by Type (2023-2028) & (K PIN)
- Table 8. Global Probe Card Sales Market Share in Volume by Type (2023-2028)
- Table 9. Global Probe Card Sales by Type (2023-2028) & (US$ Million)
- Table 10. Global Probe Card Sales Market Share in Value by Type (2023-2028)
- Table 11. Global Probe Card Price by Type (2023-2028) & (US$/PIN)
- Table 12. North America Probe Card Sales by Type (2017-2022) & (K PIN)
- Table 13. Europe Probe Card Sales (K PIN) by Type (2017-2022)
- Table 14. Asia-Pacific Probe Card Sales (K PIN) by Type (2017-2022)
- Table 15. Latin America Probe Card Sales (K PIN) by Type (2017-2022)
- Table 16. Middle East and Africa Probe Card Sales (K PIN) by Type (2017-2022)
- Table 17. Global Probe Card Sales by Company (2018-2022) & (K PIN)
- Table 18. Global Probe Card Sales Share by Company (2018-2022)
- Table 19. Global Probe Card Revenue by Company (2018-2022) & (US$ Million)
- Table 20. Global Probe Card Revenue Share by Company (2018-2022)
- Table 21. Global Market Probe Card Price by Company (2018-2022) & (US$/PIN)
- Table 22. Global Probe Card Top Manufacturers Manufacturing Base Distribution and Sales Area
- Table 23. Global Probe Card Manufacturers Market Concentration Ratio (CR5)
- Table 24. Global Top Manufacturers Market Share by Company Type (Tier 1, Tier 2, and Tier 3) & (based on the Revenue in Probe Card as of 2021)
- Table 25. Established Date of Key Probe Card Manufacturers
- Table 26. Global Probe Card Market Size Comparison by Region (US$ Million): 2017 VS 2021 VS 2028
- Table 27. Global Probe Card Sales by Region (2017-2022) & (K PIN)
- Table 28. Global Probe Card Sales Market Share in Volume by Region (2017-2022)
- Table 29. Global Probe Card Sales by Region (2017-2022) & (US$ Million)
- Table 30. Global Probe Card Sales Market Share in Value by Region (2017-2022)
- Table 31. Global Probe Card Sales (K PIN), Value (US$ Million), Price (US$/PIN) and Gross Margin (2017-2022)
- Table 32. Global Probe Card Sales by Region (2023-2028) & (K PIN)
- Table 33. Global Probe Card Sales Market Share in Volume by Region (2023-2028)
- Table 34. Global Probe Card Sales by Region (2023-2028) & (US$ Million)
- Table 35. Global Probe Card Sales Market Share in Value by Region (2023-2028)
- Table 36. Global Probe Card Sales (K PIN), Value (US$ Million), Price (US$/PIN) and Gross Margin (2023-2028)
- Table 37. Global Probe Card Sales by Application: 2017 VS 2021 VS 2028 (K PIN)
- Table 38. Global Probe Card Sales by Application (2017-2022) & (K PIN)
- Table 39. Global Probe Card Sales Market Share in Volume by Application (2017-2022)
- Table 40. Global Probe Card Sales by Application (2023-2028) & (K PIN)
- Table 41. Global Probe Card Sales Market Share in Volume by Application (2023-2028)
- Table 42. North America Probe Card Sales by Application (2017-2022) & (K PIN)
- Table 43. Europe Probe Card Sales (K PIN) by Application (2017-2022)
- Table 44. Asia-Pacific Probe Card Sales (K PIN) by Application (2017-2022)
- Table 45. Latin America Probe Card Sales (K PIN) by Application (2017-2022)
- Table 46. Middle East and Africa Probe Card Sales (K PIN) by Application (2017-2022)
- Table 47. North America Probe Card Sales by Country (2017-2022) & (K PIN)
- Table 48. North America Probe Card Sales Market Share in Volume by Country (2017-2022)
- Table 49. North America Probe Card Sales by Country (2017-2022) & (US$ Million)
- Table 50. North America Probe Card Sales Market Share in Value by Country (2017-2022)
- Table 51. North America Probe Card Sales by Country (2023-2028) & (K PIN)
- Table 52. North America Probe Card Sales Market Share in Volume by Country (2023-2028)
- Table 53. North America Probe Card Sales by Country (2023-2028) & (US$ Million)
- Table 54. North America Probe Card Sales Market Share in Value by Country (2023-2028)
- Table 55. Europe Probe Card Sales by Country (2017-2022) & (K PIN)
- Table 56. Europe Probe Card Sales Market Share in Volume by Country (2017-2022)
- Table 57. Europe Probe Card Sales by Country (2017-2022) & (US$ Million)
- Table 58. Europe Probe Card Sales Market Share in Value by Country (2017-2022)
- Table 59. Europe Probe Card Sales by Country (2023-2028) & (K PIN)
- Table 60. Europe Probe Card Sales Market Share in Volume by Country (2023-2028)
- Table 61. Europe Probe Card Sales by Country (2023-2028) & (US$ Million)
- Table 62. Europe Probe Card Sales Market Share in Value by Country (2023-2028)
- Table 63. Asia-Pacific Probe Card Sales by Region (2017-2022) & (K PIN)
- Table 64. Asia-Pacific Probe Card Sales Market Share in Volume by Region (2017-2022)
- Table 65. Asia-Pacific Probe Card Sales by Region (2017-2022) & (US$ Million)
- Table 66. Asia-Pacific Probe Card Sales Market Share in Value by Region (2017-2022)
- Table 67. Asia-Pacific Probe Card Sales by Region (2023-2028) & (K PIN)
- Table 68. Asia-Pacific Probe Card Sales Market Share in Volume by Region (2023-2028)
- Table 69. Asia-Pacific Probe Card Sales by Region (2023-2028) & (US$ Million)
- Table 70. Asia-Pacific Probe Card Sales Market Share in Value by Region (2023-2028)
- Table 71. Latin America Probe Card Sales by Country (2017-2022) & (K PIN)
- Table 72. Latin America Probe Card Sales Market Share in Volume by Country (2017-2022)
- Table 73. Latin America Probe Card Sales by Country (2017-2022) & (US$ Million)
- Table 74. Latin America Probe Card Sales Market Share in Value by Country (2017-2022)
- Table 75. Latin America Probe Card Sales by Country (2023-2028) & (K PIN)
- Table 76. Latin America Probe Card Sales Market Share in Volume by Country (2023-2028)
- Table 77. Latin America Probe Card Sales by Country (2023-2028) & (US$ Million)
- Table 78. Latin America Probe Card Sales Market Share in Value by Country (2023-2028)
- Table 79. Middle East and Africa Probe Card Sales by Country (2017-2022) & (K PIN)
- Table 80. Middle East and Africa Probe Card Sales Market Share in Volume by Country (2017-2022)
- Table 81. Middle East and Africa Probe Card Sales by Country (2017-2022) & (US$ Million)
- Table 82. Middle East and Africa Probe Card Sales Market Share in Value by Country (2017-2022)
- Table 83. Middle East and Africa Probe Card Sales by Country (2023-2028) & (K PIN)
- Table 84. Middle East and Africa Probe Card Sales Market Share by Country (2023-2028)
- Table 85. Middle East and Africa Probe Card Sales by Country (2023-2028) & (US$ Million)
- Table 86. Middle East and Africa Probe Card Sales Market Share in Value by Country (2023-2028)
- Table 87. FormFactor Basic Information, Manufacturing Base, Sales Area and Its Competitors
- Table 88. FormFactor Probe Card Sales (K PIN), Revenue (US$ Million), Price (US$/PIN) and Gross Margin (%) (2018-2022)
- Table 89. FormFactor Probe Card SWOT Analysis
- Table 90. Technoprobe S.p.A. Basic Information, Manufacturing Base, Sales Area and Its Competitors
- Table 91. Technoprobe S.p.A. Probe Card Sales (K PIN), Revenue (US$ Million), Price (US$/PIN) and Gross Margin (%) (2018-2022)
- Table 92. Technoprobe S.p.A. Probe Card SWOT Analysis
- Table 93. Micronics Japan (MJC) Basic Information, Manufacturing Base, Sales Area and Its Competitors
- Table 94. Micronics Japan (MJC) Probe Card Sales (K PIN), Revenue (US$ Million), Price (US$/PIN) and Gross Margin (%) (2018-2022)
- Table 95. Micronics Japan (MJC) Probe Card SWOT Analysis
- Table 96. Japan Electronic Materials (JEM) Basic Information, Manufacturing Base, Sales Area and Its Competitors
- Table 97. Japan Electronic Materials (JEM) Probe Card Sales (K PIN), Revenue (US$ Million), Price (US$/PIN) and Gross Margin (%) (2018-2022)
- Table 98. Japan Electronic Materials (JEM) Probe Card SWOT Analysis
- Table 99. MPI Corporation Basic Information, Manufacturing Base, Sales Area and Its Competitors
- Table 100. MPI Corporation Probe Card Sales (K PIN), Revenue (US$ Million), Price (US$/PIN) and Gross Margin (%) (2018-2022)
- Table 101. MPI Corporation Probe Card SWOT Analysis
- Table 102. SV Probe Basic Information, Manufacturing Base, Sales Area and Its Competitors
- Table 103. SV Probe Probe Card Sales (K PIN), Revenue (US$ Million), Price (US$/PIN) and Gross Margin (%) (2018-2022)
- Table 104. SV Probe, Inc. Probe Card SWOT Analysis
- Table 105. Microfriend Basic Information, Manufacturing Base, Sales Area and Its Competitors
- Table 106. Microfriend Probe Card Sales (K PIN), Revenue (US$ Million), Price (US$/PIN) and Gross Margin (%) (2018-2022)
- Table 107. Microfriend Probe Card SWOT Analysis
- Table 108. Korea Instrument Basic Information, Manufacturing Base, Sales Area and Its Competitors
- Table 109. Korea Instrument Probe Card Sales (K PIN), Revenue (US$ Million), Price (US$/PIN) and Gross Margin (%) (2018-2022)
- Table 110. Korea Instrument Probe Card SWOT Analysis
- Table 111. Will Technology Basic Information, Manufacturing Base, Sales Area and Its Competitors
- Table 112. Will Technology Probe Card Sales (K PIN), Revenue (US$ Million), Price (US$/PIN) and Gross Margin (%) (2018-2022)
- Table 113. Will Technology Probe Card SWOT Analysis
- Table 114. TSE Basic Information, Manufacturing Base, Sales Area and Its Competitors
- Table 115. TSE Probe Card Sales (K PIN), Revenue (US$ Million), Price (US$/PIN) and Gross Margin (%) (2018-2022)
- Table 116. TSE Probe Card SWOT Analysis
- Table 117. Feinmetall Basic Information, Manufacturing Base, Sales Area and Its Competitors
- Table 118. Feinmetall Probe Card Sales (K PIN), Revenue (US$ Million), Price (US$/PIN) and Gross Margin (%) (2018-2022)
- Table 119. Feinmetall Probe Card SWOT Analysis
- Table 120. Synergie Cad Probe Basic Information, Manufacturing Base, Sales Area and Its Competitors
- Table 121. Synergie Cad Probe Probe Card Sales (K PIN), Revenue (US$ Million), Price (US$/PIN) and Gross Margin (%) (2018-2022)
- Table 122. Synergie Cad Probe Probe Card SWOT Analysis
- Table 123. TIPS Messtechnik GmbH Basic Information, Manufacturing Base, Sales Area and Its Competitors
- Table 124. TIPS Messtechnik GmbH Probe Card Sales (K PIN), Revenue (US$ Million), Price (US$/PIN) and Gross Margin (%) (2018-2022)
- Table 125. TIPS Messtechnik GmbH Probe Card SWOT Analysis
- Table 126. STAr Technologies, Inc. Basic Information, Manufacturing Base, Sales Area and Its Competitors
- Table 127. STAr Technologies, Inc. Probe Card Sales (K PIN), Revenue (US$ Million), Price (US$/PIN) and Gross Margin (%) (2018-2022)
- Table 128. STAr Technologies, Inc. Probe Card SWOT Analysis
- Table 129. MaxOne Basic Information, Manufacturing Base, Sales Area and Its Competitors
- Table 130. MaxOne Probe Card Sales (K PIN), Revenue (US$ Million), Price (US$/PIN) and Gross Margin (%) (2018-2022)
- Table 131. MaxOne Probe Card SWOT Analysis
- Table 132. Shenzhen DGT Basic Information, Manufacturing Base, Sales Area and Its Competitors
- Table 133. Shenzhen DGT Probe Card Sales (K PIN), Revenue (US$ Million), Price (US$/PIN) and Gross Margin (%) (2018-2022)
- Table 134. Shenzhen DGT Probe Card SWOT Analysis
- Table 135. Suzhou Silicon Test System Basic Information, Manufacturing Base, Sales Area and Its Competitors
- Table 136. Suzhou Silicon Test System Probe Card Sales (K PIN), Revenue (US$ Million), Price (US$/PIN) and Gross Margin (%) (2018-2022)
- Table 137. Suzhou Silicon Test System Probe Card SWOT Analysis
- Table 138. CHPT Basic Information, Manufacturing Base, Sales Area and Its Competitors
- Table 139. CHPT Probe Card Sales (K PIN), Revenue (US$ Million), Price (US$/PIN) and Gross Margin (%) (2018-2022)
- Table 140. CHPT Probe Card SWOT Analysis
- Table 141. Raw Materials Key Suppliers Lists
- Table 142. Probe Card Manufacturing Cost Structure
- Table 143. Probe Card Market Trends
- Table 144. Probe Card Market Drivers
- Table 145. Probe Card Market Challenges
- Table 146. Probe Card Distributors Example List
- Table 147. Probe Card Downstream Customers Examples
- Table 148. Research Programs/Design for This Report
- Table 149. Key Data Information from Secondary Sources
- Table 150. Key Data Information from Primary Sources
List of Figures
- Figure 1. Probe Card Product Picture
- Figure 2. Global Probe Card Market Size, 2017 VS 2021 VS 2028 (US$ Million)
- Figure 3. Global Probe Card Market Size Status and Outlook (2017-2028) & (US$ Million)
- Figure 4. Global Probe Card Sales Status and Outlook (2017-2028) & (K PIN)
- Figure 5. Product Picture of Cantilever Probe Card
- Figure 6. Global Cantilever Probe Card Sales YoY Growth (2017-2028) & (K PIN)
- Figure 7. Product Picture of Vertical Probe Card
- Figure 8. Global Vertical Probe Card Sales YoY Growth (2017-2028) & (K PIN)
- Figure 9. Product Picture of MEMS Probe Card
- Figure 10. Global MEMS Probe Card Sales YoY Growth (2017-2028) & (K PIN)
- Figure 11. Global Others Sales YoY Growth (2017-2028) & (K PIN)
- Figure 12. Global Probe Card Sales by Type (2017-2028) & (US$ Million)
- Figure 13. Global Probe Card Market Share by Type in 2021 & 2028
- Figure 14. North America Probe Card Sales Market Share in Volume by Type in 2021
- Figure 15. Europe Probe Card Sales Market Share in Volume by Type in 2021
- Figure 16. Asia-Pacific Probe Card Sales Market Share in Volume by Type in 2021
- Figure 17. Latin America Probe Card Sales Market Share in Volume by Type in 2021
- Figure 18. Middle East and Africa Probe Card Sales Market Share in Volume by Type in 2021
- Figure 19. The 5 and 10 Largest Manufacturers in the World: Market Share by Probe Card Revenue in 2021
- Figure 20. Probe Card Market Share by Company Type (Tier 1, Tier 2, and Tier 3): 2021
- Figure 21. Global Foundry & Logic Sales YoY Growth (2017-2028) & (K PIN)
- Figure 22. Global DRAM Sales YoY Growth (2017-2028) & (K PIN)
- Figure 23. Global Flash Sales YoY Growth (2017-2028) & (K PIN)
- Figure 24. Global Parametric Sales YoY Growth (2017-2028) & (K PIN)
- Figure 25. Global Others (RF/MMW/Radar, etc.) Sales YoY Growth (2017-2028) & (K PIN)
- Figure 26. Global Probe Card Sales by Application (2017-2028) & (K PIN)
- Figure 27. Global Probe Card Market Share by Application in 2021 & 2028
- Figure 28. North America Probe Card Sales Market Share in Volume by Application in 2021
- Figure 29. Europe Probe Card Sales Market Share in Volume by Application in 2021
- Figure 30. Asia-Pacific Probe Card Sales Market Share in Volume by Application in 2021
- Figure 31. Latin America Probe Card Sales Market Share in Volume by Application in 2021
- Figure 32. Middle East and Africa Probe Card Sales Market Share in Volume by Application in 2021
- Figure 33. Probe Card Product Picture Examples of FormFactor
- Figure 34. Probe Card Product Picture Examples of FormFactor
- Figure 35. Probe Card Product Picture Examples of Technoprobe S.p.A.
- Figure 36. Probe Card Product Picture Examples of Micronics Japan (MJC)
- Figure 37. Probe Card Product Picture Examples of Micronics Japan (MJC)
- Figure 38. Probe Card Product Picture Examples of Micronics Japan (MJC)
- Figure 39. Probe Card CE Series Product Picture Examples of Japan Electronic Materials (JEM)
- Figure 40. Probe Card VC Series Product Specification Examples of Japan Electronic Materials (JEM)
- Figure 41. Probe Card Product Picture Examples of MPI Corporation
- Figure 42. Probe Card Product Picture Examples of SV Probe
- Figure 43. Probe Card Product Picture Examples of Microfriend
- Figure 44. Probe Card Product Picture Examples of Korea Instrument
- Figure 45. Probe Card Product Specification Examples of Korea Instrument
- Figure 46. Probe Card Product Picture Examples of Will Technology
- Figure 47. Probe Card Product Specification Examples of Will Technology
- Figure 48. Probe Card HPC Product Picture Examples of TSE
- Figure 49. Probe Card CPM Product Picture Examples of TSE
- Figure 50. Probe Card ViProbe® Product Picture Examples of Feinmetall
- Figure 51. Probe Card Product Picture Examples of Synergie Cad Probe
- Figure 52. Probe Card Product Picture Examples of TIPS Messtechnik GmbH
- Figure 53. Probe Card Product Picture Examples of STAr Technologies, Inc.
- Figure 54. Probe Card Product Picture Examples of MaxOne
- Figure 55. Probe Card Product Picture Examples of Shenzhen DGT
- Figure 56. Probe Card Product Picture Examples of Suzhou Silicon Test System
- Figure 57. Probe Card Multi-Site Product Specification Examples of Suzhou Silicon Test System
- Figure 58. Probe Card Product Picture Examples of CHPT
- Figure 59. Probe Card Multi-Site Product Specification Examples of CHPT
- Figure 60. Probe Card Industrial Chain Analysis
- Figure 61. Transistor Scaling and Cost Reduction Trajectory Slowing
- Figure 62. Porter's Five Forces Analysis
- Figure 63. Channels of Distribution
- Figure 64. Distributors Profiles
- Figure 65. Bottom-up and Top-down Approaches for This Report
- Figure 66. Data Triangulation
- Figure 67. Key Executives Interviewed 116
Market Analysis and Insights:
Due to the COVID-19 pandemic, the global Probe Card market size was value at US$ 2,478.83 million in 2021 and is forecast to be a readjusted size of US$ 3,883.57 million by 2028 with a CAGR of 6.53% during the forecast period 2022-2028.
The global main manufacturers of Probe Card include FormFactor, Technoprobe S.p.A., Micronics Japan (MJC), Japan Electronic Materials (JEM), MPI Corporation, SV Probe, Microfriend, Korea Instrument, and Will Technology, etc. In 2021, the global six largest players have a share approximately 72.09% in terms of revenue.
The North America Probe Card market size was US$ 359.01 million in 2021, while China was about US$ 344.56 million. The proportion of the China was 13.90% in 2021 and it is predicted that the share will reach 16.34% in 2028, trailing a CAGR of 9.01% through the analysis period. As for the Europe Probe Card landscape, Germany is projected to reach US$ 40.88 million by 2028. and in Asia, the notable markets are Japan and South Korea, CAGR is 4.98% and 6.41% respectively for the next 6-year period.
Fully considering the economic change by the COVID-19, MEMS Probe Card accounting for 70.19% of the Probe Card global market in 2021, is projected to value US$ 3,080.49 million by 2028, growing at a revised CAGR of 8.35% from 2022 to 2028. While Foundry & Logic segment is altered to an 9.07% CAGR throughout this forecast period and will hold a share about 73.40% in 2028.
Scope and Market Size:
The global Probe Card market is segmented by region (country), company, by Type, and by Application. Players, stakeholders, and other participants in the global Probe Card market will be able to gain the upper hand as they use the report as a powerful resource. The segmental analysis focuses on sales, revenue and forecast by region (country), by Type, and by Application for the period 2017-2028.
By Company
- FormFactor
- Technoprobe S.p.A.
- Micronics Japan (MJC)
- Japan Electronic Materials (JEM)
- MPI Corporation
- SV Probe
- Microfriend
- Korea Instrument
- Will Technology
- TSE
- Feinmetall
- Synergie Cad Probe
- TIPS Messtechnik GmbH
- STAr Technologies, Inc.
- MaxOne
- Shenzhen DGT
- Suzhou Silicon Test System
- CHPT
Segment by Type
- Cantilever Probe Card
- Vertical Probe Card
- MEMS Probe Card
- Others
Segment by Application
- Foundry & Logic
- DRAM
- Flash
- Parametric
- Others (RF/MMW/Radar, etc.)
By Region
- North America
- U.S.
- Canada
- Asia-Pacific
- China
- Japan
- South Korea
- China Taiwan
- India
- Southeast Asia
- Europe
- Germany
- France
- U.K.
- Italy
- Russia
- Latin America
- Mexico
- Brazil
- Middle East & Africa
TABLE OF CONTENTS
1 Probe Card Market Overview
- 1.1 Probe Card Product Overview
- 1.2 Probe Card Market Segment by Type
- 1.2.1 Cantilever Probe Card
- 1.2.2 Vertical Probe Card
- 1.2.3 MEMS Probe Card
- 1.2.4 Others
- 1.3 Global Probe Card Market Size by Type
- 1.3.1 Global Probe Card Market Size Overview by Type (2017-2028)
- 1.3.2 Global Probe Card Historic Market Size Review by Type (2017-2022)
- 1.3.3 Global Probe Card Forecasted Market Size by Type (2023-2028)
- 1.4 Key Regions Market Size Segment by Type
- 1.4.1 North America Probe Card Sales Breakdown by Type (2017-2022)
- 1.4.2 Europe Probe Card Sales Breakdown by Type (2017-2022)
- 1.4.3 Asia-Pacific Probe Card Sales Breakdown by Type (2017-2022)
- 1.4.4 Latin America Probe Card Sales Breakdown by Type (2017-2022)
- 1.4.5 Middle East and Africa Probe Card Sales Breakdown by Type (2017-2022)
2 Probe Card Market Competition by Company
- 2.1 Global Top Players by Probe Card Sales (2018-2022)
- 2.2 Global Top Players by Probe Card Revenue (2018-2022)
- 2.3 Global Top Players by Probe Card Price (2018-2022)
- 2.4 Global Top Manufacturers Probe Card Manufacturing Base Distribution, Sales Area, Product Type
- 2.5 Probe Card Market Competitive Situation and Trends
- 2.5.1 Probe Card Market Concentration Rate (2018-2022)
- 2.5.2 Global 5 and 10 Largest Manufacturers by Probe Card Revenue in 2021
- 2.6 Global Top Manufacturers by Company Type (Tier 1, Tier 2, and Tier 3) & (based on the Revenue in Probe Card as of 2021)
- 2.7 Established Date of Key Probe Card Manufacturers
- 2.8 Mergers & Acquisitions, Expansion
3 Probe Card Status and Outlook by Region
- 3.1 Global Probe Card Market Size and CAGR by Region: 2017 VS 2021 VS 2028
- 3.2 Global Probe Card Historic Market Size by Region
- 3.2.1 Global Probe Card Sales in Volume by Region (2017-2022)
- 3.2.2 Global Probe Card Sales in Value by Region (2017-2022)
- 3.2.3 Global Probe Card Sales (Volume & Value), Price and Gross Margin (2017-2022)
- 3.3 Global Probe Card Forecasted Market Size by Region
- 3.3.1 Global Probe Card Sales in Volume by Region (2023-2028)
- 3.3.2 Global Probe Card Sales in Value by Region (2023-2028)
- 3.3.3 Global Probe Card Sales (Volume & Value), Price and Gross Margin (2023-2028)
4 Probe Card by Application
- 4.1 Probe Card Market Segment by Application
- 4.1.1 Foundry & Logic
- 4.1.2 DRAM
- 4.1.3 Flash
- 4.1.4 Parametric
- 4.1.5 Others (RF/MMW/Radar, etc.)
- 4.2 Global Probe Card Market Size by Application
- 4.2.1 Global Probe Card Market Size Overview by Application (2017-2028)
- 4.2.2 Global Probe Card Historic Market Size Review by Application (2017-2022)
- 4.2.3 Global Probe Card Forecasted Market Size by Application (2023-2028)
- 4.3 Key Regions Market Size Segment by Application
- 4.3.1 North America Probe Card Sales Breakdown by Application (2017-2022)
- 4.3.2 Europe Probe Card Sales Breakdown by Application (2017-2022)
- 4.3.3 Asia-Pacific Probe Card Sales Breakdown by Application (2017-2022)
- 4.3.4 Latin America Probe Card Sales Breakdown by Application (2017-2022)
- 4.3.5 Middle East and Africa Probe Card Sales Breakdown by Application (2017-2022)
5 North America Probe Card by Country
- 5.1 North America Probe Card Historic Market Size by Country
- 5.1.1 North America Probe Card Sales in Volume by Country (2017-2022)
- 5.1.2 North America Probe Card Sales in Value by Country (2017-2022)
- 5.2 North America Probe Card Forecasted Market Size by Country
- 5.2.1 North America Probe Card Sales in Volume by Country (2023-2028)
- 5.2.2 North America Probe Card Sales in Value by Country (2023-2028)
6 Europe Probe Card by Country
- 6.1 Europe Probe Card Historic Market Size by Country
- 6.1.1 Europe Probe Card Sales in Volume by Country (2017-2022)
- 6.1.2 Europe Probe Card Sales in Value by Country (2017-2022)
- 6.2 Europe Probe Card Forecasted Market Size by Country
- 6.2.1 Europe Probe Card Sales in Volume by Country (2023-2028)
- 6.2.2 Europe Probe Card Sales in Value by Country (2023-2028)
7 Asia-Pacific Probe Card by Region
- 7.1 Asia-Pacific Probe Card Historic Market Size by Region
- 7.1.1 Asia-Pacific Probe Card Sales in Volume by Region (2017-2022)
- 7.1.2 Asia-Pacific Probe Card Sales in Value by Region (2017-2022)
- 7.2 Asia-Pacific Probe Card Forecasted Market Size by Region
- 7.2.1 Asia-Pacific Probe Card Sales in Volume by Region (2023-2028)
- 7.2.2 Asia-Pacific Probe Card Sales in Value by Region (2023-2028)
8 Latin America Probe Card by Country
- 8.1 Latin America Probe Card Historic Market Size by Country
- 8.1.1 Latin America Probe Card Sales in Volume by Country (2017-2022)
- 8.1.2 Latin America Probe Card Sales in Value by Country (2017-2022)
- 8.2 Latin America Probe Card Forecasted Market Size by Country
- 8.2.1 Latin America Probe Card Sales in Volume by Country (2023-2028)
- 8.2.2 Latin America Probe Card Sales in Value by Country (2023-2028)
9 Middle East and Africa Probe Card by Country
- 9.1 Middle East and Africa Probe Card Historic Market Size by Country
- 9.1.1 Middle East and Africa Probe Card Sales in Volume by Country (2017-2022)
- 9.1.2 Middle East and Africa Probe Card Sales in Value by Country (2017-2022)
- 9.2 Middle East and Africa Probe Card Forecasted Market Size by Country
- 9.2.1 Middle East and Africa Probe Card Sales in Volume by Country (2023-2028)
- 9.2.2 Middle East and Africa Probe Card Sales in Value by Country (2023-2028)
10 Company Profiles and Key Figures in Probe Card Business
- 10.1 FormFactor
- 10.1.1 Company Basic Information, Manufacturing Base, Sales Area and Its Competitors
- 10.1.2 Probe Card Product Overview
- 10.1.3 FormFactor Probe Card Sales (K PIN), Revenue (US$ Million), Price (US$/PIN) and Gross Margin (%) (2018-2022)
- 10.1.4 Main Business/Business Overview
- 10.1.5 FormFactor Probe Card SWOT Analysis
- 10.2 Technoprobe S.p.A.
- 10.2.1 Company Basic Information, Manufacturing Base, Sales Area and Its Competitors
- 10.2.2 Probe Card Product Overview
- 10.2.3 Technoprobe S.p.A. Probe Card Sales (K PIN), Revenue (US$ Million), Price (US$/PIN) and Gross Margin (%) (2018-2022)
- 10.2.4 Main Business/Business Overview
- 10.2.5 Technoprobe S.p.A. Probe Card SWOT Analysis
- 10.3 Micronics Japan (MJC)
- 10.3.1 Company Basic Information, Manufacturing Base, Sales Area and Its Competitors
- 10.3.2 Probe Card Product Overview
- 10.3.3 Micronics Japan (MJC) Probe Card Sales (K PIN), Revenue (US$ Million), Price (US$/PIN) and Gross Margin (%) (2018-2022)
- 10.3.4 Main Business/Business Overview
- 10.3.5 Micronics Japan (MJC) Probe Card SWOT Analysis
- 10.4 Japan Electronic Materials (JEM)
- 10.4.1 Company Basic Information, Manufacturing Base, Sales Area and Its Competitors
- 10.4.2 Probe Card Product Overview
- 10.4.3 Japan Electronic Materials (JEM) Probe Card Sales (K PIN), Revenue (US$ Million), Price (US$/PIN) and Gross Margin (%) (2018-2022)
- 10.4.4 Main Business/Business Overview
- 10.4.5 Japan Electronic Materials (JEM) Probe Card SWOT Analysis
- 10.5 MPI Corporation
- 10.5.1 Company Basic Information, Manufacturing Base, Sales Area and Its Competitors
- 10.5.2 Probe Card Product Overview
- 10.5.3 MPI Corporation Probe Card Sales (K PIN), Revenue (US$ Million), Price (US$/PIN) and Gross Margin (%) (2018-2022)
- 10.5.4 Main Business/Business Overview
- 10.5.5 MPI Corporation Probe Card SWOT Analysis
- 10.6 SV Probe
- 10.6.1 Company Basic Information, Manufacturing Base, Sales Area and Its Competitors
- 10.6.2 Probe Card Product Overview
- 10.6.3 SV Probe Probe Card Sales (K PIN), Revenue (US$ Million), Price (US$/PIN) and Gross Margin (%) (2018-2022)
- 10.6.4 Main Business/Business Overview
- 10.6.5 SV Probe, Inc. Probe Card SWOT Analysis
- 10.7 Microfriend
- 10.7.1 Company Basic Information, Manufacturing Base, Sales Area and Its Competitors
- 10.7.2 Probe Card Product Overview
- 10.7.3 Microfriend Probe Card Sales (K PIN), Revenue (US$ Million), Price (US$/PIN) and Gross Margin (%) (2018-2022)
- 10.7.4 Main Business/Business Overview
- 10.7.5 Microfriend Probe Card SWOT Analysis
- 10.8 Korea Instrument
- 10.8.1 Company Basic Information, Manufacturing Base, Sales Area and Its Competitors
- 10.8.2 Probe Card Product Overview
- 10.8.3 Korea Instrument Probe Card Sales (K PIN), Revenue (US$ Million), Price (US$/PIN) and Gross Margin (%) (2018-2022)
- 10.8.4 Main Business/Business Overview
- 10.8.5 Korea Instrument Probe Card SWOT Analysis
- 10.9 Will Technology
- 10.9.1 Company Basic Information, Manufacturing Base, Sales Area and Its Competitors
- 10.9.2 Probe Card Product Overview
- 10.9.3 Will Technology Probe Card Sales (K PIN), Revenue (US$ Million), Price (US$/PIN) and Gross Margin (%) (2018-2022)
- 10.9.4 Main Business/Business Overview
- 10.9.5 Will Technology Probe Card SWOT Analysis
- 10.10 TSE
- 10.10.1 Company Basic Information, Manufacturing Base, Sales Area and Its Competitors
- 10.10.2 Probe Card Product Overview
- 10.10.3 TSE Probe Card Sales (K PIN), Revenue (US$ Million), Price (US$/PIN) and Gross Margin (%) (2018-2022)
- 10.10.4 Main Business/Business Overview
- 10.10.5 TSE Probe Card SWOT Analysis
- 10.11 Feinmetall
- 10.11.1 Company Basic Information, Manufacturing Base, Sales Area and Its Competitors
- 10.11.2 Probe Card Product Overview
- 10.11.3 Feinmetall Probe Card Sales (K PIN), Revenue (US$ Million), Price (US$/PIN) and Gross Margin (%) (2018-2022)
- 10.11.4 Main Business/Business Overview
- 10.11.5 Feinmetall Probe Card SWOT Analysis
- 10.12 Synergie Cad Probe
- 10.12.1 Company Basic Information, Manufacturing Base, Sales Area and Its Competitors
- 10.12.2 Probe Card Product Overview
- 10.12.3 Synergie Cad Probe Probe Card Sales (K PIN), Revenue (US$ Million), Price (US$/PIN) and Gross Margin (%) (2018-2022)
- 10.12.4 Main Business/Business Overview
- 10.12.5 Synergie Cad Probe Probe Card SWOT Analysis
- 10.13 TIPS Messtechnik GmbH
- 10.13.1 Company Basic Information, Manufacturing Base, Sales Area and Its Competitors
- 10.13.2 Probe Card Product Overview
- 10.13.3 TIPS Messtechnik GmbH Probe Card Sales (K PIN), Revenue (US$ Million), Price (US$/PIN) and Gross Margin (%) (2018-2022)
- 10.13.4 Main Business/Business Overview
- 10.13.5 TIPS Messtechnik GmbH Probe Card SWOT Analysis
- 10.14 STAr Technologies, Inc.
- 10.14.1 Company Basic Information, Manufacturing Base, Sales Area and Its Competitors
- 10.14.2 Probe Card Product Overview
- 10.14.3 STAr Technologies, Inc. Probe Card Sales (K PIN), Revenue (US$ Million), Price (US$/PIN) and Gross Margin (%) (2018-2022)
- 10.14.4 Main Business/Business Overview
- 10.14.5 STAr Technologies, Inc. Probe Card SWOT Analysis
- 10.15 MaxOne
- 10.15.1 Company Basic Information, Manufacturing Base, Sales Area and Its Competitors
- 10.15.2 Probe Card Product Overview
- 10.15.3 MaxOne Probe Card Sales (K PIN), Revenue (US$ Million), Price (US$/PIN) and Gross Margin (%) (2018-2022)
- 10.15.4 Main Business/Business Overview
- 10.15.5 MaxOne Probe Card SWOT Analysis
- 10.16 Shenzhen DGT
- 10.16.1 Company Basic Information, Manufacturing Base, Sales Area and Its Competitors
- 10.16.2 Probe Card Product Overview
- 10.16.3 Shenzhen DGT Probe Card Sales (K PIN), Revenue (US$ Million), Price (US$/PIN) and Gross Margin (%) (2018-2022)
- 10.16.4 Main Business/Business Overview
- 10.16.5 Shenzhen DGT Probe Card SWOT Analysis
- 10.17 Suzhou Silicon Test System
- 10.17.1 Company Basic Information, Manufacturing Base, Sales Area and Its Competitors
- 10.17.2 Probe Card Product Overview
- 10.17.3 Suzhou Silicon Test System Probe Card Sales (K PIN), Revenue (US$ Million), Price (US$/PIN) and Gross Margin (%) (2018-2022)
- 10.17.4 Main Business/Business Overview
- 10.17.5 Suzhou Silicon Test System Probe Card SWOT Analysis
- 10.18 CHPT
- 10.18.1 Company Basic Information, Manufacturing Base, Sales Area and Its Competitors
- 10.18.2 Probe Card Product Overview
- 10.18.3 CHPT Probe Card Sales (K PIN), Revenue (US$ Million), Price (US$/PIN) and Gross Margin (%) (2018-2022)
- 10.18.4 Main Business/Business Overview
- 10.18.5 CHPT Probe Card SWOT Analysis
11 Upstream, Opportunities, Challenges, Risks and Influences Factors Analysis
- 11.1 Probe Card Key Raw Materials
- 11.1.1 Key Raw Materials
- 11.1.2 Raw Materials Key Suppliers
- 11.2 Manufacturing Cost Structure
- 11.2.1 Raw Materials
- 11.2.2 Labor Cost
- 11.2.3 Manufacturing Expenses
- 11.3 Probe Card Industrial Chain Analysis
- 11.4 Probe Card Market Dynamics
- 11.4.1 Probe Card Industry Trends
- 11.4.2 Probe Card Market Drivers
- 11.4.3 Probe Card Market Challenges
- 11.4.4 Porter's Five Forces Analysis
12 Marketing Strategy Analysis, Distributors
- 12.1 Sales Channel
- 12.2 Probe Card Distributors
- 12.3 Probe Card Downstream Customers
13 Research Findings and Conclusion
14 Appendix
- 14.1 Research Methodology
- 14.1.1 Methodology/Research Approach
- 14.1.2 Data Source
- 14.2 Author Details
- 14.3 Disclaimer