|
|
市場調査レポート
商品コード
1121184
自動車用電線・ケーブル材料の世界市場の考察、2028年までの予測Global Automotive Wires and Cable Materials Market Insights, Forecast to 2028 |
||||||
|
|
|||||||
|
● お客様のご希望に応じて、既存データの加工や未掲載情報(例:国別セグメント)の追加などの対応が可能です。 詳細はお問い合わせください。 |
|||||||


| 自動車用電線・ケーブル材料の世界市場の考察、2028年までの予測 |
|
出版日: 2022年09月01日
発行: QYResearch
ページ情報: 英文 145 Pages
納期: 2~3営業日
|
- 全表示
- 概要
- 図表
- 目次
市場の分析と洞察
世界の自動車用電線・ケーブル材料の市場規模は、2022年の200億9470万米ドルから、予測期間(2022年~2028年)にCAGR4.70%で推移し、2028年には264億6760万米ドルに達すると予測されています。
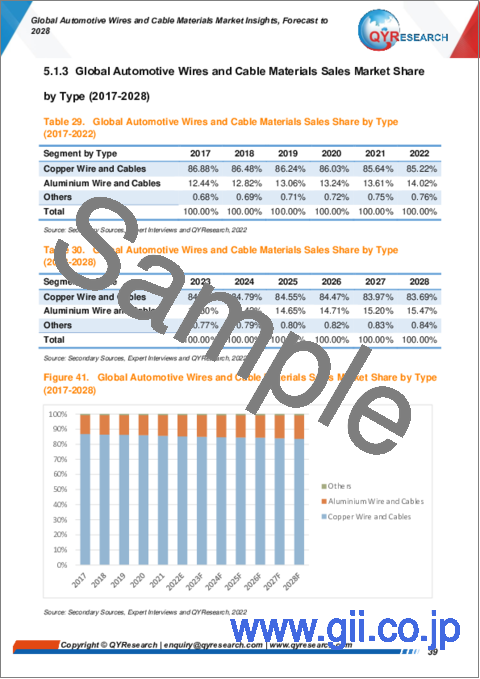
2021年、自動車用ワイヤー・ケーブル材料の世界市場において、銅線とケーブルは93.42%のシェアを占めています。そして、この製品セグメントは、2021年の176億3890万米ドルから2028年には244億4180万米ドルに達すると予測されています。一方、アルミニウム配線とSMC端子による潜在的な質量節約のニーズは、将来の自律走行車の商業化とその需要によってさらに高まります。
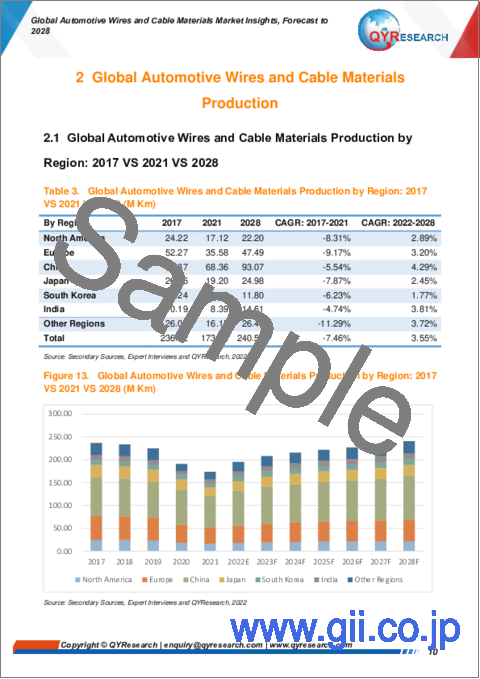
2021年の中国の自動車用電線・ケーブル材料市場規模は53億1,730万米ドル、欧州自動車用電線・ケーブル材は49億3,220万米ドル、米国は21億4,560万米ドルでした。2021年の中国の割合は28.16%、欧州と米国はそれぞれ26.12%と11.36%であり、2028年には中国の割合は30.20%に達すると予測され、分析期間中のCAGRは5.67%でした。アジアでは日本、韓国、インドが注目すべき市場であり、今後6年間のCAGRはそれぞれ5.35%、4.93%、6.10%と予測されます。欧州の自動車用電線・ケーブル材料の情勢としては、ドイツが2028年までに18億4620万米ドルに達すると予測され、予測期間中のCAGRは3.64%です。
自動車用電線・ケーブル材料の世界主要メーカーは、矢崎総業、住友電気工業、レオニ、コフィカブ、古河電工、フォースグループ、クロムベルグ&シューベルト、ドラクスルマイヤー、キョンシン、フジクーラ、ユーラコーポレーション、マザーソングループ、双飛自動電器などです。2021年の売上高では、世界のトップ企業5社が約31.31%のシェアを占めています。
生産面では、2017年から2022年まで、2028年までの自動車用電線・ケーブル材料の生産量、成長率、メーカー別市場シェア、地域別(地域レベル、国レベル)シェアを調査しています。
販売面では、2017年から2022年までと2028年までの自動車用電線・ケーブル材料の地域別(地域レベル、国レベル)、企業別、タイプ別、用途別の販売量を調査しています。
範囲とセグメント
自動車用電線・ケーブル材料市場は、タイプ別、用途別に区分されています。世界の自動車用電線・ケーブル材市場におけるプレイヤー、利害関係者、その他の参加者は、本レポートを強力な資料として利用することで、優位に立つことができるでしょう。セグメント別分析では、2017年から2028年までの生産能力、収益と予測をタイプ別、用途別に焦点を当てます。
目次
第1章 調査範囲
- 自動車用電線・ケーブル材料製品イントロダクション
- タイプ別:市場
- タイプ別:世界の市場規模(2017 VS 2021 VS 2028)
- 銅線・ケーブル
- アルミニウム電線・ケーブル
- その他電線・ケーブル
- 用途別:市場
- 用途別:世界の市場規模(2017 VS 2021 VS 2028)
- 乗用車
- 小型商用車
- 大型商用車
- 調査目的
- 考察年
第2章 世界の自動車用電線・ケーブル材料の生産
- 地域別:世界の生産(2017 VS 2021 VS 2028)
- 地域別:世界の生産
- 北米
- 欧州
- 中国
- 日本
- 韓国
- インド
第3章 世界の自動車用電線・ケーブル材料販売の推計・予測(数量・金額)
- 世界の販売推計・予測(2017-2028)
- 世界の収益推計・予測(2017-2028)
- 地域別:世界の収益(2017 VS 2021 VS 2028)
- 地域別:世界の販売
- 地域別:世界の収益
- 北米
- 欧州
- アジア太平洋
- ラテンアメリカ
- 中東とアフリカ
第4章 メーカー別:競争
- メーカー別:世界の販売
- メーカー別:世界の収益
- メーカー別:世界の販売価格(2019-2022)
- 競合情勢の分析
- 合併と買収、拡張計画
第5章 タイプ別:市場規模
- タイプ別:世界の販売実績
- タイプ別:世界の販売予測
- タイプ別:世界の販売市場シェア
第6章 用途別:市場規模
- 用途別:世界の販売実績
- 用途別:世界の販売予測
- 用途別:世界の販売市場シェア
第7章 北米
- タイプ別:市場規模
- 用途別:市場規模
- 国別:市場規模
- 国別:販売(2017-2028)
- 国別:収益(2017-2028)
- 米国
- カナダ
第8章 欧州
- タイプ別:市場規模
- 用途別:市場規模
- 国別:市場規模
- 国別:販売(2017-2028)
- 国別:収益(2017-2028)
- ドイツ
- フランス
- 英国
- イタリア
- ロシア
第9章 アジア太平洋
- タイプ別:市場規模
- 用途別:市場規模
- 地域別:市場規模
- 地域別:販売(2017-2028)
- 地域別:収益(2017-2028)
- 中国
- 日本
- 韓国
- インド
- 東南アジア
第10章 ラテンアメリカ
- タイプ別:市場規模
- 用途別:市場規模
- 国別:市場規模
- 国別:販売(2017-2028)
- 国別:収益(2017-2028)
- メキシコ
- ブラジル
第11章 中東とアフリカ
- タイプ別:市場規模
- 用途別:市場規模
- 国別:市場規模
- 国別:販売(2017-2028)
- 国別:収益(2017-2028)
- トルコ
- イラン
- 南アフリカ
第12章 企業プロファイル
- Yazaki Corporation
- Sumitomo Electric
- Leoni
- Coficab
- Furukawa Electric
- Force Group
- Kromberg &Schubert
- Draxlmaier
- Kyungshin
- Fujikura
- Yura Corporation
- Motherson Group
- Shuangfei Auto Electric Appliances
第13章 産業チェーンと販売チャネル分析
- 自動車用電線・ケーブル材料の産業チェーン分析
- 自動車用電線・ケーブル材料の主原料
- 自動車用電線・ケーブル材料の生産モードとプロセス
- 自動車用電線・ケーブル材料の販売およびマーケティング
- 自動車用電線・ケーブル材料の顧客
第14章 自動車用電線・ケーブル材料の市場力学
- 自動車用電線・ケーブル材料業界の動向
- 自動車用電線・ケーブル材料市場の促進要因
- 自動車用電線・ケーブル材料市場の課題
- 自動車用電線・ケーブル材料市場の抑制要因
第15章 世界の自動車用電線・ケーブル材料の主な調査結果
第16章 付録
LIST OF TABLES
- Table 1. Global Automotive Wires and Cable Materials Market Size Growth Rate by Type, 2017 VS 2021 VS 2028 (US$ Million)
- Table 2. Global Automotive Wires and Cable Materials Market Size Growth Rate by Application, 2017 VS 2021 VS 2028 (M Km)
- Table 3. Global Automotive Wires and Cable Materials Production by Region: 2017 VS 2021 VS 2028 (M Km)
- Table 4. Global Automotive Wires and Cable Materials Production by Region (2017-2022) & (M Km)
- Table 5. Global Automotive Wires and Cable Materials Production Market Share by Region (2017-2022)
- Table 6. Global Automotive Wires and Cable Materials Production by Region (2023-2028) & (M Km)
- Table 7. Global Automotive Wires and Cable Materials Production Market Share by Region (2023-2028)
- Table 8. Global Automotive Wires and Cable Materials Revenue by Region: 2017 VS 2021 VS 2028 (US$ Million)
- Table 9. Global Automotive Wires and Cable Materials Sales by Region (2017-2022) & (M Km)
- Table 10. Global Automotive Wires and Cable Materials Sales Market Share by Region (2017-2022)
- Table 11. Global Automotive Wires and Cable Materials Sales by Region (2023-2028) & (M Km)
- Table 12. Global Automotive Wires and Cable Materials Sales Market Share by Region (2023-2028)
- Table 13. Global Automotive Wires and Cable Materials Revenue by Region (2017-2022) & (US$ Million)
- Table 14. Global Automotive Wires and Cable Materials Revenue Market Share by Region (2017-2022)
- Table 15. Global Automotive Wires and Cable Materials Revenue by Region (2023-2028) & (US$ Million)
- Table 16. Global Automotive Wires and Cable Materials Revenue Market Share by Region (2023-2028)
- Table 17. Global Automotive Wires and Cable Materials Sales by Manufacturers (2019-2022) & (M Km)
- Table 18. Global Automotive Wires and Cable Materials Sales Share by Manufacturers (2019-2022)
- Table 19. Global Automotive Wires and Cable Materials Revenue by Manufacturers (2019-2022) & (US$ Million)
- Table 20. Global Automotive Wires and Cable Materials Revenue Market Share by Manufacturers (2019-2022)
- Table 21. Automotive Wires and Cable Materials Price by Manufacturers (2019-2022) & ($/Km)
- Table 22. Global Automotive Wires and Cable Materials Manufacturers Market Concentration Ratio (CR5)
- Table 23. Global Automotive Wires and Cable Materials by Company Type (Tier 1, Tier 2, and Tier 3) & (based on the Revenue in Automotive Wires and Cable Materials as of 2020)
- Table 24. Global Key Manufacturers Headquarter and Area Served
- Table 25. Date of Manufacturers Enter into Automotive Wires and Cable Materials Market
- Table 26. Mergers & Acquisitions, Expansion Plans
- Table 27. Global Automotive Wires and Cable Materials Sales by Type (2017-2022) & (M Km)
- Table 28. Global Automotive Wires and Cable Materials Sales by Type (2023-2028) & (M Km)
- Table 29. Global Automotive Wires and Cable Materials Sales Share by Type (2017-2022)
- Table 30. Global Automotive Wires and Cable Materials Sales Share by Type (2023-2028)
- Table 31. Global Automotive Wires and Cable Materials Revenue by Type (2017-2022) & (US$ Million)
- Table 32. Global Automotive Wires and Cable Materials Revenue by Type (2023-2028) & (US$ Million)
- Table 33. Global Automotive Wires and Cable Materials Revenue Share by Type (2017-2022)
- Table 34. Global Automotive Wires and Cable Materials Revenue Share by Type (2023-2028)
- Table 35. Automotive Wires and Cable Materials Price by Type (2017-2022) & ($/Km)
- Table 36. Global Automotive Wires and Cable Materials Price Forecast by Type (2023-2028) & ($/Km)
- Table 37. Global Automotive Wires and Cable Materials Sales by Application (2017-2022) & (M Km)
- Table 38. Global Automotive Wires and Cable Materials Sales by Application (2023-2028) & (M Km)
- Table 39. Global Automotive Wires and Cable Materials Sales Share by Application (2017-2022)
- Table 40. Global Automotive Wires and Cable Materials Sales Share by Application (2023-2028)
- Table 41. North America Automotive Wires and Cable Materials Sales by Type (2017-2022) & (M Km)
- Table 42. North America Automotive Wires and Cable Materials Sales by Type (2023-2028) & (M Km)
- Table 43. North America Automotive Wires and Cable Materials Sales by Application (2017-2022) & (M Km)
- Table 44. North America Automotive Wires and Cable Materials Sales by Application (2023-2028) & (M Km)
- Table 45. North America Automotive Wires and Cable Materials Sales by Country (2017-2022) & (M Km)
- Table 46. North America Automotive Wires and Cable Materials Sales by Country (2023-2028) & (M Km)
- Table 47. North America Automotive Wires and Cable Materials Revenue by Country (2017-2022) & (US$ Million)
- Table 48. North America Automotive Wires and Cable Materials Revenue by Country (2023-2028) & (US$ Million)
- Table 49. Europe Automotive Wires and Cable Materials Sales by Type (2017-2022) & (M Km)
- Table 50. Europe Automotive Wires and Cable Materials Sales by Type (2023-2028) & (M Km)
- Table 51. Europe Automotive Wires and Cable Materials Sales by Application (2017-2022) & (M Km)
- Table 52. Europe Automotive Wires and Cable Materials Sales by Application (2023-2028) & (M Km)
- Table 53. Europe Automotive Wires and Cable Materials Sales by Country (2017-2022) & (M Km)
- Table 54. Europe Automotive Wires and Cable Materials Sales by Country (2023-2028) & (M Km)
- Table 55. Europe Automotive Wires and Cable Materials Revenue by Country (2017-2022) & (US$ Million)
- Table 56. Europe Automotive Wires and Cable Materials Revenue by Country (2023-2028) & (US$ Million)
- Table 57. Asia Pacific Automotive Wires and Cable Materials Sales by Type (2017-2022) & (M Km)
- Table 58. Asia Pacific Automotive Wires and Cable Materials Sales by Type (2023-2028) & (M Km)
- Table 59. Asia Pacific Automotive Wires and Cable Materials Sales by Application (2017-2022) & (M Km)
- Table 60. Asia Pacific Automotive Wires and Cable Materials Sales by Application (2023-2028) & (M Km)
- Table 61. Asia Pacific Automotive Wires and Cable Materials Sales by Region (2017-2022) & (M Km)
- Table 62. Asia Pacific Automotive Wires and Cable Materials Sales by Region (2023-2028) & (M Km)
- Table 63. Asia Pacific Automotive Wires and Cable Materials Revenue by Region (2017-2022) & (US$ Million)
- Table 64. Asia Pacific Automotive Wires and Cable Materials Revenue by Region (2023-2028) & (US$ Million)
- Table 65. Latin America Automotive Wires and Cable Materials Sales by Type (2017-2022) & (M Km)
- Table 66. Latin America Automotive Wires and Cable Materials Sales by Type (2023-2028) & (M Km)
- Table 67. Latin America Automotive Wires and Cable Materials Sales by Application (2017-2022) & (M Km)
- Table 68. Latin America Automotive Wires and Cable Materials Sales by Application (2023-2028) & (M Km)
- Table 69. Latin America Automotive Wires and Cable Materials Sales by Country (2017-2022) & (M Km)
- Table 70. Latin America Automotive Wires and Cable Materials Sales by Country (2023-2028) & (M Km)
- Table 71. Latin America Automotive Wires and Cable Materials Revenue by Country (2017-2022) & (US$ Million)
- Table 72. Latin America Automotive Wires and Cable Materials Revenue by Country (2023-2028) & (US$ Million)
- Table 73. Middle East and Africa Automotive Wires and Cable Materials Sales by Type (2017-2022) & (M Km)
- Table 74. Middle East and Africa Automotive Wires and Cable Materials Sales by Type (2023-2028) & (M Km)
- Table 75. Middle East and Africa Automotive Wires and Cable Materials Sales by Application (2017-2022) & (M Km)
- Table 76. Middle East and Africa Automotive Wires and Cable Materials Sales by Application (2023-2028) & (M Km)
- Table 77. Middle East and Africa Automotive Wires and Cable Materials Sales by Country (2017-2022) & (M Km)
- Table 78. Middle East and Africa Automotive Wires and Cable Materials Sales by Country (2023-2028) & (M Km)
- Table 79. Middle East and Africa Automotive Wires and Cable Materials Revenue by Country (2017-2022) & (US$ Million)
- Table 80. Middle East and Africa Automotive Wires and Cable Materials Revenue by Country (2023-2028) & (US$ Million)
- Table 81. Yazaki Corporation Corporation Information
- Table 82. Yazaki Corporation Description and Major Businesses
- Table 83. Yazaki Corporation Automotive Wires and Cable Materials Sales (M Km), Revenue (US$ Million), Price ($/Km) and Gross Margin (2019-2022)
- Table 84. Yazaki Corporation Recent Developments
- Table 85. Sumitomo Electric Corporation Information
- Table 86. Sumitomo Electric Description and Major Businesses
- Table 87. Sumitomo Electric Automotive Wires and Cable Materials Sales (M Km), Revenue (US$ Million), Price ($/Km) and Gross Margin (2019-2022)
- Table 88. Sumitomo Electric Recent Developments
- Table 89. Leoni Corporation Information
- Table 90. Leoni Description and Major Businesses
- Table 91. Leoni Automotive Wires and Cable Materials Sales (M Km), Revenue (US$ Million), Price ($/Km) and Gross Margin (2019-2022)
- Table 92. Leoni Recent Developments
- Table 93. Coficab Corporation Information
- Table 94. Coficab Description and Major Businesses
- Table 95. Coficab Automotive Wires and Cable Materials Sales (M Km), Revenue (US$ Million), Price ($/Km) and Gross Margin (2019-2022)
- Table 96. Furukawa Electric Corporation Information
- Table 97. Furukawa Electric Description and Major Businesses
- Table 98. Furukawa Electric Automotive Wires and Cable Materials Sales (M Km), Revenue (US$ Million), Price ($/Km) and Gross Margin (2019-2022)
- Table 99. Furukawa Electric Recent Developments
- Table 100. Force Group Corporation Information
- Table 101. Force Group Description and Major Businesses
- Table 102. Force Group Automotive Wires and Cable Materials Sales (M Km), Revenue (US$ Million), Price ($/Km) and Gross Margin (2019-2022)
- Table 103. Kromberg & Schubert Corporation Information
- Table 104. Kromberg & Schubert Description and Major Businesses
- Table 105. Kromberg & Schubert Automotive Wires and Cable Materials Sales (M Km), Revenue (US$ Million), Price ($/Km) and Gross Margin (2019-2022)
- Table 106. Dräxlmaier Corporation Information
- Table 107. Dräxlmaier Description and Major Businesses
- Table 108. Dräxlmaier Automotive Wires and Cable Materials Sales (M Km), Revenue (US$ Million), Price ($/Km) and Gross Margin (2019-2022)
- Table 109. Kyungshin Corporation Information
- Table 110. Kyungshin Description and Major Businesses
- Table 111. Kyungshin Automotive Wires and Cable Materials Sales (M Km), Revenue (US$ Million), Price ($/Km) and Gross Margin (2019-2022)
- Table 112. Fujikura Corporation Information
- Table 113. Fujikura Description and Major Businesses
- Table 114. Fujikura Automotive Wires and Cable Materials Sales (M Km), Revenue (US$ Million), Price ($/Km) and Gross Margin (2019-2022)
- Table 115. Yura Corporation Corporation Information
- Table 116. Yura Corporation Description and Major Businesses
- Table 117. Yura Corporation Automotive Wires and Cable Materials Sales (M Km), Revenue (US$ Million), Price ($/Km) and Gross Margin (2019-2022)
- Table 118. Motherson Group Corporation Information
- Table 119. Motherson Group Description and Major Businesses
- Table 120. Motherson Group Automotive Wires and Cable Materials Sales (M Km), Revenue (US$ Million), Price ($/Km) and Gross Margin (2019-2022)
- Table 121. Shuangfei Auto Electric Appliances Corporation Information
- Table 122. Shuangfei Auto Electric Appliances Description and Major Businesses
- Table 123. Shuangfei Auto Electric Appliances Automotive Wires and Cable Materials Sales (M Km), Revenue (US$ Million), Price ($/Km) and Gross Margin (2019-2022)
- Table 124. Raw Materials Key Suppliers Lists
- Table 125. Automotive Wires and Cable Materials Distributors List
- Table 126. Automotive Wires and Cable Materials Customers List
- Table 127. Automotive Wires and Cable Materials Market Trends
- Table 128. Automotive Wires and Cable Materials Market Drivers
- Table 129. Automotive Wires and Cable Materials Market Challenges
- Table 130. Automotive Wires and Cable Materials Market Restraints
- Table 131. Research Programs/Design for This Report
- Table 132. Key Data Information from Secondary Sources
- Table 133. Key Data Information from Primary Sources
List of Figures
- Figure 1. Automotive Wires and Cable Materials Product Picture
- Figure 2. Global Automotive Wires and Cable Materials Market Size Growth Rate by Type, 2017 VS 2021 VS 2028 (US$ Million)
- Figure 3. Global Automotive Wires and Cable Materials Market Share by Type: 2021 & 2028
- Figure 4. Copper Wire and Cables Product Picture
- Figure 5. Aluminium Wire and Cables Product Picture
- Figure 6. Others Wire and Cables Product Picture
- Figure 7. Global Automotive Wires and Cable Materials Market Size Growth Rate by Application, 2017 VS 2021 VS 2028 (M Km)
- Figure 8. Global Automotive Wires and Cable Materials Market Share by Application in 2021 & 2028
- Figure 9. Passenger Vehicles
- Figure 10. Light Commercial Vehicles
- Figure 11. Heavy Commercial Vehicles
- Figure 12. Automotive Wires and Cable Materials Report Years Considered
- Figure 13. Global Automotive Wires and Cable Materials Production by Region: 2017 VS 2021 VS 2028 (M Km)
- Figure 14. Global Automotive Wires and Cable Materials Production Market Share by Region in Percentage: 2021 Versus 2028
- Figure 15. Global Automotive Wires and Cable Materials Production Market Share by Region (2017-2022)
- Figure 16. Global Automotive Wires and Cable Materials Production Market Share by Region (2023-2028)
- Figure 17. Automotive Wires and Cable Materials Production Growth Rate in North America (2017-2028) & (M Km)
- Figure 18. Automotive Wires and Cable Materials Production Growth Rate in Europe (2017-2028) & (M Km)
- Figure 19. Automotive Wires and Cable Materials Production Growth Rate in China (2017-2028) & (M Km)
- Figure 20. Automotive Wires and Cable Materials Production Growth Rate in Japan (2017-2028) & (M Km)
- Figure 21. Automotive Wires and Cable Materials Production Growth Rate in South Korea (2017-2028) & (M Km)
- Figure 22. Automotive Wires and Cable Materials Production Growth Rate in India (2017-2028) & (M Km)
- Figure 23. Global Automotive Wires and Cable Materials Sales 2017-2028 (M Km)
- Figure 24. Global Automotive Wires and Cable Materials Revenue, (US$ Million), 2017 VS 2021 VS 2028
- Figure 25. Global Automotive Wires and Cable Materials Revenue 2017-2028
- Figure 26. Global Automotive Wires and Cable Materials Revenue Market Share by Region in Percentage: 2021 Versus 2028
- Figure 27. Global Automotive Wires and Cable Materials Sales Market Share by Region (2017-2022)
- Figure 28. Global Automotive Wires and Cable Materials Sales Market Share by Region (2023-2028)
- Figure 29. North America Automotive Wires and Cable Materials Sales YoY (2017-2028) & (M Km)
- Figure 30. North America Automotive Wires and Cable Materials Revenue YoY (2017-2028) & (US$ Million)
- Figure 31. Europe Automotive Wires and Cable Materials Sales YoY (2017-2028) & (M Km)
- Figure 32. Europe Automotive Wires and Cable Materials Revenue YoY (2017-2028) & (US$ Million)
- Figure 33. Asia Pacific Automotive Wires and Cable Materials Sales YoY (2017-2028) & (M Km)
- Figure 34. Asia Pacific Automotive Wires and Cable Materials Revenue YoY (2017-2028) & (US$ Million)
- Figure 35. Latin America Automotive Wires and Cable Materials Sales YoY (2017-2028) & (M Km)
- Figure 36. Latin America Automotive Wires and Cable Materials Revenue YoY (2017-2028) & (US$ Million)
- Figure 37. Middle East & Africa Automotive Wires and Cable Materials Sales YoY (2017-2028) & (M Km)
- Figure 38. Middle East & Africa Automotive Wires and Cable Materials Revenue YoY (2017-2028) & (US$ Million)
- Figure 39. Global Automotive Wires and Cable Materials Sales Share by Manufacturers in 2021
- Figure 40. Global Automotive Wires and Cable Materials Revenue Share by Manufacturers in 2021
- Figure 41. Global Automotive Wires and Cable Materials Sales Market Share by Type (2017-2028)
- Figure 42. Global Automotive Wires and Cable Materials Revenue Market Share by Type (2017-2028)
- Figure 43. Global Automotive Wires and Cable Materials Sales Market Share by Application (2017-2028)
- Figure 44. North America Automotive Wires and Cable Materials Sales Market Share by Type (2017-2028)
- Figure 45. North America Automotive Wires and Cable Materials Sales Market Share by Application (2017-2028)
- Figure 46. North America Automotive Wires and Cable Materials Sales Share by Country (2017-2028)
- Figure 47. North America Automotive Wires and Cable Materials Revenue Share by Country (2017-2028)
- Figure 48. United States Automotive Wires and Cable Materials Revenue (2017-2028) & (US$ Million)
- Figure 49. Canada Automotive Wires and Cable Materials Revenue (2017-2028) & (US$ Million)
- Figure 50. Europe Automotive Wires and Cable Materials Sales Market Share by Type (2017-2028)
- Figure 51. Europe Automotive Wires and Cable Materials Sales Market Share by Application (2017-2028)
- Figure 52. Europe Automotive Wires and Cable Materials Sales Share by Country (2017-2028)
- Figure 53. Europe Automotive Wires and Cable Materials Revenue Share by Country (2017-2028)
- Figure 54. Germany Automotive Wires and Cable Materials Revenue (2017-2028) & (US$ Million)
- Figure 55. France Automotive Wires and Cable Materials Revenue (2017-2028) & (US$ Million)
- Figure 56. U.K. Automotive Wires and Cable Materials Revenue (2017-2028) & (US$ Million)
- Figure 57. Italy Automotive Wires and Cable Materials Revenue (2017-2028) & (US$ Million)
- Figure 58. Russia Automotive Wires and Cable Materials Revenue (2017-2028) & (US$ Million)
- Figure 59. Asia Pacific Automotive Wires and Cable Materials Sales Market Share by Type (2017-2028)
- Figure 60. Asia Pacific Automotive Wires and Cable Materials Sales Market Share by Application (2017-2028)
- Figure 61. Asia Pacific Automotive Wires and Cable Materials Sales Share by Region (2017-2028)
- Figure 62. Asia Pacific Automotive Wires and Cable Materials Revenue Share by Region (2017-2028)
- Figure 63. China Automotive Wires and Cable Materials Revenue (2017-2028) & (US$ Million)
- Figure 64. Japan Automotive Wires and Cable Materials Revenue (2017-2028) & (US$ Million)
- Figure 65. South Korea Automotive Wires and Cable Materials Revenue (2017-2028) & (US$ Million)
- Figure 66. India Automotive Wires and Cable Materials Revenue (2017-2028) & (US$ Million)
- Figure 67. Southeast Asia Automotive Wires and Cable Materials Revenue (2017-2028) & (US$ Million)
- Figure 68. Latin America Automotive Wires and Cable Materials Sales Market Share by Type (2017-2028)
- Figure 69. Latin America Automotive Wires and Cable Materials Sales Market Share by Application (2017-2028)
- Figure 70. Latin America Automotive Wires and Cable Materials Sales Share by Country (2017-2028)
- Figure 71. Latin America Automotive Wires and Cable Materials Revenue Share by Country (2017-2028)
- Figure 72. Mexico Automotive Wires and Cable Materials Revenue (2017-2028) & (US$ Million)
- Figure 73. Brazil Automotive Wires and Cable Materials Revenue (2017-2028) & (US$ Million)
- Figure 74. Middle East and Africa Automotive Wires and Cable Materials Sales Market Share by Type (2017-2028)
- Figure 75. Middle East and Africa Automotive Wires and Cable Materials Sales Market Share by Application (2017-2028)
- Figure 76. Middle East and Africa Automotive Wires and Cable Materials Sales Share by Country (2017-2028)
- Figure 77. Middle East and Africa Automotive Wires and Cable Materials Revenue Share by Country (2017-2028)
- Figure 78. Turkey Automotive Wires and Cable Materials Revenue (2017-2028) & (US$ Million)
- Figure 79. Iran Automotive Wires and Cable Materials Revenue (2017-2028) & (US$ Million)
- Figure 80. South Africa Automotive Wires and Cable Materials Revenue (2017-2028) & (US$ Million)
- Figure 81. Yazaki Corporation Automotive Wires and Cable Materials Product
- Figure 82. Sumitomo Electric Automotive Wires and Cable Materials Product
- Figure 83. Leoni Automotive Wires and Cable Materials Product
- Figure 84. Coficab Automotive Wires and Cable Materials Product
- Figure 85. Furukawa Electric Automotive Wires and Cable Materials Product
- Figure 86. Force Group Automotive Wires and Cable Materials Product
- Figure 87. Kromberg & Schubert Automotive Wires and Cable Materials Product
- Figure 88. Dräxlmaier Automotive Wires and Cable Materials Product
- Figure 89. Kyungshin Automotive Wires and Cable Materials Product
- Figure 90. Fujikura Automotive Wires and Cable Materials Product
- Figure 91. Yura Corporation Automotive Wires and Cable Materials Product
- Figure 92. Motherson Group Automotive Wires and Cable Materials Product
- Figure 93. Shuangfei Auto Electric Appliances Automotive Wires and Cable Materials Product
- Figure 94. Automotive Wires and Cable Materials Value Chain
- Figure 95. Copper Price trend (2017-2022)
- Figure 96. Aluminum Price trend (2017-2022)
- Figure 97. Automotive Wires and Cable Production Process
- Figure 98. Distributors Profiles
- Figure 99. Bottom-up and Top-down Approaches for This Report
- Figure 100. Data Triangulation
- Figure 101. Key Executives Interviewed 123
Market Analysis and Insights:
Due to the COVID-19 pandemic, the global automotive wires and cable materials market size is estimated to be worth US$ 20,094.7 million in 2022 and is forecast to a readjusted size of US$ 26,467.6 million by 2028 with a CAGR of 4.70% during the forecast period 2022-2028.
n 2021, Copper Wire and Cables accounted for a share of 93.42% in the global automotive wires and cable materials market. And this product segment is poised to reach US$ 24,441.8 million by 2028 from US$ 17,638.9 million in 2021. While The need for potential mass savings from aluminium wiring and SMC terminals increases even more with the future commercialization of autonomous vehicles and their demands.
China automotive wires and cable materials market size was US$ 5,317.3 million in 2021, while the Europe and US automotive wires and cable materials were US$ 4,932.2 million and US$ 2,145.6 million, severally. The proportion of the China was 28.16% in 2021, while Europe and US are 26.12% and 11.36% respectively, and it is predicted that China proportion will reach 30.20% in 2028, trailing a CAGR of 5.67 % through the analysis period. Japan, South Korea, and India are noteworthy markets in Asia, with CAGR 5.35%, 4.93%, and 6.10 % respectively for the next 6-year period. As for the Europe automotive wires and cable materials landscape, Germany is projected to reach US$ 1,846.2 million by 2028 trailing a CAGR of 3.64 % over the forecast period.
The global key manufacturers of automotive wires and cable materials include Yazaki Corporation, Sumitomo Electric, Leoni, Coficab, Furukawa Electric, Force Group, Kromberg & Schubert, Draxlmaier, Kyungshin, Fujikura, Yura Corporation, Motherson Group, Shuangfei Auto Electric Appliances, etc. In 2021, the global top five players hold a share approximately 31.31% in terms of revenue.
In terms of production side, this report researches the automotive wires and cable materials production, growth rate, market share by manufacturers and by region (region level and country level), from 2017 to 2022, and forecast to 2028.
In terms of sales side, this report focuses on the sales of automotive wires and cable materials by region (region level and country level), by company, by Type and by Application. from 2017 to 2022 and forecast to 2028.
Scope and Segment:
Automotive wires and cable materials market is segmented by Type, and by Application. Players, stakeholders, and other participants in the global Automotive Wires and Cable Materials market will be able to gain the upper hand as they use the report as a powerful resource. The segmental analysis focuses on production capacity, revenue and forecast by Type, and by Application for the period 2017-2028.
By Company
- Yazaki Corporation
- Sumitomo Electric
- Leoni
- Coficab
- Furukawa Electric
- Force Group
- Kromberg & Schubert
- Draxlmaier
- Kyungshin
- Fujikura
- Yura Corporation
- Motherson Group
- Shuangfei Auto Electric Appliances
Segment by Type
- Copper Wire and Cables
- Aluminium Wire and Cables
- Others
Segment by Application
- Passenger Vehicles
- Light Commercial Vehicles
- Heavy Commercial Vehicles
Production by Region
- North America
- Europe
- China
- Japan
- South Korea
- India
Sales by Region
- North America
- United States
- Canada
- Asia Pacific
- China
- Japan
- South Korea
- India
- Southeast Asia
- Europe
- Germany
- France
- U.K.
- Italy
- Russia
- Latin America
- Mexico
- Brazil
- Middle East & Africa
- Turkey
- Iran
- South Africa
TABLE OF CONTENTS
1 Study Coverage
- 1.1 Automotive Wires and Cable Materials Product Introduction
- 1.2 Market by Type
- 1.2.1 Global Automotive Wires and Cable Materials Market Size by Type, 2017 VS 2021 VS 2028
- 1.2.2 Copper Wire and Cables
- 1.2.3 Aluminium Wire and Cables
- 1.2.4 Others Wire and Cables
- 1.3 Market by Application
- 1.3.1 Global Automotive Wires and Cable Materials Market Size by Application, 2017 VS 2021 VS 2028
- 1.3.2 Passenger Vehicles
- 1.3.3 Light Commercial Vehicles
- 1.3.4 Heavy Commercial Vehicles
- 1.4 Study Objectives
- 1.5 Years Considered
2 Global Automotive Wires and Cable Materials Production
- 2.1 Global Automotive Wires and Cable Materials Production by Region: 2017 VS 2021 VS 2028
- 2.2 Global Automotive Wires and Cable Materials Production by Region
- 2.2.1 Global Automotive Wires and Cable Materials Historic Production by Region (2017-2022)
- 2.2.2 Global Automotive Wires and Cable Materials Forecasted Production by Region (2023-2028)
- 2.3 North America
- 2.4 Europe
- 2.5 China
- 2.6 Japan
- 2.7 South Korea
- 2.8 India
3 Global Automotive Wires and Cable Materials Sales in Volume & Value Estimates and Forecasts
- 3.1 Global Automotive Wires and Cable Materials Sales Estimates and Forecasts 2017-2028
- 3.2 Global Automotive Wires and Cable Materials Revenue Estimates and Forecasts 2017-2028
- 3.3 Global Automotive Wires and Cable Materials Revenue by Region: 2017 VS 2021 VS 2028
- 3.4 Global Automotive Wires and Cable Materials Sales by Region
- 3.4.1 Global Automotive Wires and Cable Materials Sales by Region (2017-2022)
- 3.4.2 Global Sales Automotive Wires and Cable Materials by Region (2023-2028)
- 3.5 Global Automotive Wires and Cable Materials Revenue by Region
- 3.5.1 Global Automotive Wires and Cable Materials Revenue by Region (2017-2022)
- 3.5.2 Global Automotive Wires and Cable Materials Revenue by Region (2023-2028)
- 3.6 North America
- 3.7 Europe
- 3.8 Asia Pacific
- 3.9 Latin America
- 3.10 Middle East & Africa
4 Competition by Manufacturers
- 4.1 Global Automotive Wires and Cable Materials Sales by Manufacturers
- 4.1.1 Global Automotive Wires and Cable Materials Sales by Manufacturers (2019-2022)
- 4.1.2 Global Automotive Wires and Cable Materials Sales Market Share by Manufacturers (2019-2022)
- 4.2 Global Automotive Wires and Cable Materials Revenue by Manufacturers
- 4.2.1 Global Automotive Wires and Cable Materials Revenue by Manufacturers (2019-2022)
- 4.2.2 Global Automotive Wires and Cable Materials Revenue Market Share by Manufacturers (2019-2022)
- 4.3 Global Automotive Wires and Cable Materials Sales Price by Manufacturers (2019-2022)
- 4.4 Analysis of Competitive Landscape
- 4.4.1 Manufacturers Market Concentration Ratio (CR5)
- 4.4.2 Global Automotive Wires and Cable Materials Market Share by Company Type (Tier 1, Tier 2, and Tier 3)
- 4.4.3 Global Key Manufacturers Headquarter and Area Served
- 4.5 Mergers & Acquisitions, Expansion Plans
5 Market Size by Type
- 5.1 Global Automotive Wires and Cable Materials Sales by Type
- 5.1.1 Global Automotive Wires and Cable Materials Historical Sales by Type (2017-2022)
- 5.1.2 Global Automotive Wires and Cable Materials Forecasted Sales by Type (2023-2028)
- 5.1.3 Global Automotive Wires and Cable Materials Sales Market Share by Type (2017-2028)
- 5.2 Global Automotive Wires and Cable Materials Revenue by Type
- 5.2.1 Global Automotive Wires and Cable Materials Historical Revenue by Type (2017-2022)
- 5.2.2 Global Automotive Wires and Cable Materials Forecasted Revenue by Type (2023-2028)
- 5.2.3 Global Automotive Wires and Cable Materials Revenue Market Share by Type (2017-2028)
- 5.3 Global Automotive Wires and Cable Materials Price by Type
- 5.3.1 Global Automotive Wires and Cable Materials Price by Type (2017-2022)
- 5.3.2 Global Automotive Wires and Cable Materials Price Forecast by Type (2023-2028)
6 Market Size by Application
- 6.1 Global Automotive Wires and Cable Materials Historical Sales by Application
- 6.2 Global Automotive Wires and Cable Materials Forecasted Sales by Application
- 6.3 Global Automotive Wires and Cable Materials Sales Market Share by Application
7 North America
- 7.1 North America Automotive Wires and Cable Materials Market Size by Type
- 7.2 North America Automotive Wires and Cable Materials Market Size by Application
- 7.3 North America Automotive Wires and Cable Materials Sales by Country
- 7.3.1 North America Automotive Wires and Cable Materials Sales by Country (2017-2028)
- 7.3.2 North America Automotive Wires and Cable Materials Revenue by Country (2017-2028)
- 7.3.3 United States
- 7.3.4 Canada
8 Europe
- 8.1 Europe Automotive Wires and Cable Materials Market Size by Type
- 8.2 Europe Automotive Wires and Cable Materials Market Size by Application
- 8.3 Europe Automotive Wires and Cable Materials Market Size by Country
- 8.3.1 Europe Automotive Wires and Cable Materials Sales by Country (2017-2028)
- 8.3.2 Europe Automotive Wires and Cable Materials Revenue by Country (2017-2028)
- 8.3.3 Germany
- 8.3.4 France
- 8.3.5 U.K.
- 8.3.6 Italy
- 8.3.7 Russia
9 Asia Pacific
- 9.1 Asia Pacific Automotive Wires and Cable Materials Market Size by Type
- 9.2 Asia Pacific Automotive Wires and Cable Materials Market Size by Application
- 9.3 Asia Pacific Automotive Wires and Cable Materials Market Size by Region
- 9.3.1 Asia Pacific Automotive Wires and Cable Materials Sales by Region (2017-2028)
- 9.3.2 Asia Pacific Automotive Wires and Cable Materials Revenue by Region (2017-2028)
- 9.3.3 China
- 9.3.4 Japan
- 9.3.5 South Korea
- 9.3.6 India
- 9.3.7 Southeast Asia
10 Latin America
- 10.1 Latin America Automotive Wires and Cable Materials Market Size by Type
- 10.2 Latin America Automotive Wires and Cable Materials Market Size by Application
- 10.3 Latin America Automotive Wires and Cable Materials Market Size by Country
- 10.3.1 Latin America Automotive Wires and Cable Materials Sales by Country (2017-2028)
- 10.3.2 Latin America Automotive Wires and Cable Materials Revenue by Country (2017-2028)
- 10.3.3 Mexico
- 10.3.4 Brazil
11 Middle East and Africa
- 11.1 Middle East and Africa Automotive Wires and Cable Materials Market Size by Type
- 11.2 Middle East and Africa Automotive Wires and Cable Materials Market Size by Application
- 11.3 Middle East and Africa Automotive Wires and Cable Materials Market Size by Country
- 11.3.1 Middle East and Africa Automotive Wires and Cable Materials Sales by Country (2017-2028)
- 11.3.2 Middle East and Africa Automotive Wires and Cable Materials Revenue by Country (2017-2028)
- 11.3.3 Turkey
- 11.3.4 Iran
- 11.3.5 South Africa
12 Corporate Profile
- 12.1 Yazaki Corporation
- 12.1.1 Yazaki Corporation Corporation Information
- 12.1.2 Yazaki Corporation Overview
- 12.1.3 Yazaki Corporation Automotive Wires and Cable Materials Product
- 12.1.4 Yazaki Corporation Automotive Wires and Cable Materials Sales, Price, Revenue and Gross Margin (2019-2022)
- 12.1.5 Yazaki Corporation Recent Developments
- 12.2 Sumitomo Electric
- 12.2.1 Sumitomo Electric Corporation Information
- 12.2.2 Sumitomo Electric Overview
- 12.2.3 Sumitomo Electric Automotive Wires and Cable Materials Product
- 12.2.4 Sumitomo Electric Automotive Wires and Cable Materials Sales, Price, Revenue and Gross Margin (2019-2022)
- 12.2.5 Sumitomo Electric Recent Developments
- 12.3 Leoni
- 12.3.1 Leoni Corporation Information
- 12.3.2 Leoni Overview
- 12.3.3 Leoni Automotive Wires and Cable Materials Product
- 12.3.4 Leoni Automotive Wires and Cable Materials Sales, Price, Revenue and Gross Margin (2019-2022)
- 12.3.5 Leoni Recent Developments
- 12.4 Coficab
- 12.4.1 Coficab Corporation Information
- 12.4.2 Coficab Overview
- 12.4.3 Coficab Automotive Wires and Cable Materials Product
- 12.4.4 Coficab Automotive Wires and Cable Materials Sales, Price, Revenue and Gross Margin (2019-2022)
- 12.5 Furukawa Electric
- 12.5.1 Furukawa Electric Corporation Information
- 12.5.2 Furukawa Electric Overview
- 12.5.3 Furukawa Electric Automotive Wires and Cable Materials Product
- 12.5.4 Furukawa Electric Automotive Wires and Cable Materials Sales, Price, Revenue and Gross Margin (2019-2022)
- 12.5.5 Furukawa Electric Recent Developments
- 12.6 Force Group
- 12.6.1 Force Group Corporation Information
- 12.6.2 Force Group Overview
- 12.6.3 Force Group Automotive Wires and Cable Materials Product
- 12.6.4 Force Group Automotive Wires and Cable Materials Sales, Price, Revenue and Gross Margin (2019-2022)
- 12.7 Kromberg & Schubert
- 12.7.1 Kromberg & Schubert Corporation Information
- 12.7.2 Kromberg & Schubert Overview
- 12.7.3 Kromberg & Schubert Automotive Wires and Cable Materials Product
- 12.7.4 Kromberg & Schubert Automotive Wires and Cable Materials Sales, Price, Revenue and Gross Margin (2019-2022)
- 12.8 Draxlmaier
- 12.8.1 Draxlmaier Corporation Information
- 12.8.2 Draxlmaier Overview
- 12.8.3 Draxlmaier Automotive Wires and Cable Materials Product
- 12.8.4 Draxlmaier Automotive Wires and Cable Materials Sales, Price, Revenue and Gross Margin (2019-2022)
- 12.9 Kyungshin
- 12.9.1 Kyungshin Corporation Information
- 12.9.2 Kyungshin Overview
- 12.9.3 Kyungshin Automotive Wires and Cable Materials Product
- 12.9.4 Kyungshin Automotive Wires and Cable Materials Sales, Price, Revenue and Gross Margin (2019-2022)
- 12.10 Fujikura
- 12.10.1 Fujikura Corporation Information
- 12.10.2 Fujikura Overview
- 12.10.3 Fujikura Automotive Wires and Cable Materials Product
- 12.10.4 Fujikura Automotive Wires and Cable Materials Sales, Price, Revenue and Gross Margin (2019-2022)
- 12.11 Yura Corporation
- 12.11.1 Yura Corporation Corporation Information
- 12.11.2 Yura Corporation Overview
- 12.11.3 Yura Corporation Automotive Wires and Cable Materials Product
- 12.11.4 Yura Corporation Automotive Wires and Cable Materials Sales, Price, Revenue and Gross Margin (2019-2022)
- 12.12 Motherson Group
- 12.12.1 Motherson Group Corporation Information
- 12.12.2 Motherson Group Overview
- 12.12.3 Motherson Group Automotive Wires and Cable Materials Product
- 12.12.4 Motherson Group Automotive Wires and Cable Materials Sales, Price, Revenue and Gross Margin (2019-2022)
- 12.13 Shuangfei Auto Electric Appliances
- 12.13.1 Shuangfei Auto Electric Appliances Corporation Information
- 12.13.2 Shuangfei Auto Electric Appliances Overview
- 12.13.3 Shuangfei Auto Electric Appliances Automotive Wires and Cable Materials Product
- 12.13.4 Shuangfei Auto Electric Appliances Automotive Wires and Cable Materials Sales, Price, Revenue and Gross Margin (2019-2022)
13 Industry Chain and Sales Channels Analysis
- 13.1 Automotive Wires and Cable Materials Industry Chain Analysis
- 13.2 Automotive Wires and Cable Materials Key Raw Materials
- 13.2.1 Key Raw Materials
- 13.2.2 Raw Materials Key Suppliers
- 13.3 Automotive Wires and Cable Production Mode & Process
- 13.4 Automotive Wires and Cable Materials Sales and Marketing
- 13.4.1 Automotive Wires and Cable Materials Distributors
- 13.5 Automotive Wires and Cable Materials Customers
14 Automotive Wires and Cable Materials Market Dynamics
- 14.1.1 Automotive Wires and Cable Materials Industry Trends
- 14.1.2 Automotive Wires and Cable Materials Market Drivers
- 14.1.3 Automotive Wires and Cable Materials Market Challenges
- 14.1.4 Automotive Wires and Cable Materials Market Restraints
15 Key Findings in the Global Automotive Wires and Cable Materials Study
16 Appendix
- 16.1 Research Methodology
- 16.1.1 Methodology/Research Approach
- 16.1.2 Data Source
- 16.2 Author Details
- 16.3 Disclaimer