|
|
市場調査レポート
商品コード
1119806
熱可塑性ガラス繊維強化プラスチックの世界市場、実績と予測(2017年~2028年)Global Thermoplastic Glass Fiber Reinforced Plastics Market Report, History and Forecast 2017-2028 - Customized Version |
||||||
|
|
|||||||
|
● お客様のご希望に応じて、既存データの加工や未掲載情報(例:国別セグメント)の追加などの対応が可能です。 詳細はお問い合わせください。 |
|||||||


| 熱可塑性ガラス繊維強化プラスチックの世界市場、実績と予測(2017年~2028年) |
|
出版日: 2022年08月26日
発行: QYResearch
ページ情報: 英文 170 Pages
納期: 2~3営業日
|
- 全表示
- 概要
- 図表
- 目次
市場の分析と洞察
COVID-19の大流行により、世界の熱可塑性ガラス繊維強化プラスチックの市場規模は、2021年に43億9346万米ドルとなり、予測期間(2022年~2028年)にCAGR4.97%で推移し、2028年には63億597万米ドルに達すると予測されています。
熱可塑性ガラス繊維強化プラスチックの世界の主要メーカーは、BASF、Evonik、SABIC、DSM、Rhodia、Lanxess、Avient、Xenia Materials、Johns Manvilleなどです。
北米の熱可塑性ガラス繊維強化プラスチックの市場規模は2021年に8億6296万米ドルで、中国は約8億3849万米ドルでした。中国の割合は2021年に19.08%で、2028年には21.63%に達すると予測され、分析期間を通じてCAGR 8.45 %で推移しています。
範囲と市場規模
熱可塑性ガラス繊維強化プラスチックの世界市場は、地域(国)別、企業別、ガラス繊維別、下流産業別に分類されています。熱可塑性ガラス繊維強化プラスチックの世界市場におけるプレイヤー、利害関係者、その他の参加者は、このレポートを強力な資料として利用することで、優位に立つことができるでしょう。セグメント別分析では、2017年から2028年までの地域(国)別、ガラス繊維別、下流産業別の売上、収益と予測に焦点を当てています。
目次
第1章 熱可塑性ガラス繊維強化プラスチック市場概要
- 熱可塑性ガラス繊維強化プラスチック製品概要
- ガラス繊維別:熱可塑性ガラス繊維強化プラスチック市場セグメント
- ガラスマット強化
- 繊維強化
- 一方向性(UD)繊維強化
- ガラス繊維別:世界の熱可塑性ガラス繊維強化プラスチック市場規模
- ガラス繊維別:主要地域の市場規模セグメント
第2章 企業別:熱可塑性ガラス繊維強化プラスチック市場競争
- 販売別:世界の主要企業(2017-2022)
- 収益別:世界の主要企業(2017-2022)
- 価格別:世界の主要企業(2017-2022)
- 世界の主要メーカーの製造拠点分布、販売エリア、製品タイプ
- 市場の競争状況と動向
- 企業タイプ(Tier 1、Tier 2、およびTier 3)別:世界の主要メーカー(2021年時点の収益に基づく)
- 主要メーカーの市場参入日
- 主要メーカー提供製品
- 合併と買収、拡張
第3章 地域別:熱可塑性ガラス繊維強化プラスチックの現状と展望
- 地域別:世界の市場規模とCAGR(2017 VS 2021 VS 2028)
- 地域別:世界の市場規模実績
- 地域別:世界の市場規模予測
第4章 下流産業別:熱可塑性ガラス繊維強化プラスチック
- 下流産業別:熱可塑性ガラス繊維強化プラスチック市場セグメント
- 航空宇宙と自動車
- エレクトロ・エレクトロニクス
- 建設
- 日常使用
- 下流産業別:世界の熱可塑性ガラス繊維強化プラスチック市場規模
- 下流産業別:主要地域の市場規模セグメント
第5章 北米の国別熱可塑性ガラス繊維強化プラスチック
- 国別:市場規模実績
- 国別:市場規模予測
第6章 欧州の国別熱可塑性ガラス繊維強化プラスチック
- 国別:市場規模実績
- 国別:市場規模予測
第7章 アジア太平洋の地域別熱可塑性ガラス繊維強化プラスチック
- 国別:市場規模実績
- 国別:市場規模予測
第8章 ラテンアメリカの国別熱可塑性ガラス繊維強化プラスチック
- 国別:市場規模実績
- 国別:市場規模予測
第9章 中東・アフリカの国別熱可塑性ガラス繊維強化プラスチック
- 国別:市場規模実績
- 国別:市場規模予測
第10章 熱可塑性ガラス繊維強化プラスチック事業の企業プロファイルとの主要データ
- BASF
- Evonik
- SABIC
- DSM
- Lanxess
- Avient
- Xenia Materials
- SGL Carbon
- RTP Company
- Toray
- Celanese
- Solvay
- Covestro
- Teijin
- US Liner
- DuPont
- Alformet
- CompLam Material
第11章 上流部門、機会、課題、リスク、および影響の要因分析
- 熱可塑性ガラス繊維強化プラスチックの主原料
- 製造コスト構造
- 熱可塑性ガラス繊維強化プラスチック産業チェーン分析
- 熱可塑性ガラス繊維強化プラスチック市場力学
- 市場促進要因
- 市場の課題
- 市場抑制要因
第12章 マーケティング戦略分析、ディストリビューター
- 販売チャンネル
- ディストリビューター
- 下流部門の顧客
第13章 用途別:熱可塑性ガラス繊維強化プラスチック用マトリックス樹脂
- 用途別:熱可塑性ガラス繊維強化プラスチック用マトリックス樹脂市場セグメント
- 高温熱可塑性樹脂
- エンジニアリング熱可塑性樹脂
- 用途別:熱可塑性ガラス繊維強化プラスチック用マトリックス樹脂の市場規模
第14章 分野別:熱可塑性ガラス繊維強化プラスチック用マトリックス樹脂
- 分野別:熱可塑性ガラス繊維強化プラスチック用マトリックス市場セグメント
- 航空宇宙
- 自動車
- エレクトロニクス
- 構造
- 医療
- 分野別:世界の熱可塑性ガラス繊維強化プラスチック用マトリックス樹脂の市場規模
第15章 調査結果と結論
第16章 付録
LIST OF TABLES
- Table 1. Global Thermoplastic Glass Fiber Reinforced Plastics Sales by Glass Fibers: 2017 VS 2021 VS 2028 (US$ Million)
- Table 2. Global Thermoplastic Glass Fiber Reinforced Plastics Sales by Glass Fibers (2017-2022) & (MT)
- Table 3. Global Thermoplastic Glass Fiber Reinforced Plastics Sales Market Share in Volume by Glass Fibers (2017-2022)
- Table 4. Global Thermoplastic Glass Fiber Reinforced Plastics Sales by Glass Fibers (2017-2022) & (US$ Million)
- Table 5. Global Thermoplastic Glass Fiber Reinforced Plastics Sales Market Share in Value by Glass Fibers (2017-2022)
- Table 6. Global Thermoplastic Glass Fiber Reinforced Plastics Price by Glass Fibers (2017-2022) & (US$/MT)
- Table 7. Global Thermoplastic Glass Fiber Reinforced Plastics Sales by Glass Fibers (2023-2028) & (MT)
- Table 8. Global Thermoplastic Glass Fiber Reinforced Plastics Sales Market Share in Volume by Glass Fibers (2023-2028)
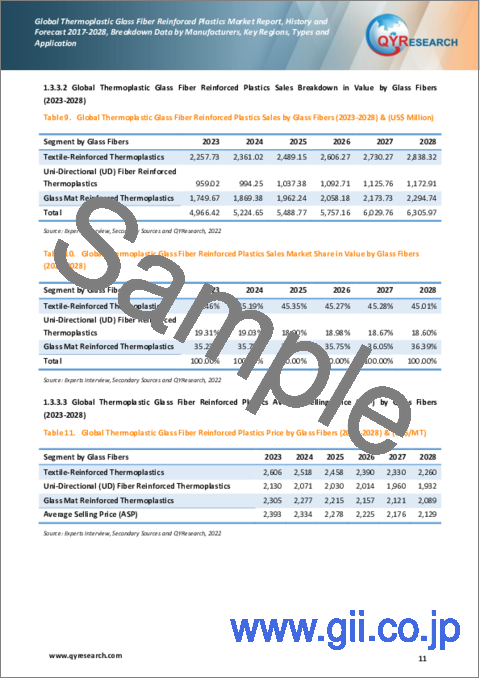
- Table 9. Global Thermoplastic Glass Fiber Reinforced Plastics Sales by Glass Fibers (2023-2028) & (US$ Million)
- Table 10. Global Thermoplastic Glass Fiber Reinforced Plastics Sales Market Share in Value by Glass Fibers (2023-2028)
- Table 11. Global Thermoplastic Glass Fiber Reinforced Plastics Price by Glass Fibers (2023-2028) & (US$/MT)
- Table 12. North America Thermoplastic Glass Fiber Reinforced Plastics Sales by Glass Fibers (2017-2022) & (MT)
- Table 13. North America Thermoplastic Glass Fiber Reinforced Plastics Sales by Glass Fibers (2017-2022) & (US$ Million)
- Table 14. Europe Thermoplastic Glass Fiber Reinforced Plastics Sales (MT) by Glass Fibers (2017-2022)
- Table 15. Europe Thermoplastic Glass Fiber Reinforced Plastics Sales by Glass Fibers (2017-2022) & (US$ Million)
- Table 16. Asia-Pacific Thermoplastic Glass Fiber Reinforced Plastics Sales (MT) by Glass Fibers (2017-2022)
- Table 17. Asia-Pacific Thermoplastic Glass Fiber Reinforced Plastics Sales by Glass Fibers (2017-2022) & (US$ Million)
- Table 18. Latin America Thermoplastic Glass Fiber Reinforced Plastics Sales (MT) by Glass Fibers (2017-2022)
- Table 19. Latin America Thermoplastic Glass Fiber Reinforced Plastics Sales by Glass Fibers (2017-2022) & (US$ Million)
- Table 20. Middle East and Africa Thermoplastic Glass Fiber Reinforced Plastics Sales (MT) by Glass Fibers (2017-2022)
- Table 21. Middle East and Africa Thermoplastic Glass Fiber Reinforced Plastics Sales by Glass Fibers (2017-2022) & (US$ Million)
- Table 22. Global Thermoplastic Glass Fiber Reinforced Plastics Sales by Company (2017-2022) & (MT)
- Table 23. Global Thermoplastic Glass Fiber Reinforced Plastics Sales Share by Company (2017-2022)
- Table 24. Global Thermoplastic Glass Fiber Reinforced Plastics Revenue by Company (2017-2022) & (US$ Million)
- Table 25. Global Thermoplastic Glass Fiber Reinforced Plastics Revenue Share by Company (2017-2022)
- Table 26. Global Market Thermoplastic Glass Fiber Reinforced Plastics Price by Company (2017-2022) & (US$/MT)
- Table 27. Global Thermoplastic Glass Fiber Reinforced Plastics Top Manufacturers Manufacturing Base Distribution and Sales Area
- Table 28. Global Thermoplastic Glass Fiber Reinforced Plastics Manufacturers Market Concentration Ratio (CR5)
- Table 29. Global Top Manufacturers Market Share by Company Type (Tier 1, Tier 2, and Tier 3) & (based on the Revenue in Thermoplastic Glass Fiber Reinforced Plastics as of 2021)
- Table 30. Date of Key Manufacturers Enter into Thermoplastic Glass Fiber Reinforced Plastics Market
- Table 31. Key Manufacturers Thermoplastic Glass Fiber Reinforced Plastics Product
- Table 32. Mergers & Acquisitions, Expansion Plans
- Table 33. Global Thermoplastic Glass Fiber Reinforced Plastics Market Size Comparison by Region (US$ Million): 2017 VS 2021 VS 2028
- Table 34. Global Thermoplastic Glass Fiber Reinforced Plastics Sales by Region (2017-2022) & (MT)
- Table 35. Global Thermoplastic Glass Fiber Reinforced Plastics Sales Market Share in Volume by Region (2017-2022)
- Table 36. Global Thermoplastic Glass Fiber Reinforced Plastics Sales by Region (2017-2022) & (US$ Million)
- Table 37. Global Thermoplastic Glass Fiber Reinforced Plastics Sales Market Share in Value by Region (2017-2022)
- Table 38. Global Thermoplastic Glass Fiber Reinforced Plastics Sales (MT), Value (US$ Million), Price (US$/MT) and Gross Margin (2017-2022)
- Table 39. Global Thermoplastic Glass Fiber Reinforced Plastics Sales by Region (2023-2028) & (MT)
- Table 40. Global Thermoplastic Glass Fiber Reinforced Plastics Sales Market Share in Volume by Region (2023-2028)
- Table 41. Global Thermoplastic Glass Fiber Reinforced Plastics Sales by Region (2023-2028) & (US$ Million)
- Table 42. Global Thermoplastic Glass Fiber Reinforced Plastics Sales Market Share in Value by Region (2023-2028)
- Table 43. Global Thermoplastic Glass Fiber Reinforced Plastics Sales (MT), Value (US$ Million), Price (US$/MT) and Gross Margin (2023-2028)
- Table 44. Global Thermoplastic Glass Fiber Reinforced Plastics Sales by Downstream Industry: 2017 VS 2021 VS 2028 (US$ Million)
- Table 45. Global Thermoplastic Glass Fiber Reinforced Plastics Sales by Downstream Industry (2017-2022) & (MT)
- Table 46. Global Thermoplastic Glass Fiber Reinforced Plastics Sales Market Share in Volume by Downstream Industry (2017-2022)
- Table 47. Global Thermoplastic Glass Fiber Reinforced Plastics Sales by Downstream Industry (2017-2022) & (US$ Million)
- Table 48. Global Thermoplastic Glass Fiber Reinforced Plastics Sales Market Share in Value by Downstream Industry (2017-2022)
- Table 49. Global Thermoplastic Glass Fiber Reinforced Plastics Price by Downstream Industry (2017-2022) & (US$/MT)
- Table 50. Global Thermoplastic Glass Fiber Reinforced Plastics Sales by Downstream Industry (2023-2028) & (MT)
- Table 51. Global Thermoplastic Glass Fiber Reinforced Plastics Sales Market Share in Volume by Downstream Industry (2023-2028)
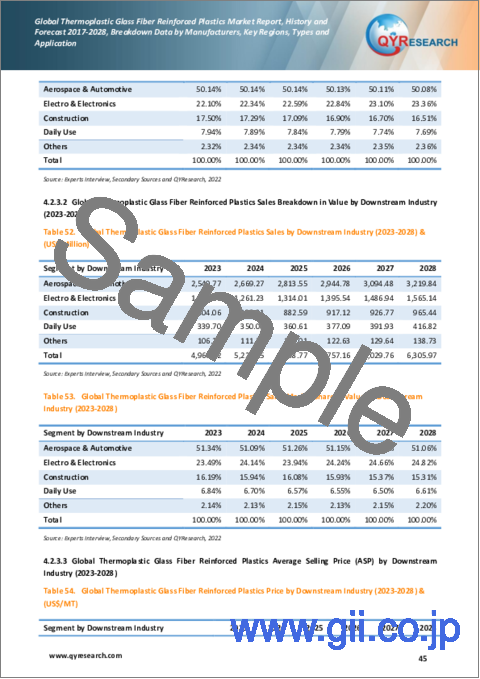
- Table 52. Global Thermoplastic Glass Fiber Reinforced Plastics Sales by Downstream Industry (2023-2028) & (US$ Million)
- Table 53. Global Thermoplastic Glass Fiber Reinforced Plastics Sales Market Share in Value by Downstream Industry (2023-2028)
- Table 54. Global Thermoplastic Glass Fiber Reinforced Plastics Price by Downstream Industry (2023-2028) & (US$/MT)
- Table 55. North America Thermoplastic Glass Fiber Reinforced Plastics Sales by Downstream Industry (2017-2022) & (MT)
- Table 56. North America Thermoplastic Glass Fiber Reinforced Plastics Sales by Downstream Industry (2017-2022) & (US$ Million)
- Table 57. Europe Thermoplastic Glass Fiber Reinforced Plastics Sales (MT) by Downstream Industry (2017-2022)
- Table 58. Europe Thermoplastic Glass Fiber Reinforced Plastics Sales by Downstream Industry (2017-2022) & (US$ Million)
- Table 59. Asia-Pacific Thermoplastic Glass Fiber Reinforced Plastics Sales (MT) by Downstream Industry (2017-2022)
- Table 60. Asia-Pacific Thermoplastic Glass Fiber Reinforced Plastics Sales by Downstream Industry (2017-2022) & (US$ Million)
- Table 61. Latin America Thermoplastic Glass Fiber Reinforced Plastics Sales (MT) by Downstream Industry (2017-2022)
- Table 62. Latin America Thermoplastic Glass Fiber Reinforced Plastics Sales by Downstream Industry (2017-2022) & (US$ Million)
- Table 63. Middle East and Africa Thermoplastic Glass Fiber Reinforced Plastics Sales (MT) by Downstream Industry (2017-2022)
- Table 64. Middle East and Africa Thermoplastic Glass Fiber Reinforced Plastics Sales by Downstream Industry (2017-2022) & (US$ Million)
- Table 65. North America Thermoplastic Glass Fiber Reinforced Plastics Sales by Country (2017-2022) & (MT)
- Table 66. North America Thermoplastic Glass Fiber Reinforced Plastics Sales Market Share in Volume by Country (2017-2022)
- Table 67. North America Thermoplastic Glass Fiber Reinforced Plastics Sales by Country (2017-2022) & (US$ Million)
- Table 68. North America Thermoplastic Glass Fiber Reinforced Plastics Sales Market Share in Value by Country (2017-2022)
- Table 69. North America Thermoplastic Glass Fiber Reinforced Plastics Sales by Country (2023-2028) & (MT)
- Table 70. North America Thermoplastic Glass Fiber Reinforced Plastics Sales Market Share in Volume by Country (2023-2028)
- Table 71. North America Thermoplastic Glass Fiber Reinforced Plastics Sales by Country (2023-2028) & (US$ Million)
- Table 72. North America Thermoplastic Glass Fiber Reinforced Plastics Sales Market Share in Value by Country (2023-2028)
- Table 73. Europe Thermoplastic Glass Fiber Reinforced Plastics Sales by Country (2017-2022) & (MT)
- Table 74. Europe Thermoplastic Glass Fiber Reinforced Plastics Sales Market Share in Volume by Country (2017-2022)
- Table 75. Europe Thermoplastic Glass Fiber Reinforced Plastics Sales by Country (2017-2022) & (US$ Million)
- Table 76. Europe Thermoplastic Glass Fiber Reinforced Plastics Sales Market Share in Value by Country (2017-2022)
- Table 77. Europe Thermoplastic Glass Fiber Reinforced Plastics Sales by Country (2023-2028) & (MT)
- Table 78. Europe Thermoplastic Glass Fiber Reinforced Plastics Sales Market Share in Volume by Country (2023-2028)
- Table 79. Europe Thermoplastic Glass Fiber Reinforced Plastics Sales by Country (2023-2028) & (US$ Million)
- Table 80. Europe Thermoplastic Glass Fiber Reinforced Plastics Sales Market Share in Value by Country (2023-2028)
- Table 81. Asia-Pacific Thermoplastic Glass Fiber Reinforced Plastics Sales by Region (2017-2022) & (MT)
- Table 82. Asia-Pacific Thermoplastic Glass Fiber Reinforced Plastics Sales Market Share in Volumeby Region (2017-2022)
- Table 83. Asia-Pacific Thermoplastic Glass Fiber Reinforced Plastics Sales by Region (2017-2022) & (US$ Million)
- Table 84. Asia-Pacific Thermoplastic Glass Fiber Reinforced Plastics Sales Market Share in Value by Region (2017-2022)
- Table 85. Asia-Pacific Thermoplastic Glass Fiber Reinforced Plastics Sales by Region (2023-2028) & (MT)
- Table 86. Asia-Pacific Thermoplastic Glass Fiber Reinforced Plastics Sales Market Share in Volume by Region (2023-2028)
- Table 87. Asia-Pacific Thermoplastic Glass Fiber Reinforced Plastics Sales by Region (2023-2028) & (US$ Million)
- Table 88. Asia-Pacific Thermoplastic Glass Fiber Reinforced Plastics Sales Market Share in Value by Region (2023-2028)
- Table 89. Latin America Thermoplastic Glass Fiber Reinforced Plastics Sales by Country (2017-2022) & (MT)
- Table 90. Latin America Thermoplastic Glass Fiber Reinforced Plastics Sales Market Share in Volume by Country (2017-2022)
- Table 91. Latin America Thermoplastic Glass Fiber Reinforced Plastics Sales by Country (2017-2022) & (US$ Million)
- Table 92. Latin America Thermoplastic Glass Fiber Reinforced Plastics Sales Market Share in Value by Country (2017-2022)
- Table 93. Latin America Thermoplastic Glass Fiber Reinforced Plastics Sales by Country (2023-2028) & (MT)
- Table 94. Latin America Thermoplastic Glass Fiber Reinforced Plastics Sales Market Share in Volume by Country (2023-2028)
- Table 95. Latin America Thermoplastic Glass Fiber Reinforced Plastics Sales by Country (2023-2028) & (US$ Million)
- Table 96. Latin America Thermoplastic Glass Fiber Reinforced Plastics Sales Market Share in Value by Country (2023-2028)
- Table 97. Middle East and Africa Thermoplastic Glass Fiber Reinforced Plastics Sales by Country (2017-2022) & (MT)
- Table 98. Middle East and Africa Thermoplastic Glass Fiber Reinforced Plastics Sales Market Share in Volume by Country (2017-2022)
- Table 99. Middle East and Africa Thermoplastic Glass Fiber Reinforced Plastics Sales by Country (2017-2022) & (US$ Million)
- Table 100. Middle East and Africa Thermoplastic Glass Fiber Reinforced Plastics Sales Market Share in Value by Country (2017-2022)
- Table 101. Middle East and Africa Thermoplastic Glass Fiber Reinforced Plastics Sales by Country (2023-2028) & (MT)
- Table 102. Middle East and Africa Thermoplastic Glass Fiber Reinforced Plastics Sales Market Share by Country (2023-2028)
- Table 103. Middle East and Africa Thermoplastic Glass Fiber Reinforced Plastics Sales by Country (2023-2028) & (US$ Million)
- Table 104. Middle East and Africa Thermoplastic Glass Fiber Reinforced Plastics Sales Market Share in Value by Country (2023-2028)
- Table 105. BASF Corporation Information
- Table 106. BASF Thermoplastic Glass Fiber Reinforced Plastics Sales (MT), Revenue (US$ Million), Price (US$/MT) and Gross Margin (2017-2022)
- Table 107. BASF Thermoplastic Glass Fiber Reinforced Plastics Product
- Table 108. BASF Recent Development
- Table 109. Evonik Corporation Information
- Table 110. Evonik Thermoplastic Glass Fiber Reinforced Plastics Sales (MT), Revenue (US$ Million), Price (US$/MT) and Gross Margin (2017-2022)
- Table 111. Evonik Thermoplastic Glass Fiber Reinforced Plastics Product
- Table 112. SABIC Corporation Information
- Table 113. SABIC Thermoplastic Glass Fiber Reinforced Plastics Sales (MT), Revenue (US$ Million), Price (US$/MT) and Gross Margin (2017-2022)
- Table 114. SABIC Thermoplastic Glass Fiber Reinforced Plastics Product
- Table 115. DSM Corporation Information
- Table 116. DSM Thermoplastic Glass Fiber Reinforced Plastics Sales (MT), Revenue (US$ Million), Price (US$/MT) and Gross Margin (2017-2022)
- Table 117. DSM Thermoplastic Glass Fiber Reinforced Plastics Product
- Table 118. Lanxess Corporation Information
- Table 119. Lanxess Thermoplastic Glass Fiber Reinforced Plastics Sales (MT), Revenue (US$ Million), Price (US$/MT) and Gross Margin (2017-2022)
- Table 120. Lanxess Thermoplastic Glass Fiber Reinforced Plastics Product
- Table 121. Lanxess Recent Development
- Table 122. Avient Corporation Information
- Table 123. Avient Thermoplastic Glass Fiber Reinforced Plastics Sales (MT), Revenue (US$ Million), Price (US$/MT) and Gross Margin (2017-2022)
- Table 124. Avient Thermoplastic Glass Fiber Reinforced Plastics Product
- Table 125. Xenia Materials Corporation Information
- Table 126. Xenia Materials Thermoplastic Glass Fiber Reinforced Plastics Sales (MT), Revenue (US$ Million), Price (US$/MT) and Gross Margin (2017-2022)
- Table 127. Xenia Materials Thermoplastic Glass Fiber Reinforced Plastics Product
- Table 128. SGL Carbon Corporation Information
- Table 129. SGL Carbon Thermoplastic Glass Fiber Reinforced Plastics Sales (MT), Revenue (US$ Million), Price (US$/MT) and Gross Margin (2017-2022)
- Table 130. SGL Carbon Thermoplastic Glass Fiber Reinforced Plastics Product
- Table 131. RTP Company Corporation Information
- Table 132. RTP Company Thermoplastic Glass Fiber Reinforced Plastics Sales (MT), Revenue (US$ Million), Price (US$/MT) and Gross Margin (2017-2022)
- Table 133. RTP Company Thermoplastic Glass Fiber Reinforced Plastics Product
- Table 134. Toray Corporation Information
- Table 135. Toray Thermoplastic Glass Fiber Reinforced Plastics Sales (MT), Revenue (US$ Million), Price (US$/MT) and Gross Margin (2017-2022)
- Table 136. Toray Thermoplastic Glass Fiber Reinforced Plastics Product
- Table 137. Toray Recent Development
- Table 138. Celanese Corporation Information
- Table 139. Celanese Thermoplastic Glass Fiber Reinforced Plastics Sales (MT), Revenue (US$ Million), Price (US$/MT) and Gross Margin (2017-2022)
- Table 140. Celanese Thermoplastic Glass Fiber Reinforced Plastics Product
- Table 141. Solvay Corporation Information
- Table 142. Solvay Thermoplastic Glass Fiber Reinforced Plastics Sales (MT), Revenue (US$ Million), Price (US$/MT) and Gross Margin (2017-2022)
- Table 143. Solvay Thermoplastic Glass Fiber Reinforced Plastics Product
- Table 144. Covestro Corporation Information
- Table 145. Covestro Thermoplastic Glass Fiber Reinforced Plastics Sales (MT), Revenue (US$ Million), Price (US$/MT) and Gross Margin (2017-2022)
- Table 146. Covestro Thermoplastic Glass Fiber Reinforced Plastics Product
- Table 147. Teijin Corporation Information
- Table 148. Teijin Thermoplastic Glass Fiber Reinforced Plastics Sales (MT), Revenue (US$ Million), Price (US$/MT) and Gross Margin (2017-2022)
- Table 149. Teijin Thermoplastic Glass Fiber Reinforced Plastics Product
- Table 150. US Liner Corporation Information
- Table 151. US Liner Thermoplastic Glass Fiber Reinforced Plastics Sales (MT), Revenue (US$ Million), Price (US$/MT) and Gross Margin (2017-2022)
- Table 152. US Liner Thermoplastic Glass Fiber Reinforced Plastics Product
- Table 153. DuPont Corporation Information
- Table 154. DuPont Thermoplastic Glass Fiber Reinforced Plastics Sales (MT), Revenue (US$ Million), Price (US$/MT) and Gross Margin (2017-2022)
- Table 155. DuPont Thermoplastic Glass Fiber Reinforced Plastics Product
- Table 156. Alformet Corporation Information
- Table 157. Alformet Thermoplastic Glass Fiber Reinforced Plastics Sales (MT), Revenue (US$ Million), Price (US$/MT) and Gross Margin (2017-2022)
- Table 158. Alformet Thermoplastic Glass Fiber Reinforced Plastics Product
- Table 159. CompLam Material Corporation Information
- Table 160. CompLam Material Thermoplastic Glass Fiber Reinforced Plastics Sales (MT), Revenue (US$ Million), Price (US$/MT) and Gross Margin (2017-2022)
- Table 161. CompLam Material Thermoplastic Glass Fiber Reinforced Plastics Product
- Table 162. Raw Materials Key Suppliers Lists
- Table 163. Thermoplastic Glass Fiber Reinforced Plastics Market Drivers
- Table 164. Thermoplastic Glass Fiber Reinforced Plastics Market Challenges
- Table 165. Thermoplastic Glass Fiber Reinforced Plastics Market Restraints
- Table 166. Thermoplastic Glass Fiber Reinforced Plastics Distributors List
- Table 167. Thermoplastic Glass Fiber Reinforced Plastics Downstream Customers
- Table 168. Global Matrix Resins for Thermoplastic Glass Fiber Reinforced Plastics Sales by Application: 2017 VS 2021 VS 2028 (US$ Billion)
- Table 169. Global Matrix Resins for Thermoplastic Glass Fiber Reinforced Plastics Sales by Application (2017-2022) & (K MT)
- Table 170. Global Matrix Resins for Thermoplastic Glass Fiber Reinforced Plastics Sales Market Share in Volume by Application (2017-2022)
- Table 171. Global Matrix Resins for Thermoplastic Glass Fiber Reinforced Plastics Sales by Application (2017-2022) & (US$ Billion)
- Table 172. Global Matrix Resins for Thermoplastic Glass Fiber Reinforced Plastics Sales Market Share in Value by Application (2017-2022)
- Table 173. Global Matrix Resins for Thermoplastic Glass Fiber Reinforced Plastics Price by Application (2017-2022) & (US$/MT)
- Table 174. Global Matrix Resins for Thermoplastic Glass Fiber Reinforced Plastics Sales by Application (2023-2028) & (K MT)
- Table 175. Global Matrix Resins for Thermoplastic Glass Fiber Reinforced Plastics Sales Market Share in Volume by Application (2023-2028)
- Table 176. Global Matrix Resins for Thermoplastic Glass Fiber Reinforced Plastics Sales by Application (2023-2028) & (US$ Billion)
- Table 177. Global Matrix Resins for Thermoplastic Glass Fiber Reinforced Plastics Sales Market Share in Value by Application (2023-2028)
- Table 178. Global Matrix Resins for Thermoplastic Glass Fiber Reinforced Plastics Price by Application (2023-2028) & (US$/MT)
- Table 179. Global Matrix Resins for Thermoplastic Glass Fiber Reinforced Plastics Sales by Fields: 2017 VS 2021 VS 2028 (US$ Million)
- Table 180. Global Matrix Resins for Thermoplastic Glass Fiber Reinforced Plastics Sales by Fields (2017-2022) & (K MT)
- Table 181. Global Matrix Resins for Thermoplastic Glass Fiber Reinforced Plastics Sales Market Share in Volume by Fields (2017-2022)
- Table 182. Global Matrix Resins for Thermoplastic Glass Fiber Reinforced Plastics Sales by Fields (2017-2022) & (US$ Billion)
- Table 183. Global Matrix Resins for Thermoplastic Glass Fiber Reinforced Plastics Sales Market Share in Value by Fields (2017-2022)
- Table 184. Global Matrix Resins for Thermoplastic Glass Fiber Reinforced Plastics Price by Fields (2017-2022) & (US$/MT)
- Table 185. Global Matrix Resins for Thermoplastic Glass Fiber Reinforced Plastics Sales by Fields (2023-2028) & (K MT)
- Table 186. Global Matrix Resins for Thermoplastic Glass Fiber Reinforced Plastics Sales Market Share in Volume by Fields (2023-2028)
- Table 187. Global Matrix Resins for Thermoplastic Glass Fiber Reinforced Plastics Sales by Fields (2023-2028) & (US$ Billion)
- Table 188. Global Matrix Resins for Thermoplastic Glass Fiber Reinforced Plastics Sales Market Share in Value by Fields (2023-2028)
- Table 189. Global Matrix Resins for Thermoplastic Glass Fiber Reinforced Plastics Price by Fields (2023-2028) & (US$/MT)
- Table 190. Research Programs/Design for This Report
- Table 191. Key Data Information from Secondary Sources
- Table 192. Key Data Information from Primary Sources
List of Figures
- Figure 1. Thermoplastic Glass Fiber Reinforced Plastics Product Picture
- Figure 2. Global Thermoplastic Glass Fiber Reinforced Plastics Market Size, 2017 VS 2021 VS 2028 (US$ Million)
- Figure 3. Global Thermoplastic Glass Fiber Reinforced Plastics Market Size Status and Outlook (2017-2028) & (US$ Million)
- Figure 4. Global Thermoplastic Glass Fiber Reinforced Plastics Sales Status and Outlook (2017-2028) & (MT)
- Figure 5. Global Glass Mat Reinforced Thermoplastics Sales YoY Growth (2017-2028) & (MT)
- Figure 6. Global Textile-Reinforced Thermoplastics Sales YoY Growth (2017-2028) & (MT)
- Figure 7. Global Uni-Directional (UD) Fiber Reinforced Thermoplastics Sales YoY Growth (2017-2028) & (MT)
- Figure 8. Global Thermoplastic Glass Fiber Reinforced Plastics Sales by Glass Fibers (2017-2028) & (US$ Million)
- Figure 9. Global Thermoplastic Glass Fiber Reinforced Plastics Market Share by Glass Fibers in 2021 & 2028
- Figure 10. North America Thermoplastic Glass Fiber Reinforced Plastics Sales Market Share in Volume by Glass Fibers in 2021
- Figure 11. North America Thermoplastic Glass Fiber Reinforced Plastics Sales Market Share in Value by Glass Fibers in 2021
- Figure 12. Europe Thermoplastic Glass Fiber Reinforced Plastics Sales Market Share in Volume by Glass Fibers in 2021
- Figure 13. Europe Thermoplastic Glass Fiber Reinforced Plastics Sales Market Share in Value by Glass Fibers in 2021
- Figure 14. Asia-Pacific Thermoplastic Glass Fiber Reinforced Plastics Sales Market Share in Volume by Glass Fibers in 2021
- Figure 15. Asia-Pacific Thermoplastic Glass Fiber Reinforced Plastics Sales Market Share in Value by Glass Fibers in 2021
- Figure 16. Latin America Thermoplastic Glass Fiber Reinforced Plastics Sales Market Share in Volume by Glass Fibers in 2021
- Figure 17. Latin America Thermoplastic Glass Fiber Reinforced Plastics Sales Market Share in Value by Glass Fibers in 2021
- Figure 18. Middle East and Africa Thermoplastic Glass Fiber Reinforced Plastics Sales Market Share in Volume by Glass Fibers in 2021
- Figure 19. Middle East and Africa Thermoplastic Glass Fiber Reinforced Plastics Sales Market Share in Value by Glass Fibers in 2021
- Figure 20. The 3 and 5 Largest Manufacturers in the World: Market Share by Thermoplastic Glass Fiber Reinforced Plastics Sales in 2021
- Figure 21. The 3 and 5 Largest Manufacturers in the World: Market Share by Thermoplastic Glass Fiber Reinforced Plastics Revenue in 2021
- Figure 22. Product Picture of Aerospace & Automotive
- Figure 23. Global Aerospace & Automotive Sales YoY Growth (2017-2028) & (MT)
- Figure 24. Product Picture of Electro & Electronics
- Figure 25. Global Electro & Electronics Sales YoY Growth (2017-2028) & (MT)
- Figure 26. Product Picture of Construction
- Figure 27. Global Construction Sales YoY Growth (2017-2028) & (MT)
- Figure 28. Product Picture of Daily Use
- Figure 29. Global Daily Use Sales YoY Growth (2017-2028) & (MT)
- Figure 30. Global Thermoplastic Glass Fiber Reinforced Plastics Sales by Downstream Industry (2017-2028) & (US$ Million)
- Figure 31. Global Thermoplastic Glass Fiber Reinforced Plastics Market Share by Downstream Industry in 2021 & 2028
- Figure 32. North America Thermoplastic Glass Fiber Reinforced Plastics Sales Market Share in Volume by Downstream Industry in 2021
- Figure 33. North America Thermoplastic Glass Fiber Reinforced Plastics Sales Market Share in Value by Downstream Industry in 2021
- Figure 34. Europe Thermoplastic Glass Fiber Reinforced Plastics Sales Market Share in Volume by Downstream Industry in 2021
- Figure 35. Europe Thermoplastic Glass Fiber Reinforced Plastics Sales Market Share in Value by Downstream Industry in 2021
- Figure 36. Asia-Pacific Thermoplastic Glass Fiber Reinforced Plastics Sales Market Share in Volume by Downstream Industry in 2021
- Figure 37. Asia-Pacific Thermoplastic Glass Fiber Reinforced Plastics Sales Market Share in Value by Downstream Industry in 2021
- Figure 38. Latin America Thermoplastic Glass Fiber Reinforced Plastics Sales Market Share in Volume by Downstream Industry in 2021
- Figure 39. Latin America Thermoplastic Glass Fiber Reinforced Plastics Sales Market Share in Value by Downstream Industry in 2021
- Figure 40. Middle East and Africa Thermoplastic Glass Fiber Reinforced Plastics Sales Market Share in Volume by Downstream Industry in 2021
- Figure 41. Middle East and Africa Thermoplastic Glass Fiber Reinforced Plastics Sales Market Share in Value by Downstream Industry in 2021
- Figure 42. Key Raw Materials Price
- Figure 43. Thermoplastic Glass Fiber Reinforced Plastics Manufacturing Cost Structure
- Figure 44. Thermoplastic Glass Fiber Reinforced Plastics Industrial Chain Analysis
- Figure 45. Channels of Distribution
- Figure 46. Distributors Profiles
- Figure 47. Product Picture of High Temperature Thermoplastics
- Figure 48. Global High Temperature Thermoplastics Sales YoY Growth (2017-2028) & (K MT)
- Figure 49. Global Engineering Thermoplastics Sales YoY Growth (2017-2028) & (K MT)
- Figure 50. Global Matrix Resins for Thermoplastic Glass Fiber Reinforced Plastics Sales by Application (2017-2028) & (US$ Billion)
- Figure 51. Global Matrix Resins for Thermoplastic Glass Fiber Reinforced Plastics Market Share by Application in 2021 & 2028
- Figure 52. Product Picture of Aerospace
- Figure 53. Global Aerospace Sales YoY Growth (2017-2028) & (K MT)
- Figure 54. Product Picture of Automotive
- Figure 55. Global Automotive Sales YoY Growth (2017-2028) & (K MT)
- Figure 56. Product Picture of Electronics
- Figure 57. Global Electronics Sales YoY Growth (2017-2028) & (K MT)
- Figure 58. Product Picture of Structural
- Figure 59. Global Structural Sales YoY Growth (2017-2028) & (K MT)
- Figure 60. Product Picture of Medical
- Figure 61. Global Medical Sales YoY Growth (2017-2028) & (K MT)
- Figure 62. Global Matrix Resins for Thermoplastic Glass Fiber Reinforced Plastics Sales by Fields (2017-2028) & (US$ Million)
- Figure 63. Global Matrix Resins for Thermoplastic Glass Fiber Reinforced Plastics Market Share by Fields in 2021 & 2028
- Figure 64. Bottom-up and Top-down Approaches for This Report
- Figure 65. Data Triangulation
- Figure 66. Key Executives Interviewed 144
Market Analysis and Insights:
Due to the COVID-19 pandemic, the global Thermoplastic Glass Fiber Reinforced Plastics market size was value at US$ 4,393.46 million in 2021 and is forecast to be a readjusted size of US$ 6,305.97 million by 2028 with a CAGR of 4.97% during the forecast period 2022-2028.
The global main manufacturers of Thermoplastic Glass Fiber Reinforced Plastics include BASF, Evonik, SABIC, DSM, Rhodia, Lanxess, Avient, Xenia Materials, and Johns Manville, etc.
The North America Thermoplastic Glass Fiber Reinforced Plastics market size was US$ 862.96 million in 2021, while China was about US$ 838.49 million. The proportion of the China was 19.08% in 2021 and it is predicted that the share will reach 21.63% in 2028, trailing a CAGR of 8.45 % through the analysis period.
Scope and Market Size:
The global Thermoplastic Glass Fiber Reinforced Plastics market is segmented by region (country), company, by Glass Fibers, and by Downstream Industry. Players, stakeholders, and other participants in the global Thermoplastic Glass Fiber Reinforced Plastics market will be able to gain the upper hand as they use the report as a powerful resource. The segmental analysis focuses on sales, revenue and forecast by region (country), by Glass Fibers, and by Downstream Industry for the period 2017-2028.
By Company
- BASF
- Evonik
- SABIC
- DSM
- Lanxess
- Avient
- Xenia Materials
- SGL Carbon
- RTP Company
- Toray
- Celanese
- Solvay
- Covestro
- Teijin
- US Liner
- Dupont
- Alformet
- Complam Material
Segment by Glass Fibers
- Glass Mat Reinforced Thermoplastics
- Textile-Reinforced Thermoplastics
- Uni-Directional (UD) Fiber Reinforced Thermoplastics
Segment by Downstream Industry
- Aerospace & Automotive
- Electro & Electronics
- Construction
- Daily Use
- Others
By Region
- North America
- United States
- Canada
- Asia-Pacific
- China
- Japan
- South Korea
- India
- Australia
- Southeast Asia
- Europe
- Germany
- France
- U.K.
- Italy
- Russia
- Latin America
- Mexico
- Brazil
- Argentina
- Colombia
- Middle East & Africa
- Turkey
- Saudi Arabia
- UAE
TABLE OF CONTENTS
1 Thermoplastic Glass Fiber Reinforced Plastics Market Overview
- 1.1 Thermoplastic Glass Fiber Reinforced Plastics Product Overview
- 1.2 Thermoplastic Glass Fiber Reinforced Plastics Market Segment by Glass Fibers
- 1.2.1 Glass Mat Reinforced Thermoplastics
- 1.2.2 Textile-Reinforced Thermoplastics
- 1.2.3 Uni-Directional (UD) Fiber Reinforced Thermoplastics
- 1.3 Global Thermoplastic Glass Fiber Reinforced Plastics Market Size by Glass Fibers
- 1.3.1 Global Thermoplastic Glass Fiber Reinforced Plastics Market Size Overview by Glass Fibers (2017-2028)
- 1.3.2 Global Thermoplastic Glass Fiber Reinforced Plastics Historic Market Size Review by Glass Fibers (2017-2022)
- 1.3.3 Global Thermoplastic Glass Fiber Reinforced Plastics Forecasted Market Size by Glass Fibers (2023-2028)
- 1.4 Key Regions Market Size Segment by Glass Fibers
- 1.4.1 North America Thermoplastic Glass Fiber Reinforced Plastics Sales Breakdown by Glass Fibers (2017-2022)
- 1.4.2 Europe Thermoplastic Glass Fiber Reinforced Plastics Sales Breakdown by Glass Fibers (2017-2022)
- 1.4.3 Asia-Pacific Thermoplastic Glass Fiber Reinforced Plastics Sales Breakdown by Glass Fibers (2017-2022)
- 1.4.4 Latin America Thermoplastic Glass Fiber Reinforced Plastics Sales Breakdown by Glass Fibers (2017-2022)
- 1.4.5 Middle East and Africa Thermoplastic Glass Fiber Reinforced Plastics Sales Breakdown by Glass Fibers (2017-2022)
2 Thermoplastic Glass Fiber Reinforced Plastics Market Competition by Company
- 2.1 Global Top Players by Thermoplastic Glass Fiber Reinforced Plastics Sales (2017-2022)
- 2.2 Global Top Players by Thermoplastic Glass Fiber Reinforced Plastics Revenue (2017-2022)
- 2.3 Global Top Players by Thermoplastic Glass Fiber Reinforced Plastics Price (2017-2022)
- 2.4 Global Top Manufacturers Thermoplastic Glass Fiber Reinforced Plastics Manufacturing Base Distribution, Sales Area, Product Type
- 2.5 Thermoplastic Glass Fiber Reinforced Plastics Market Competitive Situation and Trends
- 2.5.1 Thermoplastic Glass Fiber Reinforced Plastics Market Concentration Rate (2017-2022)
- 2.5.2 Global 3 and 5 Largest Manufacturers by Thermoplastic Glass Fiber Reinforced Plastics Sales and Revenue in 2021
- 2.6 Global Top Manufacturers by Company Type (Tier 1, Tier 2, and Tier 3) & (based on the Revenue in Thermoplastic Glass Fiber Reinforced Plastics as of 2021)
- 2.7 Date of Key Manufacturers Enter into Thermoplastic Glass Fiber Reinforced Plastics Market
- 2.8 Key Manufacturers Thermoplastic Glass Fiber Reinforced Plastics Product Offered
- 2.9 Mergers & Acquisitions, Expansion
3 Thermoplastic Glass Fiber Reinforced Plastics Status and Outlook by Region
- 3.1 Global Thermoplastic Glass Fiber Reinforced Plastics Market Size and CAGR by Region: 2017 VS 2021 VS 2028
- 3.2 Global Thermoplastic Glass Fiber Reinforced Plastics Historic Market Size by Region
- 3.2.1 Global Thermoplastic Glass Fiber Reinforced Plastics Sales in Volume by Region (2017-2022)
- 3.2.2 Global Thermoplastic Glass Fiber Reinforced Plastics Sales in Value by Region (2017-2022)
- 3.2.3 Global Thermoplastic Glass Fiber Reinforced Plastics Sales (Volume & Value), Price and Gross Margin (2017-2022)
- 3.3 Global Thermoplastic Glass Fiber Reinforced Plastics Forecasted Market Size by Region
- 3.3.1 Global Thermoplastic Glass Fiber Reinforced Plastics Sales in Volume by Region (2023-2028)
- 3.3.2 Global Thermoplastic Glass Fiber Reinforced Plastics Sales in Value by Region (2023-2028)
- 3.3.3 Global Thermoplastic Glass Fiber Reinforced Plastics Sales (Volume & Value), Price and Gross Margin (2023-2028)
4 Thermoplastic Glass Fiber Reinforced Plastics by Downstream Industry
- 4.1 Thermoplastic Glass Fiber Reinforced Plastics Market Segment by Downstream Industry
- 4.1.1 Aerospace & Automotive
- 4.1.2 Electro & Electronics
- 4.1.3 Construction
- 4.1.4 Daily Use
- 4.2 Global Thermoplastic Glass Fiber Reinforced Plastics Market Size by Downstream Industry
- 4.2.1 Global Thermoplastic Glass Fiber Reinforced Plastics Market Size Overview by Downstream Industry (2017-2028)
- 4.2.2 Global Thermoplastic Glass Fiber Reinforced Plastics Historic Market Size Review by Downstream Industry (2017-2022)
- 4.2.3 Global Thermoplastic Glass Fiber Reinforced Plastics Forecasted Market Size by Downstream Industry (2023-2028)
- 4.3 Key Regions Market Size Segment by Downstream Industry
- 4.3.1 North America Thermoplastic Glass Fiber Reinforced Plastics Sales Breakdown by Downstream Industry (2017-2022)
- 4.3.2 Europe Thermoplastic Glass Fiber Reinforced Plastics Sales Breakdown by Downstream Industry (2017-2022)
- 4.3.3 Asia-Pacific Thermoplastic Glass Fiber Reinforced Plastics Sales Breakdown by Downstream Industry (2017-2022)
- 4.3.4 Latin America Thermoplastic Glass Fiber Reinforced Plastics Sales Breakdown by Downstream Industry (2017-2022)
- 4.3.5 Middle East and Africa Thermoplastic Glass Fiber Reinforced Plastics Sales Breakdown by Downstream Industry (2017-2022)
5 North America Thermoplastic Glass Fiber Reinforced Plastics by Country
- 5.1 North America Thermoplastic Glass Fiber Reinforced Plastics Historic Market Size by Country
- 5.1.1 North America Thermoplastic Glass Fiber Reinforced Plastics Sales in Volume by Country (2017-2022)
- 5.1.2 North America Thermoplastic Glass Fiber Reinforced Plastics Sales in Value by Country (2017-2022)
- 5.2 North America Thermoplastic Glass Fiber Reinforced Plastics Forecasted Market Size by Country
- 5.2.1 North America Thermoplastic Glass Fiber Reinforced Plastics Sales in Volume by Country (2023-2028)
- 5.2.2 North America Thermoplastic Glass Fiber Reinforced Plastics Sales in Value by Country (2023-2028)
6 Europe Thermoplastic Glass Fiber Reinforced Plastics by Country
- 6.1 Europe Thermoplastic Glass Fiber Reinforced Plastics Historic Market Size by Country
- 6.1.1 Europe Thermoplastic Glass Fiber Reinforced Plastics Sales in Volume by Country (2017-2022)
- 6.1.2 Europe Thermoplastic Glass Fiber Reinforced Plastics Sales in Value by Country (2017-2022)
- 6.2 Europe Thermoplastic Glass Fiber Reinforced Plastics Forecasted Market Size by Country
- 6.2.1 Europe Thermoplastic Glass Fiber Reinforced Plastics Sales in Volume by Country (2023-2028)
- 6.2.2 Europe Thermoplastic Glass Fiber Reinforced Plastics Sales in Value by Country (2023-2028)
7 Asia-Pacific Thermoplastic Glass Fiber Reinforced Plastics by Region
- 7.1 Asia-Pacific Thermoplastic Glass Fiber Reinforced Plastics Historic Market Size by Region
- 7.1.1 Asia-Pacific Thermoplastic Glass Fiber Reinforced Plastics Sales in Volume by Region (2017-2022)
- 7.1.2 Asia-Pacific Thermoplastic Glass Fiber Reinforced Plastics Sales in Value by Region (2017-2022)
- 7.2 Asia-Pacific Thermoplastic Glass Fiber Reinforced Plastics Forecasted Market Size by Region
- 7.2.1 Asia-Pacific Thermoplastic Glass Fiber Reinforced Plastics Sales in Volume by Region (2023-2028)
- 7.2.2 Asia-Pacific Thermoplastic Glass Fiber Reinforced Plastics Sales in Value by Region (2023-2028)
8 Latin America Thermoplastic Glass Fiber Reinforced Plastics by Country
- 8.1 Latin America Thermoplastic Glass Fiber Reinforced Plastics Historic Market Size by Country
- 8.1.1 Latin America Thermoplastic Glass Fiber Reinforced Plastics Sales in Volume by Country (2017-2022)
- 8.1.2 Latin America Thermoplastic Glass Fiber Reinforced Plastics Sales in Value by Country (2017-2022)
- 8.2 Latin America Thermoplastic Glass Fiber Reinforced Plastics Forecasted Market Size by Country
- 8.2.1 Latin America Thermoplastic Glass Fiber Reinforced Plastics Sales in Volume by Country (2023-2028)
- 8.2.2 Latin America Thermoplastic Glass Fiber Reinforced Plastics Sales in Value by Country (2023-2028)
9 Middle East and Africa Thermoplastic Glass Fiber Reinforced Plastics by Country
- 9.1 Middle East and Africa Thermoplastic Glass Fiber Reinforced Plastics Historic Market Size by Country
- 9.1.1 Middle East and Africa Thermoplastic Glass Fiber Reinforced Plastics Sales in Volume by Country (2017-2022)
- 9.1.2 Middle East and Africa Thermoplastic Glass Fiber Reinforced Plastics Sales in Value by Country (2017-2022)
- 9.2 Middle East and Africa Thermoplastic Glass Fiber Reinforced Plastics Forecasted Market Size by Country
- 9.2.1 Middle East and Africa Thermoplastic Glass Fiber Reinforced Plastics Sales in Volume by Country (2023-2028)
- 9.2.2 Middle East and Africa Thermoplastic Glass Fiber Reinforced Plastics Sales in Value by Country (2023-2028)
10 Company Profiles and Key Figures in Thermoplastic Glass Fiber Reinforced Plastics Business
- 10.1 BASF
- 10.1.1 BASF Corporation Information
- 10.1.2 BASF Introduction and Business Overview
- 10.1.3 BASF Thermoplastic Glass Fiber Reinforced Plastics Sales, Revenue and Gross Margin (2017-2022)
- 10.1.4 BASF Thermoplastic Glass Fiber Reinforced Plastics Products Offered
- 10.1.5 BASF Recent Development
- 10.2 Evonik
- 10.2.1 Evonik Corporation Information
- 10.2.2 Evonik Introduction and Business Overview
- 10.2.3 Evonik Thermoplastic Glass Fiber Reinforced Plastics Sales, Revenue and Gross Margin (2017-2022)
- 10.2.4 Evonik Thermoplastic Glass Fiber Reinforced Plastics Products Offered
- 10.3 SABIC
- 10.3.1 SABIC Corporation Information
- 10.3.2 SABIC Introduction and Business Overview
- 10.3.3 SABIC Thermoplastic Glass Fiber Reinforced Plastics Sales, Revenue and Gross Margin (2017-2022)
- 10.3.4 SABIC Thermoplastic Glass Fiber Reinforced Plastics Products Offered
- 10.4 DSM
- 10.4.1 DSM Corporation Information
- 10.4.2 DSM Introduction and Business Overview
- 10.4.3 DSM Thermoplastic Glass Fiber Reinforced Plastics Sales, Revenue and Gross Margin (2017-2022)
- 10.4.4 DSM Thermoplastic Glass Fiber Reinforced Plastics Products Offered
- 10.5 Lanxess
- 10.5.1 Lanxess Corporation Information
- 10.5.2 Lanxess Introduction and Business Overview
- 10.5.3 Lanxess Thermoplastic Glass Fiber Reinforced Plastics Sales, Revenue and Gross Margin (2017-2022)
- 10.5.4 Lanxess Thermoplastic Glass Fiber Reinforced Plastics Products Offered
- 10.5.5 Lanxess Recent Development
- 10.6 Avient
- 10.6.1 Avient Corporation Information
- 10.6.2 Avient Introduction and Business Overview
- 10.6.3 Avient Thermoplastic Glass Fiber Reinforced Plastics Sales, Revenue and Gross Margin (2017-2022)
- 10.6.4 Avient Thermoplastic Glass Fiber Reinforced Plastics Products Offered
- 10.7 Xenia Materials
- 10.7.1 Xenia Materials Corporation Information
- 10.7.2 Xenia Materials Introduction and Business Overview
- 10.7.3 Xenia Materials Thermoplastic Glass Fiber Reinforced Plastics Sales, Revenue and Gross Margin (2017-2022)
- 10.7.4 Xenia Materials Thermoplastic Glass Fiber Reinforced Plastics Products Offered
- 10.8 SGL Carbon
- 10.8.1 SGL Carbon Corporation Information
- 10.8.2 SGL Carbon Introduction and Business Overview
- 10.8.3 SGL Carbon Thermoplastic Glass Fiber Reinforced Plastics Sales, Revenue and Gross Margin (2017-2022)
- 10.8.4 SGL Carbon Thermoplastic Glass Fiber Reinforced Plastics Products Offered
- 10.9 RTP Company
- 10.9.1 RTP Company Corporation Information
- 10.9.2 RTP Company Introduction and Business Overview
- 10.9.3 RTP Company Thermoplastic Glass Fiber Reinforced Plastics Sales, Revenue and Gross Margin (2017-2022)
- 10.9.4 RTP Company Thermoplastic Glass Fiber Reinforced Plastics Products Offered
- 10.10 Toray
- 10.10.1 Toray Corporation Information
- 10.10.2 Toray Introduction and Business Overview
- 10.10.3 Toray Thermoplastic Glass Fiber Reinforced Plastics Sales, Revenue and Gross Margin (2017-2022)
- 10.10.4 Toray Thermoplastic Glass Fiber Reinforced Plastics Products Offered
- 10.10.5 Toray Recent Development
- 10.11 Celanese
- 10.11.1 Celanese Corporation Information
- 10.11.2 Celanese Introduction and Business Overview
- 10.11.3 Celanese Thermoplastic Glass Fiber Reinforced Plastics Sales, Revenue and Gross Margin (2017-2022)
- 10.11.4 Celanese Thermoplastic Glass Fiber Reinforced Plastics Products Offered
- 10.12 Solvay
- 10.12.1 Solvay Corporation Information
- 10.12.2 Solvay Introduction and Business Overview
- 10.12.3 Solvay Thermoplastic Glass Fiber Reinforced Plastics Sales, Revenue and Gross Margin (2017-2022)
- 10.12.4 Solvay Thermoplastic Glass Fiber Reinforced Plastics Products Offered
- 10.13 Covestro
- 10.13.1 Covestro Corporation Information
- 10.13.2 Covestro Introduction and Business Overview
- 10.13.3 Covestro Thermoplastic Glass Fiber Reinforced Plastics Sales, Revenue and Gross Margin (2017-2022)
- 10.13.4 Covestro Thermoplastic Glass Fiber Reinforced Plastics Products Offered
- 10.14 Teijin
- 10.14.1 Teijin Corporation Information
- 10.14.2 Teijin Introduction and Business Overview
- 10.14.3 Teijin Thermoplastic Glass Fiber Reinforced Plastics Sales, Revenue and Gross Margin (2017-2022)
- 10.14.4 Teijin Thermoplastic Glass Fiber Reinforced Plastics Products Offered
- 10.15 US Liner
- 10.15.1 US Liner Corporation Information
- 10.15.2 US Liner Introduction and Business Overview
- 10.15.3 US Liner Thermoplastic Glass Fiber Reinforced Plastics Sales, Revenue and Gross Margin (2017-2022)
- 10.15.4 US Liner Thermoplastic Glass Fiber Reinforced Plastics Products Offered
- 10.16 DuPont
- 10.16.1 DuPont Corporation Information
- 10.16.2 DuPont Introduction and Business Overview
- 10.16.3 DuPont Thermoplastic Glass Fiber Reinforced Plastics Sales, Revenue and Gross Margin (2017-2022)
- 10.16.4 DuPont Thermoplastic Glass Fiber Reinforced Plastics Products Offered
- 10.17 Alformet
- 10.17.1 Alformet Corporation Information
- 10.17.2 Alformet Introduction and Business Overview
- 10.17.3 Alformet Thermoplastic Glass Fiber Reinforced Plastics Sales, Revenue and Gross Margin (2017-2022)
- 10.17.4 Alformet Thermoplastic Glass Fiber Reinforced Plastics Products Offered
- 10.18 CompLam Material
- 10.18.1 CompLam Material Corporation Information
- 10.18.2 CompLam Material Introduction and Business Overview
- 10.18.3 CompLam Material Thermoplastic Glass Fiber Reinforced Plastics Sales, Revenue and Gross Margin (2017-2022)
- 10.18.4 CompLam Material Thermoplastic Glass Fiber Reinforced Plastics Products Offered
11 Upstream, Opportunities, Challenges, Risks and Influences Factors Analysis
- 11.1 Thermoplastic Glass Fiber Reinforced Plastics Key Raw Materials
- 11.1.1 Key Raw Materials
- 11.1.2 Key Raw Materials Price
- 11.1.3 Raw Materials Key Suppliers
- 11.2 Manufacturing Cost Structure
- 11.2.1 Raw Materials
- 11.2.2 Labor Cost
- 11.2.3 Manufacturing Expenses
- 11.3 Thermoplastic Glass Fiber Reinforced Plastics Industrial Chain Analysis
- 11.4 Thermoplastic Glass Fiber Reinforced Plastics Market Dynamics
- 11.4.1 Thermoplastic Glass Fiber Reinforced Plastics Market Drivers
- 11.4.2 Thermoplastic Glass Fiber Reinforced Plastics Market Challenges
- 11.4.3 Thermoplastic Glass Fiber Reinforced Plastics Market Restraints
12 Marketing Strategy Analysis, Distributors
- 12.1 Sales Channel
- 12.2 Thermoplastic Glass Fiber Reinforced Plastics Distributors
- 12.3 Thermoplastic Glass Fiber Reinforced Plastics Downstream Customers
13 Matrix Resins for Thermoplastic Glass Fiber Reinforced Plastics by Application
- 13.1 Matrix Resins for Thermoplastic Glass Fiber Reinforced Plastics Market Segment by Application
- 13.1.1 High Temperature Thermoplastics
- 13.1.2 Engineering Thermoplastics
- 13.2 Global Matrix Resins for Thermoplastic Glass Fiber Reinforced Plastics Market Size by Application
- 13.2.1 Global Matrix Resins for Thermoplastic Glass Fiber Reinforced Plastics Market Size Overview by Application (2017-2028)
- 13.2.2 Global Matrix Resins for Thermoplastic Glass Fiber Reinforced Plastics Historic Market Size Review by Application (2017-2022)
- 13.2.3 Global Matrix Resins for Thermoplastic Glass Fiber Reinforced Plastics Forecasted Market Size by Application (2023-2028)
14 Matrix Resins for Thermoplastic Glass Fiber Reinforced Plastics by Fields
- 14.1 Matrix Resins for Thermoplastic Glass Fiber Reinforced Plastics Market Segment by Fields
- 14.1.1 Aerospace
- 14.1.2 Automotive
- 14.1.3 Electronics
- 14.1.4 Structural
- 14.1.5 Medical
- 14.2 Global Matrix Resins for Thermoplastic Glass Fiber Reinforced Plastics Market Size by Fields
- 14.2.1 Global Matrix Resins for Thermoplastic Glass Fiber Reinforced Plastics Market Size Overview by Fields (2017-2028)
- 14.2.2 Global Matrix Resins for Thermoplastic Glass Fiber Reinforced Plastics Historic Market Size Review by Fields (2017-2022)
- 14.2.3 Global Matrix Resins for Thermoplastic Glass Fiber Reinforced Plastics Forecasted Market Size by Fields (2023-2028)
15 Research Findings and Conclusion
16 Appendix
- 16.1 Research Methodology
- 16.1.1 Methodology/Research Approach
- 16.1.2 Data Source
- 16.2 Author Details
- 16.3 Disclaimer